R E S E A R C H A R T I C L E
Open Access
Resolution of five-component mixture using
mean centering ratio and inverse least squares
chemometrics
Mahmoud Mohamed Issa
1, R
’
afat Mahmoud Nejem
2*, Alaa Mohamed Abu Shanab
3and Nahed Talab Shaat
4Abstract
Background:A comparative study of the use of mean centering of ratio spectra and inverse least squares for the resolution of paracetamol, methylparaben, propylparaben, chlorpheniramine maleate and pseudoephedrine hydrochloride has been achieved showing that the two chemometric methods provide a good example of the high resolving power of these techniques. Method (I) is the mean centering of ratio spectra which depends on using the mean centered ratio spectra in four successive steps that eliminates the derivative steps and
therefore the signal to noise ratio is improved. The absorption spectra of prepared solutions were measured in the range of 220–280 nm. Method (II) is based on the inverse least squares that depend on updating
developed multivariate calibration model. The absorption spectra of the prepared mixtures in the range 230–270 nm were recorded.
Results: The linear concentration ranges were 0–25.6, 0–15.0, 0–15.0, 0–45.0 and 0–100.0 μg mL-1 for paracetamol, methylparaben, propylparaben, chlorpheniramine maleate and pseudoephedrine hydrochloride, respectively. The mean recoveries for simultaneous determination were between 99.9-101.3% for the two methods. The two developed methods have been successfully used for prediction of five-component mixture in Decamol Flu syrup with good selectivity, high sensitivity and extremely low detection limit.
Conclusion:No published method has been reported for simultaneous determination of the five components of this mixture so that the results of the mean centering of ratio spectra method were compared with those of the proposed inverse least squares method. Statistical comparison was performed using t-test and F-ratio at P = 0.05. There was no significant difference between the results.
Keywords:Methylparaben, Propylparaben, Chlorpheniramine, Pseudoephedrine, Mean centering ratio, Inverse least square, Spectroscopy
Background
Paracetamol (PA) is an analgesic and antipyretic agent [1], which is associated with pseudoephedrine hydro-chloride (PS), a direct- and indirect-acting sympatho-mimetic agent [2] and chlorpheniramine maleate (CH), a potent antihistaminic [3], in addition to methyl-paraben (MP) and propylmethyl-paraben (PP), which are used as preservatives. The combination of PA, CH and PS is used for symptomatic treatment of coughs and the common cold. The UV absorption spectra of PA, MP,
PP, CH, and PS displays considerable overlapping, where the application of the conventional spectropho-tometry failed to resolve it. No spectrophotmetric analytical method has been reported for the simultan-eous determination of PA, MP, PP, CH, and PS in a multicomponent mixture.
While official methods have been reported for the determination of each of these drugs alone in their for-mulations [4], the most prominent method for simul-taneous determination of PA, MP, PP, CH, and PS is the HPLC, GC-MS or LC-MS [5-11]. However, these reported methods suffered from using solvents of high cost, time-consuming extraction procedure and long chromatographic retention time. In addition, the United * Correspondence:[email protected]
2
Analytical Chemistry, Department of Chemistry, Alaqsa University, P.O.Box 4051, Gaza, Palestine
Full list of author information is available at the end of the article
States pharmacopeia suggested the reduction in amount of toxic organic solvents which used in HPLC assays that caused harm to human health and environment [12]. Therefore, chemometric-assisted spectrophotom-etry as a simple, rapid and low cost method can be a good alternative one if it is combined with multivariate calibration methods for determination of a complex in pharmaceutical quality control laboratories. The devel-opment of chemometric techniques has enabled the ap-plication to the analysis of complex mixtures without the need for any prior separation.
In particular, mean centering of ratio spectra (MCR) is used to remove the contribution of absorb-ing reagent from data matrix precisely and therefore the absorbance of reagent(s) is exactly eliminated [13-15]. Mean centering of ratio spectra have been presented by Afkhami and Bahram [16] applied for simultaneous analysis of binary and ternary mixture [17-22] MCR method has the advantage of eliminating the derivative steps and therefor the signal-to-noise is not degraded.
Multivariate calibration technique is gaining publi-city for quantification of multi-component system even in the presence of intense spectral overlap between analytes [23,24]. Classical least squares, partial least squares, principal component regression and inverse least squares are the most common multivariate cali-bration tool due to their powerful calicali-bration and ease of implementation [25-31].
In the present work a simple, rapid and inexpensive mean centering of ratio spectra (MCR) and inverse least squares methods (ILS) are developed for the resolution of five-component mixture. The results of the two chemometric assisted spectrophotometric methods were compared with each other.
Theoretical background
MCR developed method
If a mixture of five compounds (PA, MP, PP, CH and PS) is considered where Beer’s law is obeyed for all compounds over the whole wavelength range used, then
Am ¼∝PACPAþ∝MPCMPþ∝PPCPPþ∝PSCPS ð1Þ
where
Amis the vector of the absorbance of the mixture, αPA,αMP,αPP,αCH, andαPSare the absorptivity
vectors of PA, MP, PP, CH
and PS and CPA, CMP, CPP, CCH, and CPSare the
concentrations of PA, MP, PP, CH and PS, respectively.
If Equation (1) is divided byαCHcorresponding to the spectrum of a standard solution of CH in the mixture, the first ratio spectrum is obtained
x¼ Am
∝CH¼
∝PACPA
∝CH þ
∝MPCMP
∝CH þ
∝PPCPP
∝CH þCCH þ∝PSCPS
∝CH
ð2Þ
If the Equation (2) is mean centered, then
mc x¼mc∝PA∝CPA
CH þmc
∝MPCMP
∝CH þmc
∝PPCPP
∝CH þ∝PS∝CPS
CH ð3Þ
and if Equation (3) is divided bymcαPA
αCH, the second ratio spectrum is obtained
y¼ mcx
mcαPA
αCH
¼CPAþZ CMPþ mc αPPCPP
αCH
mcαPA
αCH
þ mc αPSCPS
αCH
mcαPA
αCH
mcy¼ mcZ CMPþmc mc αPP
αCHCPP
mcαPA
αCH
þ mc mc
αPS
αCHCPS
mcαPA
αCH
ð4Þ
In the same way, the third ratio spectrum can be obtained
mc mc ymc z¼mcoCPPþmc
mc∝PP=∝CH
mc∝PA=∝CH CPS
mc z ð5Þ
Finally we obtain the fourth ratio spectrum
mc mc ymc=mc z
o ¼KCPS ðK is a constantÞ ð6Þ
Equation (6) is the mathematical basis of multi-component analysis which permits the determination of the concentration of each compounds without interfer-ence from the other components of the mixture.
In practice, the signal of the fourth ratio spectrum of PS is dependent only on the concentration value CPS and Am
αCH, but is independent of the concentration values
CPA, CMP, CPP, and CCHin the mixture. In the developed method, the concentration CPSin the mixture is propor-tional to the amount of mc mcy=mcZmc o corresponding to a maximum or minimum point.
A calibration curve could be constructed by plotting
components (PA, MA, PP and CH) are determined sep-arately by analogous procedures of PS.
ILS method
The mathematical formulations of this method, in the matrix compact form, can be written as
C¼PAþE ð7Þ where the matrix A represents the absorbance matrix, C is the concentration matrix, P is the calibration coeffi-cients and E is a matrix of concentration prediction error. This inverse Beer’s law expression implies that the concentration is a function of the absorbance at a series of given wavelengths. The P matrix of coefficients can be solved by computing:
P¼CA−1 ð8Þ if the A matrix is not square, the pseudo-inverse must be used instead :
^
P¼C A′AA′−1
ð9Þ
Therefore the C matrix can be determined by using the following equation
C¼PA^ ð10Þ This model appears to be the best approach for almost all quantitative analyses since no knowledge of the sam-ple composition is needed beyond the concentrations of the constituents of interest.
Materials and methods
Instrumentation and software
A shimadzu (Kyoto, Japan) UV-1650 PC, UV-Visible double-beam spectrophotometer with two matched 1 cm path-length quartz cells was used. This instrument is used for all the absorbance measurements. Using the “online matrix calculator bluebit, powered by Net Matrix Library (www.bluebit.gr/matrix-calculator), all the treat-ment of data was performed. The subsequent statistical manipulations were performed by transferring the spec-tral data to Microsoft Excel 2010 program and SPSS.
Reagents and materials
Pharmaceutical grade of PA, MP, PP, CH and PS with claimed purities of 99.8, 99.9, 99.7, 99.7 and 99.9%, respectively according to manufactures certificate were kindly donated by the Middle East pharmaceuticals and cosmetics laboratories, Palestine.
Decamol Flu syrup (batch number 1943) (Middle East pharmaceuticals and cosmetics laboratories, Palestine) was used. Each 5.0 ml contains 160 mg PA, 5.0 mg MP, 1.0 mg PP, 1.0 mg CH and 1.0 mg PS.
Stock standard and working solutions
Stock solutions of PA, MP, PP, CH and PS were inde-pendently prepared by dissolving 100.0 mg of each in 100.0 mL of 0.1 M HCl (Merck). Working solutions were prepared by transferring appropriate volumes of the stock solutions to separate 25.0 ml volumetric flasks and diluted to their marks with 0.1 M HCl. A series of five solutions of each compound in the concentration range of 0– 25.6μg mL-1for PA, 0–15.0μg mL-1MP, 0–15.0μg mL-1 PP, 0–45.0 μg mL-1 CH and 0–100.0 μg mL-1 PS was obtained from the stock solutions. A 25 laboratory sample mixtures containing different ratios of the five studied components were prepared and used in the calibration and validation sets.
Procedures
Mean centering of ratio spectra method (MCR)
The absorption spectra of prepared solutions were measured in the range of 220–280 nm. Beer’s law was obeyed for all compounds over the entire wavelengths (220–280 nm).
For PS, the recorded spectra were divided by standard spectrum of 1.0μg mL-1CH to obtain the first ratio spec-tra which was then mean centered. These vectors were then divided by the mean center of αPA
αCH and therefore the mean centering of the second ratio spectra were obtained. In the same way, the third and fourth ratio spectra can be obtained as shown in Table 1.
The mean centered values of the fourth ratio spectra at 265, 230, 230, 240 and 260 nm for PA, MP, PP, CH and PS, respectively were measured and plotted against the correspond concentration of each drug to construct their calibration curves.
Different synthetic mixtures containing different ratios of PA, MP, PP, CH and PS within their calibration ranges were prepared. The spectra of these mixtures were recorded and the MCR procedure was performed to pre-dict the concentration of each compound in the mixture.
2.0 ml of Decamol Flu syrup was transferred to 100.0 ml volumetric flasks (five times) dissolved in 0.1 M HCl.
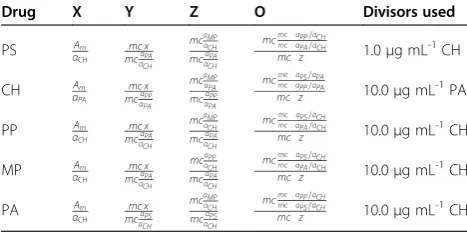
Table 1 The first, second, third and fourth ratio spectra data
Drug X Y Z O Divisors used
PS Am
αCH mcmc xαCHαPA mcαMPαCH mcαCHαPA
mcmcmc αPPαPA==αCHαCH
mc z 1.0μg mL
-1CH
CH Am
αPA
mc x mcαPAαPP
mcαMPαPA mcαPAαPP
mcmcmc αPSαPP==αPAαPA
mc z 10.0μg mL
-1PA
PP Am
αCH
mc x mcααPA
CH
mcαMPαCH mcααPA
CH
mcmcmc αPSαPA==αCHαCH
mc z 10.0μg mL
-1CH
MP Am
αCH mcmc xαCHαPA mcαPPα
CH
mcαCHαPA
mcmcmc αPSα =αCH
PA=αCH
mc z 10.0μg mL
-1CH
PA Am
αCH mcmc xαCHαPS mcαMPα
CH
mcαCHαPS
mcmcmc αPPα =αCH
PS=αCH
mc z 10.0μg mL
Then 1 ml of the solution was transferred to 25.0 ml volu-metric flasks and the volume was completed with the same solvent. The proposed method was applied to the prepared solutions.
Inverse least squares method (ILS)
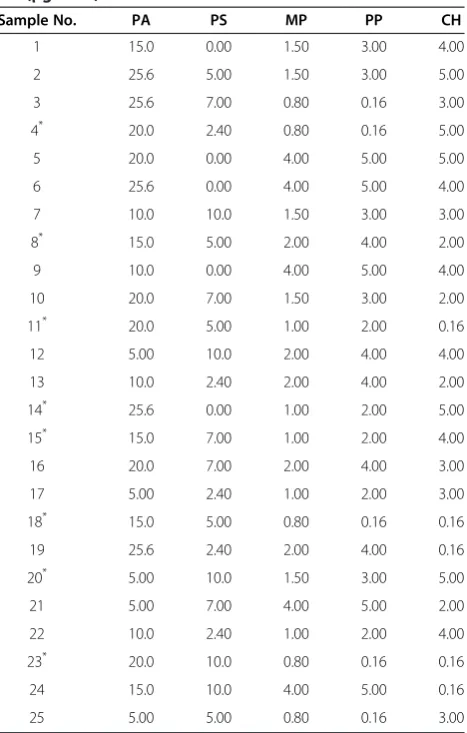
Multilevel multifactor design was used for construction of calibration and validation sets. A five-level, five-factor calibration design was used in order to prepare 25 la-boratory prepared mixtures containing different ratios of the five studied drugs, the concentrations details are given in Table 2. The absorption spectra of the prepared mixtures in the range 230–270 nm were recorded. The inverse Beer’s law was obeyed where the concentration is a function of the absorbance at a series of wavelengths (230, 235, 240, 245, 250, 255, 260, 265 and 270 nm). The absorbance’s data were obtained by measuring at nine points with intervals of Δλ= 5 nm in the spectrum. Seventeen mixtures were used for building the calibra-tion model. The remaining eight mixtures were used for validation set. The concentration of each component was calculated using the calibration model. The pro-posed method was applied to the previously prepared solutions of Decamol Flu syrup.
Results and discussion
The absorption spectra of PA, MP, PP, CH and PS, Figure 1, displays considerable overlapping, where the application of conventional spectrophotometry failed to resolve these overlapping. To the best of our knowledge, there are no other techniques for the simultaneous spectrophotometry determination of these drugs by chemometric methods.
Table 2 Concentrations of PA, PS, MP, PP and CH (μg mL-1) in the calibration and validation sets
Sample No. PA PS MP PP CH
1 15.0 0.00 1.50 3.00 4.00
2 25.6 5.00 1.50 3.00 5.00
3 25.6 7.00 0.80 0.16 3.00
4* 20.0 2.40 0.80 0.16 5.00
5 20.0 0.00 4.00 5.00 5.00
6 25.6 0.00 4.00 5.00 4.00
7 10.0 10.0 1.50 3.00 3.00
8* 15.0 5.00 2.00 4.00 2.00
9 10.0 0.00 4.00 5.00 4.00
10 20.0 7.00 1.50 3.00 2.00
11* 20.0 5.00 1.00 2.00 0.16
12 5.00 10.0 2.00 4.00 4.00
13 10.0 2.40 2.00 4.00 2.00
14* 25.6 0.00 1.00 2.00 5.00
15* 15.0 7.00 1.00 2.00 4.00
16 20.0 7.00 2.00 4.00 3.00
17 5.00 2.40 1.00 2.00 3.00
18* 15.0 5.00 0.80 0.16 0.16
19 25.6 2.40 2.00 4.00 0.16
20* 5.00 10.0 1.50 3.00 5.00
21 5.00 7.00 4.00 5.00 2.00
22 10.0 2.40 1.00 2.00 4.00
23* 20.0 10.0 0.80 0.16 0.16
24 15.0 10.0 4.00 5.00 0.16
25 5.00 5.00 0.80 0.16 3.00
*Samples used for validation.
-0.05 0 0.05 0.1 0.15 0.2 0.25 0.3
220.0 240.0 260.0 280.0 300.0 320.0 340.0
Ab
s.
wavelength (nm)
Methylparaben, 2.40 µg mL -1
Paracetamol, 3.36 µg mL-1
Chloropheniramine maleate, 5.50 µg mL -1
Propylparaben, 2.0 µg mL -1
Pseudophedrine hydrochloride, 23.0 µg mL -1
Mean centering of ratio spectra method (MCR)
The developed MCR method depends on the mean centering of ratio spectra, it eliminates the derivative steps and therefore signal to noise ratio is enhanced [16] and it has been applied for resolving the five-component mixture.
In order to optimize the developed MCR method, ef-fect of divisor on the selectivity of the method has been tested. Different concentrations of each CH, PS and MP were tested. Results in Table 1 shows that the divisor had a great effect on the selectivity of determination of PA, MP, PP, CH and PS where reproducible and good
results have been obtained upon using concentration of 10.0 μg mL-1 of CH (for PP, MP and PA), 1.0 μg mL-1 CH (for PS) and 10.0 μg mL-1 PA (for CH) as divisors. On the other hand, changing the concentration of the divisor had no significant effect on the analytical param-eters. The amount ofΔλhad no effect on the mean cen-tering of ratio spectra. AΔλof 5 nm was used.
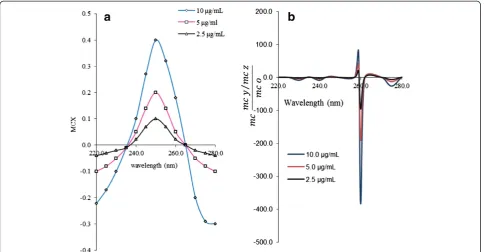
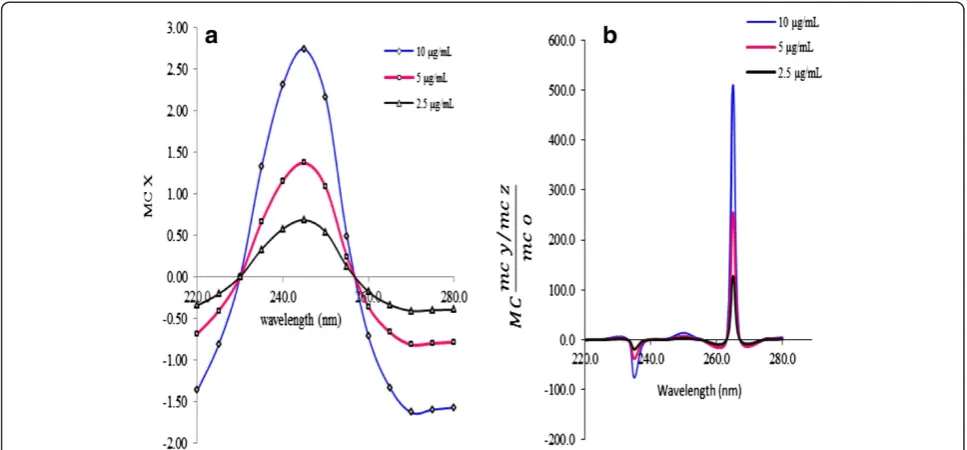
The absorption spectra of the standard solutions of PS was divided by the normalized spectrum of 1.0μg mL-1 CH and the first ratio spectra were obtained (Figure 2a). After that the fourth ratio spectra according to Equation 6 were obtained. The concentration of PS was determined Figure 2The first ratio spectra of different concentrations of PS (a) and fourth ratio spectra (b).
by measuring the amplitude at 260 nm corresponding to a minimum wavelength in the fourth ratio spectra as shown in (Figure 2b). For the prediction of concentration of PS in synthetic mixtures and real samples, the sample was done in similar steps.
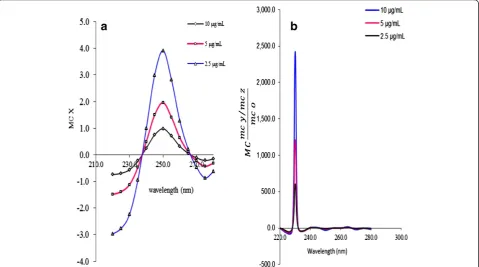
In the same way, the first ratio spectra for CH (Figure 3a), PP (Figure 4a), MP (Figure 5a) and PA (Figure 6a) were obtained. And the fourth ratio spectra
were also obtained for other drugs. The concentration of PS, CH, PP, MP and PA was determined by measuring the amplitude at 260 (Figure 2b), 240 (Figure 3b), 230 (Figure 4b), 230 (Figure 5b) and 265 nm (Figure 6b), respectively.
Beer’s law was obeyed in the concentration 0– 25.6 μg mL-1 for PA, 0–15.0 μg mL-1 for MP, 0– 15.0μg mL-1PP, 0–45.0μg mL-1CH and 0–100.0μg mL-1 Figure 4The first ratio spectra of different concentrations of PP (a) and fourth ratio spectra (b).
PS. Table 3 shows the linear regression parameters for calibration data for simultaneous determination of PA, MP, PP, CH and PS in their five-component mixtures. Limit of detections (defined as the concentration equivalent to three times the standard deviation of five replicate measurements of the blank) are also shown in Table 3.
To check the reproducibility of the method, the rela-tive standard deviation (R.S.D) for five replicate determi-nations of 5.0μg mL-1of each PA, MP, PP, CH and PS, in five-component mixtures were obtained as 1.91, 1.58, 1.58, 2.45 and 1.66%, respectively. The mean recoveries for simultaneous determination of the five components were obtained as 100.0, 99.9, 100.1, 101.3 and 101.1% for PA, MP, PP, CH and PS, respectively.
In order to obtain the accuracy and precision of the method, several synthetic mixtures with different con-centration ratios of PA, MP, PP, CH and PS were
analyzed using the proposed method. The results are summarized in Table 4. The prediction error of single component in the mixtures was calculated as the rela-tive standard error (R.S.E) of the prediction concentra-tion [32].
R:S:E %ð Þ ¼
XN
j¼1
^
Cj−Cj
2
XN
j¼1
Cj 2
0 B B B B B @
1 C C C C C A
1 2
100
where N is the number of samples,Cjthe concentration of component in the mixture andĈjthe estimated con-centration. The total prediction error of N samples is calculated as follows:
R:S:E:tð Þ ¼%
XM
i¼1 XN
j¼1
^
Ci j−Ci j
2
XM
i¼1 XN
j¼1
Ci j
2 0
B B B B B @
1 C C C C C A
1 2
100
whereCijis the concentration of the component in the jthsamples andĈij its estimation. Table 4 also includes the single and total relative errors for each the five com-ponent mixtures.
Inverse least squares method (ILS)
As explained in the previous section, the constant (P) values were calculated by using the linear equation Figure 6The first ratio spectra of different concentrations of PA (a) and fourth ratio spectra (b).
Table 3 Analytical characteristics for analysis of PA, PS, MP, PP and CH by MCR method
Analyte λ
(nm)
Calibration equations
R2 Linear
concentration range (μg mL-1)
LOD (μg mL-1)
PA 265.0 Y = 47.28C + 2.6 0.9999 0-25.6 0.05
MP 230.0 Y = 224.6C-2.03 0.9991 0-15.0 0.05
PP 230.0 Y =−13.0C + 1.13
0.9995 0-15.0 0.05
CH 240.0 Y = 29.77C + 1.13 0.9981 0-45.0 0.08
system between the absorbance data and calibration set. The coefficients matrix (P) was placed in the linear equation system; the following expressions for the nine wavelengths were obtained as
14:4693A1−6:34365A2þ1:24042A3þ13:5241
þ0:12545A5þ0:049169A6
þ1:56462A7−9:05168A8−11:3068A9¼CPA ð11Þ
−80:6666A1þ35:0631A2−6:91880A3
þ181:818A4−165:446A5−0:290306A6−8:79016A7
þ3:42144A8þ62:5319A9
¼CMP ð12Þ
71:3036A1−43:1749A2
þ8:5012A3−164:8187A4þ155:663A5
þ0:352060A6
þ10:7823A7−18:4979A8−76:9059A9
¼CPP ð13Þ
46:8593A1−9:4004A2þ1:83859A3−45:8447A4
þ1:58366A5þ0:073015A6þ2:31966A7
þ43:2512A8−16:6275A9
¼CCH ð14Þ
657:075A1þ560:177A2−107:727A3−4826:09A4
þ4745:17A5−3:8066A6−125:563A7−1871:61A8
þ988:299A9
¼CPS ð15Þ
where, CPA, CMP, CCH, CPP and CPS are the concentra-tion of PA, MP, CH, PP and PS, respectively. The ab-sorbance values at nine points, (230–270 nm) as in Figure 1 for samples were introduced to into the above equations. The concentration of the five component mixtures in Decamol Flu syrup was calculated.
Beer’s law was obeyed in the concentration 0–25.6, 0– 15.0, 0–15.0, 0–45.0, 0–100.0 μg mL-1 for PA, MP, PP, CH and PS, respectively. Table 5 summarizes the linear regression parameters for the simultaneous determin-ation of PA, MP, PP, CH and PS in their mixtures and limit of detections.
To check the reproducibility of the method, the R.S.D for five replicate determinations of 5.0 μg mL-1each of PA, MP, PP, CH and PS, in the mixtures were obtained as 1.72, 2.13, 1.45, 2.02, and 1.33%, respectively. The mean recoveries were 99.95, 100.38, 100.64, 100.10 and 99.91% for PA, MP, PP, CH and PS respectively.
In order to obtain the accuracy and precision of the ILS method, several synthetic mixtures with different concentration ratios of PA, MP, PP, CH and PS were an-alyzed using the proposed method. The results are given in Table 6. The standard error of prediction (S.E.P) was calculated as [26]:
S:E:P:¼
XN
j¼1
^
Cj−Cj
2
N
0 B B B B @
1 C C C C A
1 2
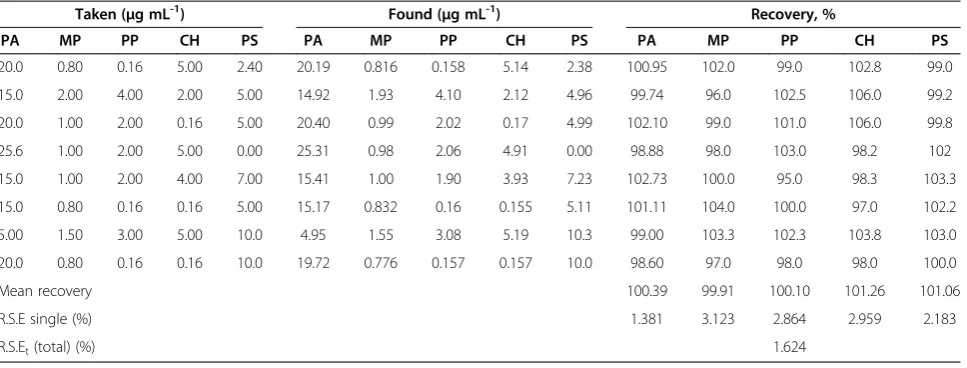
Table 4 Analysis of PA, PS, MP, PP and CH in synthetic mixture by MCR method
Taken (μg mL-1) Found (μg mL-1) Recovery, %
PA MP PP CH PS PA MP PP CH PS PA MP PP CH PS
20.0 0.80 0.16 5.00 2.40 20.19 0.816 0.158 5.14 2.38 100.95 102.0 99.0 102.8 99.0
15.0 2.00 4.00 2.00 5.00 14.92 1.93 4.10 2.12 4.96 99.74 96.0 102.5 106.0 99.2
20.0 1.00 2.00 0.16 5.00 20.40 0.99 2.02 0.17 4.99 102.10 99.0 101.0 106.0 99.8
25.6 1.00 2.00 5.00 0.00 25.31 0.98 2.06 4.91 0.00 98.88 98.0 103.0 98.2 102
15.0 1.00 2.00 4.00 7.00 15.41 1.00 1.90 3.93 7.23 102.73 100.0 95.0 98.3 103.3
15.0 0.80 0.16 0.16 5.00 15.17 0.832 0.16 0.155 5.11 101.11 104.0 100.0 97.0 102.2
5.00 1.50 3.00 5.00 10.0 4.95 1.55 3.08 5.19 10.3 99.00 103.3 102.3 103.8 103.0
20.0 0.80 0.16 0.16 10.0 19.72 0.776 0.157 0.157 10.0 98.60 97.0 98.0 98.0 100.0
Mean recovery 100.39 99.91 100.10 101.26 101.06
R.S.E single (%) 1.381 3.123 2.864 2.959 2.183
R.S.Et(total) (%) 1.624
Table 5 Analytical Characteristics for analysis of PA, MP, PP, CH and PS by ILS method
Analyte Calibration equations
R2 Linear concentration
range (μg mL-1) (μg mLLOD-1)
PA Eq. (11) 0.9999 0-25.6 0.08
MP Eq. (12) 0.9992 0-15.0 0.04
PP Eq. (13) 0.9985 0-15.0 0.03
CH Eq. (14) 0.9981 0-45.0 0.05
where N is number of samples,Cj the concentration of component in jth mixture andĈjthe estimated concen-tration. The standard error of calibration denoted by S.E.C is calculated as follows:
S:E:C:¼
XN
j¼1
^
Cj−Cj
2
N−P−1 0
B B B B @
1 C C C C A
1 2
where p is the number of analytes in the sample. Table 6 also shows the standard error of prediction and the standard error of calibration.
Good coincidence was observed for the assay results by applications of the two methods described in this paper. Comparison of the results in Table 4 and Table 6 proves that the analytical characteristics obtained by MCR method were similar to those obtained by ILS
method. These methods appear to be the preeminant ap-proach for almost quantitative analysis, since no know-ledge for the sample composition is required beyond the concentrations of the constituents of interest, where the concentration of the analytes in real samples is always unknown.
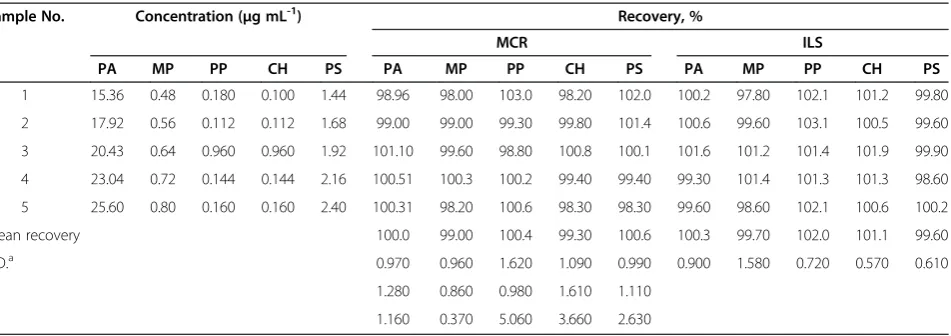
Analysis of pharmaceutical syrup
The proposed MCR and ILS methods were applied to the simultaneous determinations of PA, MP, PP, CH and PS in commercial syrup. Five replicates measurements were made for the determinations of PA, MP, PP, CH and PS. Satisfactory results were obtained for each com-pound in good agreement with claimed labels (Table 7). The results of the developed MCR method were com-pared with those of the proposed ILS method. Statistical comparison between the results was preformed with regards to accuracy and precision using t-test and F-ratio at 95% confidence limit (Table 7). There is no Table 6 Results for several experiments of validation tests for analysis of PA, MP, PP, CH and PS by ILS method
Taken (μg mL-1) Found (μg mL-1) Recovery, %
PA MP PP CH PS PA MP PP CH PS PA MP PP CH PS
20.0 0.80 0.16 5.00 2.40 20.11 0.79 0.165 4.93 2.36 100.55 98.75 103.03 98.6 98.33
15.0 2.00 4.00 2.00 5.00 15.22 2.04 4.08 1.98 5.02 101.74 102.0 102.0 99.0 100.4
20.0 1.00 2.00 0.16 5.00 19.96 0.99 2.03 0.156 5.07 99.80 99.0 101.5 97.5 101.4
25.6 1.00 2.00 5.00 0.00 25.09 1.00 2.00 5.05 0.00 97.73 100.0 100.0 101.0
-15.0 1.00 2.00 4.00 7.00 14.98 0.98 2.06 4.08 7.08 99.97 98.0 103.0 102.0 101.14
15.0 0.80 0.16 0.16 5.00 15.13 0.81 0.157 0.160 5.00 100.87 101.25 98.13 100.0 100.0
5.00 1.50 3.00 5.00 10.0 4.930 1.56 3.02 5.04 9.81 98.60 104.0 97.33 100.8 98.10
20.0 0.80 0.16 0.16 10.0 20.12 0.80 0.160 0.163 10.0 100.6 100.0 100.0 101.88 100.0
Mean recovery 99.95 100.38 100.64 100.1 99.91
S.E.P 0.233 0.127 0.1465 0.144 0.178
S.E.C 0.466 0.154 0.193 0.189 0.257
Table 7 Determination of PA, MP, PP, CH and PS in commercial syrup using the proposed methods
Sample No. Concentration (μg mL-1) Recovery, %
MCR ILS
PA MP PP CH PS PA MP PP CH PS PA MP PP CH PS
1 15.36 0.48 0.180 0.100 1.44 98.96 98.00 103.0 98.20 102.0 100.2 97.80 102.1 101.2 99.80
2 17.92 0.56 0.112 0.112 1.68 99.00 99.00 99.30 99.80 101.4 100.6 99.60 103.1 100.5 99.60
3 20.43 0.64 0.960 0.960 1.92 101.10 99.60 98.80 100.8 100.1 101.6 101.2 101.4 101.9 99.90
4 23.04 0.72 0.144 0.144 2.16 100.51 100.3 100.2 99.40 99.40 99.30 101.4 101.3 101.3 98.60
5 25.60 0.80 0.160 0.160 2.40 100.31 98.20 100.6 98.30 98.30 99.60 98.60 102.1 100.6 100.2
Mean recovery 100.0 99.00 100.4 99.30 100.6 100.3 99.70 102.0 101.1 99.60
S.D.a 0.970 0.960 1.620 1.090 0.990 0.900 1.580 0.720 0.570 0.610
tb 1.280 0.860 0.980 1.610 1.110
Fb 1.160 0.370 5.060 3.660 2.630
a
Standard deviation.
b
significant difference between the results of MCR and ILS methods.
Conclusion
MCR and ILS developed methods were applied for the determination of five-component mixture of PA, MP, PP, CH and PA, where no knowledge for the sample com-position is required beyond the concentrations of the constituents of interest. A comparative study of the use of MCR and ILS methods for the resolution of five-component mixture of PA, MP , PP, CH and PS has been accomplished showing that the two multivariate calibra-tion methods provide, with adequate software support, a clear example of the high resolving power of these tech-niques. These methods have the advantage of high sen-sitivity, extremely low detection limit, good selectivity, rapid analysis and inexpensive instruments. Further-more, while working with these methods, one does not need to use toxic organic solvents. In other words, they belong to green chemistry. The developed MCR and ILS methods were found to be suitable for the routine sim-ultaneous determination of PA, MP, PP, CH and PS in pharmaceutical syrup.
Competing interests
The authors declare that they have no competing interests.
Authors’contributions
MI designed the proposed method. RN planned and supervised the work. AS coordinated the study and drafting the manuscript. MI and RN analyzed the data statistically and revised manuscript critically. RN, MI and NS carried out the experimental work. All authors read and approved the final manuscript.
Acknowledgement
The authors would like to express their appreciation and thanks to the Middle East pharmaceuticals and cosmetics laboratories, Palestine, for the provision of the necessary pharmaceuticals to carry out this work. The authors would also express their sincere appreciations to Chemistry department, Al-aqsa university, Palestine, for providing necessary facilities for the work. Also, we thank Mr. Mohd M. Issa for his assist.
Author details
1
Pharmaceutical Analytical Chemistry, Department of Chemistry, Alaqsa University, P.O.Box 4051, Gaza, Palestine.2Analytical Chemistry, Department of Chemistry, Alaqsa University, P.O.Box 4051, Gaza, Palestine.3Inorganic Analytical Chemistry, Department of Chemistry, Alaqsa University, P.O.Box 4051, Gaza, Palestine.4R and D Department, Middle East Pharmaceuticals and Cosmetics Laboratories, Gaza, Palestine.
Received: 18 June 2013 Accepted: 9 September 2013 Published: 12 September 2013
References
1. Hinz B, Brune K:Antipyretic analgesics: nonsteroidal anti-inflammatory drugs, selective COX-2 inhibitors, paracetamol and pyrazolinones.
HEP2006,177:56–93.
2. Hoffman BB, Lefkowitz RJ:The Pharmacological Basis of Therapeutics.In
Goodman and Gilmans’s.9th edition. Edited by Hardman JG, Limbird LE, Molinoff PB, Ruddon RW, Gilman AG. McGraw-Hill International Edition; 1996:199–248.
3. Goodwin RD:Panic disorder treated with the antihistamine chlorpheniramine.Ann Allergy Asthma Immunol2003,90:361–362. 4. British Pharmacopoeia Commission:The British Pharmacopoeia 2009.
London: Her Majesty’s Stationary Office; 2009. Electronic Version.
5. Biemer TA:Simultaneous analysis of acetaminophen, pseudoephedrine hydrochloride and chlorpheniramine maleate in a cold tablet using an isocratic, mixed micellar high-performance liquid chromatographic mobile phase.J Chromatogr1987,410:206–210.
6. Gasco-Lopez AI, Izquierdo-Hornillos R, Jiminez A:Development and validation of a high-performance liquid chromatography method for the determination of cold relief ingredients in chewing gum.J Chromatogr, A
1997,775(1–2):179–185.
7. Jensen LS, Valentine J, Milne RW, Evans AM:The quantification of paracetamol, paracetamol glucuronide and paracetamol sulphate in plasma and urine using a single high-performance liquid chromatography assay.J Pharm Biomed Anal2004,34(3):585–593. 8. Aşçıa B, Dönmeza ÖA, Bozdoğana A, Sungura S:Simultaneous
determination of paracetamol, pseudoephedrine hydrochloride and Dextromethorphan hydribromide in tablets using multivariate calibration methods coupled with HPLC-DAD.J Liq Chromatogr Related Technol2011,34(16):1686–1698.
9. Heidemann DR:High-pressure liquid chromatographic determination of methscopolamine nitrate, phenylpropanolamine hydrochloride, pyrilamine maleate, and pheniramine maleate in tablets.J Pharm Sci
1981,70(7):820–822.
10. Cieri UR:Determination of phenylephrine hydrochloride,
chlorpheniramine maleate, and methscopolamine nitrate in tablets or capsules by liquid chromatography with two UV absorbance detectors in series.J AOAC Int2006,89(1):53–57.
11. Lou H, Yuan H, Ruan Z, Jiang B:Simultaneous determination of paracetamol, pseudoephedrine, dextrophan and chlorpheniramine in human plasma by liquid chromatography–tandem mass spectrometry.
J Chromatogr B2010,878(7–8):682–688.
12. United States Pharmacopoeial Convention:The United States Pharmacopoeia 30th and The National formulary 25th.Rockville, MD, USA: United States Pharmacopeial; 2009. Electronic Version.
13. Kaur A, Gupta U:Simultaneous spectrophotometric determiantion of eosin and erythrosine with Cr(VI) reagent in micellar media using mean centering of ratio spectra.Chem Sci Trans2012,1(2):424–430.
14. Gao HW:Use ofβ-correction spectrophotometry to improve the determination of copper solution with eriochrome black T.
Spectrochim Acta, Part A1995,51(8):1379–1384.
15. Afkhami A, Madrakian T, Bozorgzadeh E, Bahram M:Spectrophotometric determination of beryllium in water samples after micelle-mediated extraction preconcentration.Talanta2007,71(3):1103–1109. 16. Afkhami A, Bahram M:Mean centering of ratio spectra as a new
spectrophotometric method for the analysis of binary and ternary mixtures.Talanta2005,66(3):712–720.
17. Afkhami A, Bahram M:Mean centering of ratio kinetic profiles as a novel spectrophotometric method for the simultaneous kinetic analysis of binary mixtures.Anal Chim Acta2004,526(2):211–218.
18. Afkhami A, Bahram M:A novel spectrophotometric method for the simultaneous kinetic analysis of ternary mixtures by mean centering of ratio kinetic profiles.Talanta2006,68(4):1148–1155.
19. Afkhami A, Madrakian T, Bahram M:Simultaneous spectrophotometric determination of iodate and bromate in water samples by the method of mean centering of ratio kinetic profiles.J Hazard Mater2005,
123(1–3):250–255.
20. Bahram M:Mean centering of ratio spectra as a new method for determination of rate constants of consecutive reactions.Anal Chim Acta
2007,603(1):13–19.
21. Bahram M, Mabhooti M:Rank annihilation factor analysis using mean centering of ratio spectra for kinetic–spectrophotometric analysis of unknown samples.Anal Chim Acta2009,639(1–2):19–28.
22. Ali NW, Hegazy MA, Abdelkawy M, Abdelaleem EA:Simultaneous determination of methocarbamol and ibuprofen or diclofenac potassium using mean centering of the ratio spectra method.Acta Pharm2012,
62(2):123–261.
23. De Luca M, Oliverio F, Ioele G, Ragno G:Multivariate calibration techniques applied to derivative spectroscopy data for the analysis of pharmaceutical mixtures.Chemom Intell Labor Syst2009,96:14–21. 24. Dinç E, Baleanu D, Ioele G, Luca MD, Ragno G:Multivariate analysis of
25. Collado MS, Mantovani VE, Goicoechea HC, Olivieri AC:Simultaneous spectrophotometric-multivariate calibration determination of several components of ophthalmic solutions: phenylephrine, chloramphenicol, antipyrine, methylparaben and thimerosal.Talanta2000,52(5):909–920. 26. Blanco M, Coello J, Lturriaga H, Maspoch S, Alaoui-Ismaili S:Use of inverse
multiple linear regression (ILS) for the analytical controlof
pharmaceutical preparations: UV-visible spectrophotometric quantitation of an active principal in the presence of absorbing excipients.Anal Lett
1999,32(6):1169–1181.
27. El-Gindy A, Emara S, Mostafa A:Application and validation of
chemometrics-assisted spectrophotometry and liquid chromatography for the simultaneous determination of six-component pharmaceuticals.
J Pharm Biomed Anal2006,41(2):421–430.
28. Dinc E, Baydan E, Kanbur M, Onur F:Spectrophotometric multicomponent determination of sunset yellow, tartrazine and allura red in soft drink powder by double divisor-ratio spectra derivative, inverse least-squares and principal component regression methods.Talanta2002,58(3):579–594. 29. Arama C, Georgita C:Simultaneous determination of paracetamol,
chlorpheniramine and pseudoephedrine by partial least squares method.Farmacia2002,50(6):0–36.
30. Ribeiro JS, Augusto F, Salva TJG, Ferreira MMC:Prediction models for Arabica coffee beverage quality based on aroma analyses and chemometrics.Talanta2012,101:253–260.
31. Maggio RM, Rivero MA, Kaufman TS:Simultaneous acquisition of the dissolution curves of two active ingredients in a binary pharmaceutical association, employing an on-line circulation system and chemometrics-assistance.J Pharm Biomed Anal2013,72:51–58.
32. Abdollahi H:Simultaneous spectrophotometric determination of chromium(VI) and iron(III) with chromogenic mixed reagents by H-point standard addition method and partial least squares regression.
Anal Chim Acta2001,422(2):327–336.
doi:10.1186/1752-153X-7-152
Cite this article as:Issaet al.:Resolution of five-component mixture using mean centering ratio and inverse least squares chemometrics.
Chemistry Central Journal20137:152.
Open access provides opportunities to our colleagues in other parts of the globe, by allowing
anyone to view the content free of charge.
Publish with
Chemistry
Central and every
scientist can read your work free of charge
W. Jeffery Hurst, The Hershey Company.
available free of charge to the entire scientific community peer reviewed and published immediately upon acceptance cited in PubMed and archived on PubMed Central yours you keep the copyright
Submit your manuscript here: