Context-Dependent Data Envelopment Analysis and an
Application
Mervenur Pala
1, Talat
Ş
enel
2Ondokuz Mayıs University, Department of Statistics, Samsun Turkey
1.
Introduction
In the world where globalization takes place further and further, conditions of competition among organizations has been increased. In this process, units serving in the product and service sector need to improve their performances in order to survive.
Managers who take this phenomenon into account can plan their forward looking activities in a more efficient way by analyzing the process which they are in. In order to adapt the increasing conditions of competition in recent years and catch up with current situation, both private and public institutions perform efficiency and productiveness analyses and form strategy development units.
There are two, parametric and non-parametric, main approaches to estimate efficiency limit in economy.
Parametric approach requires a functional form of dependent variable related to independent variable to be applied (like regression model or production function) and this functional form needs some assumptions about error term to be met (Luptacik, 2010).
Non-parametric approach does not use an analytic function. Non-parametric methods measure the distance to efficiency limit using mathematical programming techniques (constrained optimization).
Data envelopment analysis is a nonparametric method which does not require an assumption about the functional form. Therefore, it is more flexible compared to other methods. Also, DEA produces only one efficiency score even when multiple inputs and multiple outputs are present (Cook et al., 2014). Charnes, Cooper and Rhodes (CCR) (1978) developed the data envelopment analysis which is a mathematical programming method.
While DEA is measuring DMU relative efficiencies, it divides them into two groups as efficient and inefficient. It forms a reference set of efficient DMU’s that guides inefficient DMU’s to be efficient. However it is hard for inefficient DMU’s to select the suitable DMU for themselves.
In this situation, context-dependent DEA, which allows inefficient DMU’s to improve their performances step by step, is used.
Abstract
:
Data envelopment analysis (DEA) is a method for identifying the efficient frontier of decision making units (DMUs) which has multiple outputs and multiple inputs. DEA forms a unique efficient frontier by DMUs and it measures the DMUs’ relative efficiency respect to the this frontier. Context-dependent DEA is an approach which a set of DMUs are evaluated against a particular evaluation context. In context-dependent DEA, different efficient frontiers are formed by DMUs, each of efficient frontiers are used for relative attractiveness and progress measurements as evaluation context. In this study, we used the Social Insurance Institution’s Provincial Directorates database for the year 2012. We explained that a context-dependent DEA which measures relative attractiveness and progress of provincial directorates on a specific performance level against exhibiting poorer and better performance are chosen as the evaluation context, respectively. In this study number of employees, number of establishments, province population as input variables; number of insured and retired are taken as output variables. Input oriented context-dependent DEA model is used for relative attractiveness and progress measurements. Additionally, the reference sets are formed to the provincial directorates located in a specific efficiency level. Thus, regarding of the closest benchmark targets respect to their performance provincial directorates take an opportunity to the improve their performance step by step.Context-dependent DEA is an extension of DEA developed by Zhu (2003) and gives relative attractiveness and progress measures of a specific DMU.
In order to obtain relative attractiveness and progress measure in context-dependent DEA, original DEA methodology is modified where context performance is determined with regard to a special evaluation context (Lu and Hung, 2008). Evaluation contexts in context-dependent DEA represent the efficiency limit in different levels. Each efficiency limit of DMU’s enables to determine the context performance of a specific DMU.
Thus context-dependent DEA allows to characterize future performances of DMU’s using a combination of attractiveness and progress results (Lu and Hung, 2008).
The aim of this article is to explain the DEA and a new approach of traditional DEA, context based DEA, which are used in efficiency measurement, in detail and to examine using an application data. In this regard, efficiencies are measured using context-dependent DEA method on the input and output data belonging to 81 cities taken from one of the important institutions of Turkey, Social Insurance Institution (SII), and relative attractiveness and progress measures are obtained.
2.
Material and Method
Data envelopment analysis is a method used to identify the efficiency limits of decision making units. Efficiency limit is characterized by DMU’s using only one efficiency score. DEA measures relative efficiencies of DMU’s with multiple inputs and outputs. Performance of DMU’s depends on described the efficiency limit (Chen et al., 2005). Adding or removing an inefficient DMU does not change the efficiency limit or efficiencies of current DMU’s. Inefficiency scores changes only when efficiency limit changes (Morita and Zhu, 2007). In case of performances of inefficient DMU’s get worse or better, efficiency scores of efficient DMU’s continue to exist. In other words, even if performances of inefficient DMU’s depend on efficient DMU’s, after DEA is defined, performances of efficient DMU’s do not depend on inefficient DMU’s (Chen et al., 2005).
However, evaluations usually affected by context. Performance of a DMU looks more attractive compared to less attractive alternatives and less attractive compared to more attractive alternatives. According to theory of consumer choice, consumer choice is affected by context as a circle looks bigger when surrounded by smaller circles and looks smaller when surrounded by bigger circles (Tversky and Simonson, 1993).
If we think about this effect in DEA’s structure, context based DEA, which measures relative attractiveness of a specific DMU compared to other methods, appear. Relative attractiveness of 𝐷𝑀𝑈𝑥 compared to 𝐷𝑀𝑈𝑦 depends on the presence or absence of a third choice, 𝐷𝑀𝑈𝑧 (or a group of 𝐷𝑀𝑈s) (Chen et al., 2005). Relative attractiveness depends on an evaluation context formed from alternative choices (DMU’s) (Morita and Zhu, 2007).
When context performance is determined according to a specific efficient context (evaluation context), the original DEA method is changed in order to obtain attractiveness in context-dependent DEA (Chen et al., 2005). Evaluation contexts in context-dependent DEA are obtained by dividing DMU’s by efficiency limits in different levels. Each efficiency limit presents an evaluation context in order to measure relative attractiveness. If the first level (actual) efficiency limit is removed, the remaining (inefficient) DMU’s form a new efficiency limit in the second level. If this new second level efficiency limit is removed, a new efficiency limit will be formed in the third level and this situation will repeat until no remaining DMU’s exist. Thus each efficiency limit provides an evaluation context of relative attractiveness just like the second level efficiency limit which functions as an evaluation context to measure relative attractiveness of DMU’s in the first level efficiency limit. On the other hand, it is possible to measure performance of DMU’s according to the first and the second level efficiency limit (Morita and Zhu, 2007). The presence or absence of the second level efficiency limit is seem to affect DMU’s in the first level efficiency limit (Chen et al., 2005).
Each efficiency limit obtained from context-dependent DEA provides an evaluation context also to measure the progress besides relative attractiveness. If it is seen that DMU’s in a specific level performs equally, attractiveness measurement allows to differentiate the same performance with regard to the same evaluation context. It is possible to characterize the performance of DMU’s even more by using attractiveness and progress measurements together (Khezrimotlagh and Chen, 2018).
2.1 Stratification of DEA Model
Let us assume that 𝑛 DMU’s produce s outputs using 𝑚 inputs. Let 𝐽1 be the series of all DMU’s and
𝐸1 be the series of DMU’s efficient in 𝐽1. In that case, 𝐽𝑙 and 𝐸𝑙 is defined mutually as 𝐽𝑙+1 = 𝐽𝑙− 𝐸𝑙.𝐸𝑙 can be found through below linear programming problem using DMU’s with 𝜃𝑘𝑙 = 1 optimal value.
min 𝜃𝑘𝑙 = 𝜃
constraints 𝑗 ∈𝐽𝑙𝜆𝑗𝑥𝑖𝑗 ≤ 𝜃𝑥𝑖𝑘, 𝑖 = (1, … , 𝑚)
𝜆𝑗
𝑗 ∈𝐽𝑙 𝑦𝑟𝑗 ≥ 𝑦𝑟𝑘, 𝑟 = (1, … , 𝑠)
𝜆𝑗 ≥ 0, 𝑗 ∈ 𝐽𝑙(1)
In this model, 𝑥𝑖𝑗 is the i-th input of 𝐷𝑀𝑈𝑗 and 𝑦𝑟𝑗 is the r-th output of 𝐷𝑀𝑈𝑗. When 𝑙 = 1, model (1) becomes input oriented CCR model.
𝐸𝑙 includes all radial efficient DMU’s. DMU’s in 𝐸1 defines the first level efficiency limit. When 𝑙 =
2, model (1) gives the second level efficiency limit after the first level efficient DMU’s are removed. This way, we define a couple of levels of efficiency limits. We define 𝐸𝑙 as efficiency limit of 𝑙-th level. The below algorithm show how to find these efficiency limits using model (1) (Morita and Zhu, 2007).
Step 1: Evaluate all DMU series (𝐽1) using model (1) to obtain 𝐸1, the first level efficient DMU series, by taking 𝑙 = 1.
Step 2: Remove efficient DMU’s for future DEA applications using 𝐽𝑙+1= 𝐽𝑙− 𝐸𝑙. Stop if 𝐽𝑙+1 = ∅. Step 3: Evaluate 𝐽𝑙+1, a sub series of the new inefficient DMU’s, to obtain the new efficient DMU series, 𝐸𝑙+1 (new efficiency limit).
Step 4:𝑙 = 𝑙 + 1. Go back to Step 2. Stopping rule: Stop if 𝐽𝑙+1 = ∅.
Model (1) stratifies all DMU series divided into different sub groups of efficiency levels. This DMU series have the following features.
𝐸𝑙∩ 𝐸𝑙′ = ∅ for 𝐽1=∪ 𝐸𝑙and 𝑙 ≠ 𝑙′
if 𝑙′ > 𝑙, then DMU’s in 𝐸𝑙′are suppressed by DMU’s in 𝐸𝑙.
Each DMU in 𝐸𝑙 series is efficient with respect to DMU’s in 𝐽𝑙′ series for all 𝑙′> 𝑙.
2.2 Input Oriented Context-Dependent DEA Model
Let us consider a specific 𝐷𝑀𝑈𝑞 in the level of 𝐸𝑙0 where 𝑙0 ∈ 1, … , 𝐿 − 1 . The model below is used to characterize the attractiveness measure of DMU’s in 𝐸𝑙0 with regard to 𝐸𝑙0 +𝑑, 𝑑 = 1, … , 𝐿 − 𝑙
0 levels which performs worse (Chen et al., 2005).
min 𝜃𝑞𝑑= 𝜃 𝑑 = (1, … , 𝐿 − 𝑙0) constraints 𝑗 ∈𝐸𝑙0 +𝑑𝜆𝑗𝑥𝑖𝑗 ≤ 𝜃𝑥𝑖𝑞 𝑖 = (1, … , 𝑚)
𝑗 ∈𝐸𝑙0 +𝑑𝜆𝑗𝑦𝑟𝑗 ≥ 𝑦𝑟𝑞 𝑟 = (1, … , 𝑠)
𝜆𝑗 ≥ 0, 𝑗 ∈ 𝐸𝑙0 +𝑑(2) For each 𝑑 = 1, … , 𝐿 − 𝑙0, we can say 𝜃𝑞
𝑑1> 𝜃 𝑞
𝑑2 where 𝜃
𝑞𝑑 > 1 and𝑑1> 𝑑2. In that case, 𝜃𝑞𝑑 is called input oriented d-degree attractiveness of 𝐷𝑀𝑈𝑞 of a specific 𝐸𝑙0 level. Each efficiency level in the model (2) represents an evaluation context for relative attractiveness of DMU’s in 𝐸𝑙0. The larger the 𝜃
𝑞𝑑 > 1 value, more attractive the 𝐷𝑀𝑈𝑞 will be. Because 𝐷𝑀𝑈𝑞 makes itself more unique (distinctive) than evaluation context
𝐸𝑙0 +𝑑. We can sort DMU’s in 𝐸𝑙0 series based on their attractiveness scores and determine the best one. We use the following model in order to obtain the progress measure related to 𝐸𝑙0 −𝑔, 𝑔 = 1, … , 𝑙
0− 1 levels, which performs better, of a specific 𝐷𝑀𝑈𝑞 in the 𝐸𝑙0 series where 𝑙0 ∈ 2, … , 𝐿 (Lu and Hung, 2008).
min 𝜑𝑞
𝑔
= 𝜑 𝑔 = (1, … , 𝑙0− 1) constraints 𝑗 ∈𝐸𝑙0 −𝑔𝜆𝑗𝑥𝑖𝑗 ≤ 𝜑𝑥𝑖𝑞 𝑖 = (1, … , 𝑚)
𝑗 ∈𝐸𝑙0 −𝑔𝜆𝑗𝑦𝑟𝑗 ≥ 𝑦𝑟𝑞 𝑟 = (1, … , 𝑠)
𝜆𝑗 ≥ 0, 𝑗 ∈ 𝐸𝑙0 −𝑔(3) We can say 𝜑𝑞
𝑔1 < 𝜑 𝑞 𝑔2 for 𝜑
𝑞 𝑔
< 1 and 𝑔1> 𝑔2 where 𝑔 = 1, … , 𝑙0− 1. In that case, 𝜑𝑞 𝑔
is called as input oriented g-degree progress of 𝐷𝑀𝑈𝑞 in the level of a specific 𝐸𝑙0. The smaller the 𝜑𝑞
𝑔
2.3 Reference Sets
In order to improve the performances of inefficient DMU’s, the improvement target need to be given among efficient DMU’s. Reference set suggests an improvement target for inefficient DMU’s. Actually, when
𝑙 = 1, model (1) gives reference set among efficient DMU’s for inefficient DMU’s. This may be the final improvement target. However this aim for some of the inefficient DMU’s can be completely different from the current performance and improvement can be difficult to provide (Morita and Zhu, 2007).
𝜆 density vector in Model (2) represents the 𝑅𝑘𝐶𝐶𝑅 𝑙 reference set of 𝐾𝑉𝐵𝑘 in the 𝑙𝑘efficiency level based on evaluation context, 𝐸𝑙, where 𝑙 < 𝑙
𝑘.
𝑅𝑘𝐶𝐶𝑅 𝑙 = 𝑗 ∈ 𝐽𝑙|𝜆𝑗 > 0 (4)
3.
Application
Together with globalization and technological advances, there is a rapid change and transformation in many areas. Private and public institutions carry out their activities within this scope in order to adapt these advancements and response to expectations in a better way.
SII; provides social security services by securing people in terms of social insurance and general health insurance.
In this article, context-dependent DEA method is applied on SII provincial directorates based on this course of action and progress measures are obtained.
Firstly, provincial directorates are divided by their efficiency limits in different levels. Each obtained efficiency limit is used as an evaluation context in a specific performance level.
Then, provincial directorates, which performed worse or better, are selected as evaluation context respectively using context-dependent DEA and attractiveness and progress measures are obtained.
Also, a reference set is formed for provincial directorates with low performances from provincial directorates with different efficiency level and better performances. This way, possibility to performances of provincial directorates with low performances step by step is enabled and accessible comparison targets are provided. In the application, WINQSB packet program is used and results are obtained. Province population, number of employees and number of establishments are taken as inputs and number of insured and retired are taken as outputs. The data belong to 2012 and is taken from the website of SII.
The first level efficient DMU’s (the ones that met 𝜃𝑘1= 1) are obtained by solving model (1) for 𝑙 = 1 firstly since model (1) provides stratification of DEA. If looked more carefully, model (1) becomes input
oriented CCR model when 𝑙 = 1. Since we used input oriented model, DMU’s with the objective function value
of 1 are efficient. The first level efficiency limit 𝐸1 is also the original DEA limit and includes radial efficient DMU’s.
𝐸1= 34,41,59,67,72,73,74
Then the DMU’s in 𝐸1 are removed from 𝐽1 and
𝐽2=
01, 02, 03, 04, 05, 06, 07, 08, 09, 10, 11, 12, 13, 14, 15, 16, 17, 18, 19, 20, 21, 22, 23, 24, 25 26, 27, 28, 29, 30, 31, 32, 33,35, 36, 37, 38, 39, 40,42, 43, 44, 45, 46, 47, 48, 49, 50
51, 52, 53, 54, 55, 56, 57, 58,60, 61, 62, 63, 64, 65, 66,68, 69, 70, 71,75 76, 77, 78, 79, 80, 81
series is obtained. If model (1) is solved for 𝑙 = 2for DMU’s in𝐽2, the second level efficient DMU’s (the ones that met 𝜃𝑘2= 1) are obtained.
𝐸2= 06, 11, 16, 23, 43, 47, 63, 78, 81
Therefore we find the efficiency limit of 𝐽1 as 𝐸1and the efficiency of 𝐽2 as 𝐸2.
By repeating this process, we obtain the DMU subseries and their efficiency limits. This algorithm is continued until there are no more inefficient DMU’s in the obtained sub series.
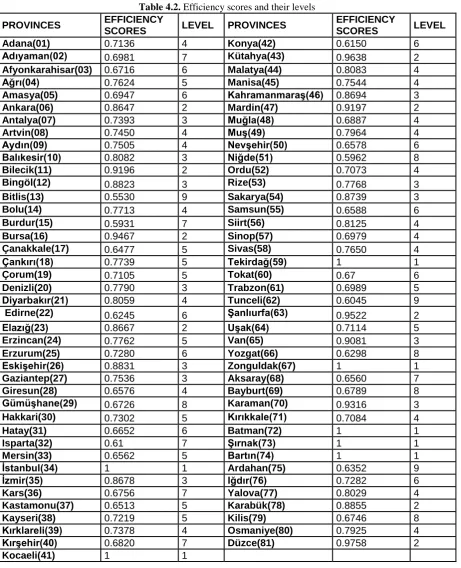
Table 4.2. Efficiency scores and their levels
PROVINCES EFFICIENCY
SCORES LEVEL PROVINCES
EFFICIENCY
SCORES LEVEL
Adana(01) 0.7136 4 Konya(42) 0.6150 6
Adıyaman(02) 0.6981 7 Kütahya(43) 0.9638 2
Afyonkarahisar(03) 0.6716 6 Malatya(44) 0.8083 4
Ağrı(04) 0.7624 5 Manisa(45) 0.7544 4
Amasya(05) 0.6947 6 Kahramanmaraş(46) 0.8694 3
Ankara(06) 0.8647 2 Mardin(47) 0.9197 2
Antalya(07) 0.7393 3 Muğla(48) 0.6887 4
Artvin(08) 0.7450 4 Muş(49) 0.7964 4
Aydın(09) 0.7505 4 Nevşehir(50) 0.6578 6
Balıkesir(10) 0.8082 3 Niğde(51) 0.5962 8
Bilecik(11) 0.9196 2 Ordu(52) 0.7073 4
Bingöl(12) 0.8823 3 Rize(53) 0.7768 3
Bitlis(13) 0.5530 9 Sakarya(54) 0.8739 3
Bolu(14) 0.7713 4 Samsun(55) 0.6588 6
Burdur(15) 0.5931 7 Siirt(56) 0.8125 4
Bursa(16) 0.9467 2 Sinop(57) 0.6979 4
Çanakkale(17) 0.6477 5 Sivas(58) 0.7650 4
Çankırı(18) 0.7739 5 Tekirdağ(59) 1 1
Çorum(19) 0.7105 5 Tokat(60) 0.67 6
Denizli(20) 0.7790 3 Trabzon(61) 0.6989 5
Diyarbakır(21) 0.8059 4 Tunceli(62) 0.6045 9
Edirne(22) 0.6245 6 Şanlıurfa(63) 0.9522 2
Elazığ(23) 0.8667 2 Uşak(64) 0.7114 5
Erzincan(24) 0.7762 5 Van(65) 0.9081 3
Erzurum(25) 0.7280 6 Yozgat(66) 0.6298 8
Eskişehir(26) 0.8831 3 Zonguldak(67) 1 1
Gaziantep(27) 0.7536 3 Aksaray(68) 0.6560 7
Giresun(28) 0.6576 4 Bayburt(69) 0.6789 8
Gümüşhane(29) 0.6726 8 Karaman(70) 0.9316 3
Hakkari(30) 0.7302 5 Kırıkkale(71) 0.7084 4
Hatay(31) 0.6652 6 Batman(72) 1 1
Isparta(32) 0.61 7 Şırnak(73) 1 1
Mersin(33) 0.6562 5 Bartın(74) 1 1
İstanbul(34) 1 1 Ardahan(75) 0.6352 9
İzmir(35) 0.8678 3 Iğdır(76) 0.7282 6
Kars(36) 0.6756 7 Yalova(77) 0.8029 4
Kastamonu(37) 0.6513 5 Karabük(78) 0.8855 2
Kayseri(38) 0.7219 5 Kilis(79) 0.6746 8
Kırklareli(39) 0.7378 4 Osmaniye(80) 0.7925 4
Kırşehir(40) 0.6820 7 Düzce(81) 0.9758 2
Kocaeli(41) 1 1
The provincial directorates with the lowest efficiency, Bitlis (13), Tunceli (62), Ardahan (75), are placed in the last level of efficiency limit (9th level). If looked carefully, efficiency level do not follow the ranks of the efficiency scores. For example, Yozgat (66) provincial directorate in the level 8 has more efficiency score than Konya (42) provincial directorate in the level 6.
Table 4.3. Radyal ölçüme göre seviyeler
Levels Provincial Directorate Efficiency Interval
Level 1 34, 41, 59, 67, 72, 73, 74 1
Level 2 6, 11, 16, 23, 43, 47, 63, 78, 81 0,864 - 0,975 Level 3 7, 10, 12, 20, 26, 27, 35, 46, 53, 54, 65, 70 0,739 - 0,931 Level 4 1, 8, 9, 14, 21, 28, 39, 44, 45, 48, 49, 52, 56, 57, 58,
71, 77, 80 0,657 - 0,812
Level 5 4, 17, 18, 19, 24, 30, 33, 37, 38, 61, 64 0,647 - 0,776 Level 6 3, 5, 22, 25, 31, 42, 50, 55, 60, 76 0,615 - 0,7282
Level 7 2, 15, 32, 36, 40, 68 0,593 - 0,698
Level 8 29, 51, 66, 69, 79 0,596 - 0,678
Level 9 13, 62, 75 0,553 - 0,635
Let us examine the attractiveness scores of DMU’s in the first two levels (𝐸1and𝐸2). In order to do this, we need to take DMU’s, which perform worse than the level of DMU’s in interest, as evaluation context. After taking these DMU’s, the results obtained from the solution of model (2) is as following:
Table 4.4. Attractiveness scores for the province directorates in the first and second level
Level
Province
Directorate Evaluation Context
L E V 1 E L
𝑬𝟐 𝑬𝟑 𝑬𝟒 𝑬𝟓 𝑬𝟔 𝑬𝟕 𝑬𝟖 𝑬𝟗
34 1,2219 1,4014 1,6016 1,7441 2,0157 1,2975 3,0529 3,7393
41 1,1661 1,3822 1,5413 1,6703 1,8913 2,1907 2,9144 3,7339
59 1,3726 1,5261 1,7208 2,0978 2,2379 2,696 3,6421 4,3896
67 1,4781 1,5283 1,7045 2,1205 2,1506 2,6118 3,8956 6,5353
72 1,1385 1,2038 1,2712 1,3669 1,5223 1,5675 1,746 1,8713
73 1,2495 1,3335 1,3688 1,4284 1,678 1,818 1,955 2,054
74 1,2965 1,5081 1,6907 1,9216 1,9894 2,3714 3,734 6,2774
L E V 2 E L
6 1 1,1227 1,2181 1,4136 1,6734 1,7091 2,1879 2,8388
11 1 1,1028 1,2289 1,3036 1,5304 1,5921 2,0891 3,4848
16 1 1,2142 1,3801 1,5377 1,6757 2,0247 2,6596 4,2833
23 1 1,0817 1,1537 1,2388 1,288 1,4482 1,8009 2,7079
43 1 1,3104 1,4745 1,6357 1,7731 2,062 3,1839 5,302
47 1 1,0697 1,2094 1,3135 1,4488 1,4984 1,7065 1,8647
63 1 1,117 1,2855 1,4524 1,5755 1,6075 2,1326 2,4971
78 1 1,2156 1,3525 1,5973 1,7675 2,0458 3,0968 5,1857
81 1 1,2612 1,3152 1,5254 1,6225 1,9533 2,6357 3,3997
When evaluation contexts are selected as 𝐸2and𝐸3, Zonguldak (67) provincial directorate in the 𝐸1 level has the highest attractiveness scores. Greater the attractiveness score (𝜃𝑞𝑑 > 1), the more attractive the DMU in interest is.
If looked carefully, the attractiveness scores, therefore performances, are changes when evaluation contexts are changed. For example, the most attractive provincial directorate is Tekirdağ (59) with the evaluation context, 𝐸4, and Zonguldak (67) with 𝐸8 for DMU’s in the first level.
(43). This means that Kütahya (43) provincial directorate proves itself to be more unique in the evaluation contexts.
When 𝐸7 is considered as the evaluation context, if we sort the attractiveness scores of DMU’s in the 𝐸2 we obtain the following:
𝐾ü𝑡𝑎𝑦𝑎 > 𝐾𝑎𝑟𝑎𝑏ü𝑘 > 𝐵𝑢𝑟𝑠𝑎 > 𝐷ü𝑧𝑐𝑒 > 𝐴𝑛𝑘𝑎𝑟𝑎 > Ş𝑎𝑛𝑙ı𝑢𝑟𝑓𝑎 > 𝐵𝑖𝑙𝑒𝑐𝑖𝑘 > 𝑀𝑎𝑟𝑑𝑖𝑛 > 𝐸𝑙𝑎𝑧ığ
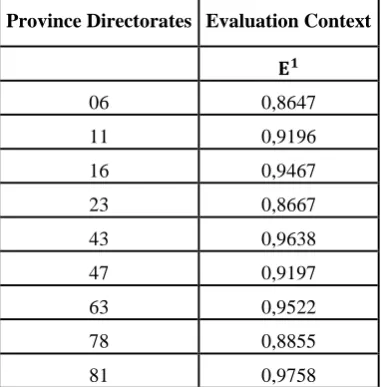
And now, let us look at the progress scores of DMU’s in the second level. In order to do this, DMU’s in the levels, which perform better than DMU’s in 𝐸2, are taken as evaluation context. After doing this, solving model (3) gives the following results:
Table 4.5.Progress scores for province directorates in the second level
Province Directorates Evaluation Context
𝐄𝟏
06 0,8647
11 0,9196
16 0,9467
23 0,8667
43 0,9638
47 0,9197
63 0,9522
78 0,8855
81 0,9758
When the results are examined, the province directorate with the highest progression in 𝐸2 level is Ankara (06). The smaller progression score, the more progression 𝜑𝑞
𝑔
< 1 will have in DMU in interest. When we sort province directorates based on their progressions with regard to 𝐸1 evaluation context, which is the only level with better performance than itself for 𝐸2 level, we obtain the following:
𝐴𝑛𝑘𝑎𝑟𝑎 > 𝐸𝑙𝑎𝑧ığ > 𝐾𝑎𝑟𝑎𝑏ü𝑘 > 𝐵𝑖𝑙𝑒𝑐𝑖𝑘 > 𝑀𝑎𝑟𝑑𝑖𝑛 > 𝐵𝑢𝑟𝑠𝑎 > Ş𝑎𝑛𝑙ı𝑢𝑟𝑓𝑎 > 𝐾ü𝑡𝑎𝑦𝑎 > 𝐷ü𝑧𝑐𝑒. Finally, let us examine the reference set of DMU’s in a specific level.
From the definition of reference set, 𝑅𝑘𝐶𝐶𝑅 𝑙 = 𝑗𝜖𝐽𝑙 𝜆𝑗 > 0 , DMU’s with 𝜆𝑗 > 0 density vector that is calculated from model (2) are in the reference set of DMU in interest. For example, reference sets for DMU’s in the 9th efficiency limit (𝐸9) are as below:
Table 4.6. Reference sets as comparison targets for province directorates in the 9th level Province
Directorates 𝑹
𝑪𝑪𝑹(𝟏) 𝑹𝑪𝑪𝑹(𝟐) 𝑹𝑪𝑪𝑹(𝟑) 𝑹𝑪𝑪𝑹(𝟒) 𝑹𝑪𝑪𝑹(𝟓) 𝑹𝑪𝑪𝑹(𝟔) 𝑹𝑪𝑪𝑹(𝟕) 𝑹𝑪𝑪𝑹(𝟖)
13 59, 72, 73 47, 81 12, 65, 70 21, 56 4, 18, 38 3, 25, 76 2, 68 66, 79
62 59, 67, 72 23, 47, 81 12, 53, 70 44, 56, 58 4, 18, 24 5, 25, 50 2, 40, 68 69, 79
75 59, 67, 72 23, 47, 81 12, 53, 65, 70 21, 44 4, 18 25, 76 2, 40, 68 29, 66, 79
As we can see from Table 4.6, while suitable comparison targets in the 1st level for Bitlis (13) province directorate are Tekirdağ (59), Batman (72) and Şırnak (73), in the 4th level, they are Diyarbakır (21) and Siirt (56), and in the 8th level, Yozgat (66) and Kilis (79).
4.
Results
After the efficiency limit is defined in the original DEA method, addition or elimination of inefficient DMU’s does not change the efficiency limit or efficiencies of the current DMU’s. However, in context-dependent DEA, this process changes the performances of both efficient and inefficient DMU’s (Seiford and Zhu, 2003). This change makes context- dependent DEA versatile and enables to determine better alternatives locally and globally for DMU’s. It can detect the prominent performances using attractiveness and progress measures and it is possible to see the difference between performances of efficient DMU’s more easily compared to the original DEA.
As a result, the context-dependent DEA approach, which is an extension of DEA, can obtain more positive approaches that will guide the researchers about the performances of DMU’s, make comparisons in detail and create forward looking strategic targets in a more efficient way.
References
[1]. Charnes A., Cooper W.W., Rhodes E., 1978. Measuring the efficiency of decision making units,
European Journal of Operational Research, 2, 429-444.
[2]. Chen Y., Morita H., Zhu J., 2005. Context-dependent DEA with an application to Tokyo public libraries, International Journal of Information Technology & Decision Making, 4, 385-394.
[3]. Cook, W. D., Tone, K., & Zhu, J. (2014). Data envelopment analysis: Prior to choosing a model. Omega, 44, 1-4.
[4]. Khezrimotlagh, D., & Chen, Y. (2018). Decision Making and Performance Evaluation Using Data Envelopment Analysis. Springer International Publishing.
[5]. Lu W., Hung S., 2008. Benchmarking the operating efficiency of global telecommunication firms,
International Journal of Information Technology & Decision Making, 7, 737-750.
[6]. Luptacik M., 2010. Mathematical optimization and economic analysis, Springer, New York.
[7]. Morita H., Zhu J., 2007. Context-dependent data envelopment analysis and its use, Editors: Zhu J., Cook W.D., Modeling data irregularities and structural complexities in data envelopment analysis, Springer, Germany, 241-259.
[8]. Seiford, L. M., & Zhu, J. (2003). Context-dependent data envelopment analysis—measuring
attractiveness and progress. Omega, 31(5), 397-408.
[9]. Tversky A., Simonson I., 1993. Context-dependent preferences, Management Sciences, 39, 1179-1189.