Does the ethnic density effect extend to
obesity? A cross-sectional study of
415 166 adults in east London
Shailen Sutaria, Rohini Mathur, Sally A Hull
To cite: Sutaria S, Mathur R, Hull SA. Does the ethnic density effect extend to obesity? A cross-sectional study of 415 166 adults in east London. BMJ Open 2019;9:e024779. doi:10.1136/ bmjopen-2018-024779
►Prepublication history and additional material for this paper are available online. To view these files, please visit the journal online (http:// dx. doi. org/ 10. 1136/ bmjopen- 2018- 024779).
Received 20 June 2018 Revised 13 March 2019 Accepted 4 April 2019
Clinical Effectiveness Group, Queen Mary University of London, London, UK
Correspondence to Dr Sally A Hull; s. a. hull@ qmul. ac. uk © Author(s) (or their employer(s)) 2019. Re-use permitted under CC BY-NC. No commercial re-use. See rights and permissions. Published by BMJ.
AbstrACt
Objectives To examine the prevalence of obesity by ethnic group and to examine the association between ethnic density and obesity prevalence.
Design and setting Cross-sectional study utilising electronic primary care records of 128 practices in a multiethnic population of east London.
Participants Electronic primary care records of 415 166 adults with a body mass index recorded in the previous 3 years.
Outcome measures (1) Odds of obesity for different ethnic groups compared with white British. (2) Prevalence of obesity associated with each 10% increase in own-group ethnic density, by ethnic own-group.
results Using multilevel logistic regression models, we find that compared with white British/Irish males, the odds of obesity were significantly higher among black ethnic groups and significantly lower among Asian and white other groups. Among females, all ethnic groups except Chinese and white other were at increased odds of obesity compared with white British/Irish. There was no association between increasing ethnic density and obesity prevalence, except among black Africans and Indian females. A 10% increase in black ethnic density was associated with a 15% increase in odds of obesity among black African males (95% CI 1.07 to 1.24) and 18% among black African females (95% CI 1.08 to 1.30). Among Indian females, a 10% increase in Indian ethnic density was associated with a 7% decrease in odds of obesity (95% CI 0.88 to 0.99).
Conclusion Wider environmental factors play a greater role in determining obesity than the ethnic composition of the area for most ethnic groups. Further research is needed to understand the mechanism through which increasing ethnic density is associated with increased odds of obesity among black Africans and decreased odds of obesity among Indian females.
IntrODuCtIOn
Tackling obesity is a major public health priority as worldwide prevalence continues to rise.1 In England, 27% of men and women are obese, and this is predicted to rise to >40% by 2035.2 3 Prevalence varies by ethnic group and gender. Variation may be the result of differ-ences in socioeconomic status, lifestyle and cultural factors.4 5 Lifestyle factors, including diet, change over time as minority groups
adopt the dietary norms of the majority popu-lation around them, by a process of accultur-ation, which often results in weight gain.6–10 Ethnic density may modify this process of acculturation. Higher levels of own-group ethnic density may encourage individuals to follow traditional eating habits,11 provide greater social support and protect against stress12; and stress is strongly associated with weight gain.13 14
Most research on ethnic density has been conducted in the area of mental health where increasing own ethnic density has a protective effect on a range of mental health outcomes.9 15–20 Beyond mental health, increasing ethnic density has been found protective against smoking, where increasing own-group ethnic density was associated with reduced odds of smoking.17 The causal path-ways through which the ethnic density effect operates have yet to be fully elucidated; the most researched hypothesis suggests that the buffering effect of increased own-group ethnic density protects individuals against experiences of racism and discrimination
strengths and limitations of this study
► To date, this is the largest study on ethnic density
and obesity in the UK, including primary care data from over 400 000 individuals.
► Ethnicity recording was >90% in the primary care
records from this multiethnic area, allowing us to use a large routine dataset with multiple ethnic groups for the study.
► We were able to measure ethnic density at small,
neighbourhood level, rather than over large geo-graphical areas.
► No data were available to adjust for potential
con-founders of the relationship between ethnic density and obesity such as proximity to fast food outlets and availability of green space.
► We used the index of multiple deprivation, derived
from census data, as a proxy measure of individual deprivation; this may inadequately measure individ-ual deprivation.
on September 22, 2020 by guest. Protected by copyright.
less clear how this pathway affects health behaviour such as smoking and whether it extends to obesity. Current UK research on this topic is limited.21 Studies from the USA, typically measuring ethnic density over large metropol-itan areas, have found mixed effects.22–24
Results in the UK are likely to differ from other coun-tries due to different patterns of migration, duration of acculturation and population densities. We hypothesise that high own-group ethnic density exerts a protective effect against acculturation. This in turn may reduce the risk of obesity for ethnic minority individuals living in areas of high own-group ethnic density. Using primary care data from three ethnically diverse, coterminous boroughs in east London, we report the prevalence of obesity among different ethnic groups and examine the association between own-group ethnic density and obesity prevalence.
MethODs study setting
The National Health Service provides comprehensive healthcare, free at the point of delivery for residents in England, funded through taxation. The vast majority of the population are registered with a General Practice (GP) to access primary care services. We utilised anony-mised, coded primary care data from the electronic health records held by the Clinical Effectiveness Group for this cross-sectional observational study.
The adjoining east London boroughs of Tower Hamlets, Newham and Hackney are ethnically diverse, with a non-white British population of 52%, 61% and 49% respectively, compared with 30% in London and 14% in England.25 The high proportion of minority ethnic groups makes east London an ideal area to study ethnic density effects.
We extracted demographic and clinical data for adults aged ≥18 years currently registered at the 128 practices in these localities.
Obesity
Obesity measures were obtained by extracting data on body mass index (BMI) categorised into obese, over-weight or normal/underover-weight based on a BMI >30 kg/ m2, between 25 to 29.9 kg/m2 or <24.9 kg/m2, respectively. We utilised BMI as it is routinely measured in primary care in contrast to other weight measures (eg, waist circumfer-ence), which are poorly recorded. Uniform thresholds for obesity were used for all ethnic groups. We included a sensitivity analysis applying lower BMI thresholds to define obesity in South Asians, to reflect their increased risk of type 2 diabetes at lower levels of BMI.26 Partici-pants were included if they had at least one BMI measure in the previous 3 years (2014–2017), the most recent BMI
ethnicity and ethnic density
Individual-level ethnicity was extracted from primary care health records. Ethnicity is self-reported by the patient at registration or during consultation, and coded based on the UK Census categorisation hierarchies. Reported ethnicity was collapsed into the 16 groups of the 2011 UK Census,27 these were further collapsed into 9 groups: white British (white British, white Irish), white other, black African, black Caribbean, Indian, Pakistani, Bangla-deshi, Chinese, mixed/other (white and black Caribbean, white and black African, white and Asian, other mixed, other black, other Asian, other ethnic group). Recording of adult ethnicity in primary care health records is >90% across the study area, following previous incentives to improve the quality of practice-based, self-reported ethnicity.28 29
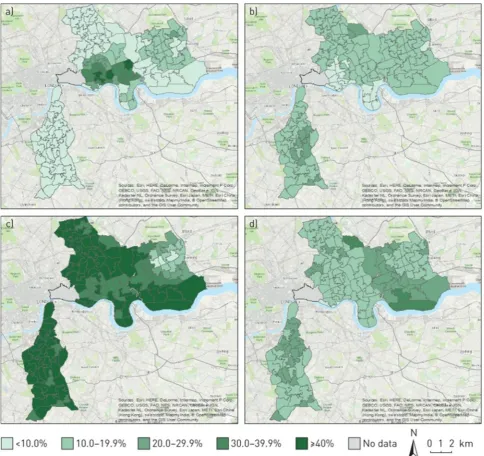
Ethnic density was calculated as the percentage of people from each ethnic group living within each Middle Super Output Area (MSOA), obtained from the 2011 census.30 MSOA has been used previously as the geographical area to calculate ethnic density and consists of an average population size of 7790. In the study area of east London, with a population density of 12 600 individ-uals per square kilometre, we estimate an average MSOA covers 0.6 km2 in this area. We found that ethnic density varied sufficiently across our study area to be used for analysis among white British, black African, Indian, Paki-stani and Bangladeshi groups only; there was insufficient variability in ethnic density among black Caribbean and Chinese populations for further analysis in our study (see
figure 1).
We also undertook a sensitivity analysis using primary care data to calculate ethnic density.
socioeconomic deprivation
A proxy measure of individual socioeconomic depriva-tion (index of multiple deprivadepriva-tion, IMD) was obtained for each patient based on their LSOA (Lower Super Output Area) of residence. IMD is a widely used measure of relative deprivation in England, combining informa-tion on seven domains of deprivainforma-tion (income, employ-ment, education, health and disability, housing and living environment) from census data.31
Demographic and clinical variables
Demographic and clinical data on current age, sex, borough of residence along with diagnostic data on chronic disease comorbidity were extracted from the elec-tronic record. All values were the latest recorded before the study date of March 2017.
Data analysis
All analyses were carried out using Stata V.14 (Statacorp, College Station, Texas, USA). Analyses were stratified by sex to account for established differences in rates of obesity between men and women.
on September 22, 2020 by guest. Protected by copyright.
To examine odds of obesity for different ethnic groups (white Other, black Caribbean, black African, Indian, Bangladeshi, Pakistani, Chinese) compared with the majority British/Irish white ethnic group, we used a two-level logistic regression model, with individ-uals nested in MSOA. Age, borough, deprivation (IMD score) and presence of serious mental illness or diabetes were included in the model as these were independently associated with both obesity and ethnicity. To assess the relationship between ethnic density and obesity, a similar two-level logistic regression model was used. In common with previous studies on ethnic density effects, we choose 10% as the threshold interval above which an association with a change in the odds of being obese was sought.17 19 A priori confounders included age, borough
and deprivation (IMD score). Analysis was conducted separately for each ethnic group.
We hypothesised that younger adults may be more acculturated to the majority ethnic group and thus show a different relationship between obesity and ethnic density, hence we stratified the analysis by those aged 18–35 years and those aged >35 years. To examine the robustness of association, we performed several sensitivity analyses including, broadening ethnic grouping into black, Asian and white; using different thresholds of BMI to include to individuals overweight (BMI >25) or obese (BMI >30) and using different ethnicity-specific cut-offs for obesity status. We also repeated the analysis using ethnic density calculated from primary care records rather than census data.
Figure 1 Ethnic density distributions (%) by Middle Super Output Area mapped across east London: (a) Bangladeshi, (b)
Caribbean, (c) white and (d) African with south London comparator area. Adapted from Mathur R, et al.17 on September 22, 2020 by guest. Protected by copyright.
results
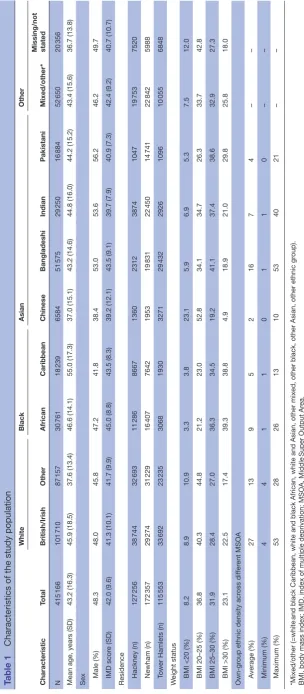
From a total of 792 395 GP-registered adults aged ≥18 and on 5 March 2017, 755 381 were resident within the study area. From this population, 415 166 had a BMI measure within the last 3 years and were free of recorded preg-nancy at the time of measurement. The mean age of the included population was 43.2 years and 48.3% were male. The largest ethnic group was white British/Irish, which represented 24.5% of the study population. Over half of the population were either overweight (31.9%) or obese (23.1%). Same group ethnic density varied across different MSOA, the largest variation was seen among Bangladeshi population with an average ethnic density of 16%, ranging from a minimum of 1% to a maximum of 53%, with similar ranges among Indian (average 7%, range 1%–40%) and white British (average 27%, range 4%–53%). Both Pakistani (average 4%, range 0%–21%) and black African (average 9%, range 1%–26%) had smaller ranges. Chinese (average 2%, range 0%–10%) and black Caribbean (average 5%, range 1%–13%) had the least variation (table 1).
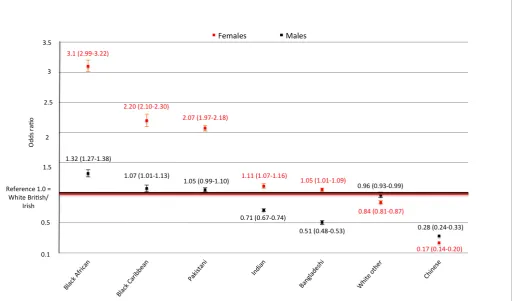
The adjusted odds of obesity by ethnic group are reported in figure 2. In comparison with the white group, those with the highest odds of obesity were black African women (OR 3.10; (95% CI 2.99 to 3.22)), Caribbean (OR 2.20; (95% CI 2.10 to 2.30)) and Pakistani women (OR 2.07; (95% CI 1.97 to 2.18)). In contrast, Chinese men (OR 0.28; (95% CI 0.24 to 0.33)) and women (OR 0.17; (95% CI 0.14 to 0.20)) had significantly lower odds of obesity compared with the white population.
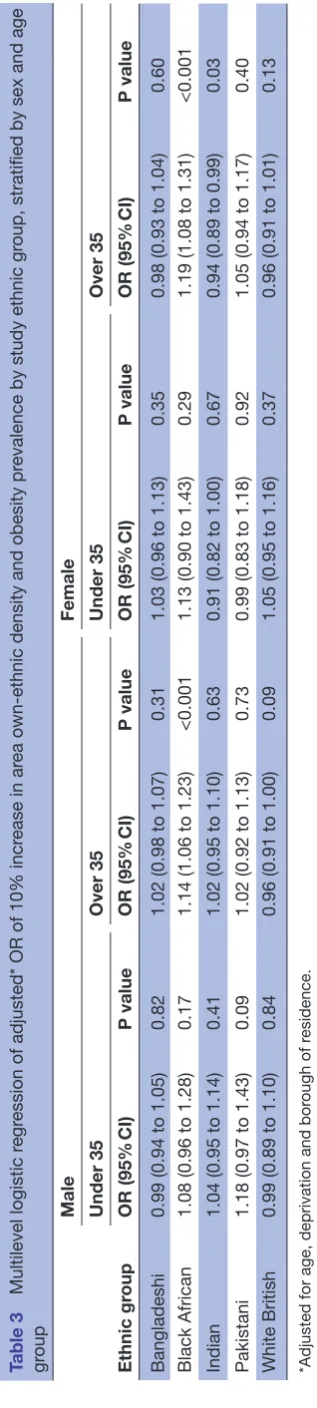
The association between a 10% increase in own-group ethnic density and the prevalence of obesity is described in table 2. We found no association between increasing ethnic density and obesity prevalence for any of the ethnic groups except for black African men and women and Indian women. A 10% increase in black African ethnic density was associated with a 15% (95% CI 1.07 to 1.24) increased odds of obesity among black African men and 18% increase among black African women (95% CI 1.08 to 1.30). This association remained in our sensitivity analyses when changing the threshold of weight, from obese to overweight (BMI ≥25 kg/m2) (see online supple-mentary appendix table 1). Among Indian women, a 10% increase in Indian ethnic density was associated with a 7% (95% CI 0.88 to 0.99) decrease in odds of obesity. There was no significant association among Indian men, and in sensitivity analysis, the association was not present for overweight Indian women (see online supplementary appendix table 1). In those <35 years of age, there was no association between increasing ethnic density and obesity among any ethnic groups (table 3).
Sensitivity analyses using different thresholds for ethnic density, different BMI cut-offs, different age groups and
DIsCussIOn Main findings
Overall, 23.1% of our study population were recorded as obese with considerable variation by ethnic group. Prevalence of obesity among men and women was highest among black Africans and Caribbean groups (both ~39%) and lowest among Chinese ethnic groups (5%). In men, odds of obesity were higher among black ethnic groups compared with white British/Irish males and lower among Chinese, Indian, Bangladeshi and white Other ethnic groups. Among women, all ethnic groups except Chinese and white Other had increased odds of obesity compared with white British/Irish women.
We found a 10% increase in black African ethnic density was associated with a 15% and 18% increased odds of obesity among black African men and women, respectively. This association was present for both obesity and overweight BMI categories but was not present in those <35 years of age. Among Indian women, a 10% increase in Indian ethnic density was associated with a 7% decrease in odds of obesity, but this association was not present at different cut-offs for obesity or for Indian men.
Comparison with existing literature
The crude prevalence of obesity was lower in our study
population (23%) compared with England (27%),2
reflecting the younger age distribution of the east London population. Our findings of variation in prevalence of obesity among ethnic groups demonstrated trends similar to the 2004 Health Survey for England (HSE) study of adult obesity among ethnic groups in England.4 However, among Indian and Bangladeshi females, we found the odds of obesity were higher compared with white British/ Irish females which was not apparent in the 2004 HSE.4
Despite a growing number of studies examining the ethnic density effect, empirical evidence on the mech-anism and underlying pathways remains scant. Among studies exploring ethnic density, protective associations have most commonly been identified for mental health outcomes compared with studies examining physical health measures.15 Such studies have recently been extended to risk-taking behaviour such as smoking, where Mathur et al found increasing ethnic density was associated with a significant reduction in smoking prev-alence among all ethnic groups except black Caribbean females.17
Our data suggest such protective associations do not extend to the risk of obesity among white British/Irish and Bangladeshi ethnic groups. Among Indian females, increasing ethnic density may be protective against obesity; however, this was not a robust finding in sensi-tivity analysis and was not strongly significant (95%CI 0.88 to 0.99). Among black Africans, however, increasing
on September 22, 2020 by guest. Protected by copyright.
Table 1
Characteristics of the study population
Characteristic Total White Black Asian Other British/Irish Other African Caribbean Chinese Bangladeshi Indian Pakistani Mixed/other*
Missing/not stated
N 415 166 101 710 87 157 30 761 18 239 6584 51 575 29 250 16 884 52 650 20 356
Mean age, years (SD)
43.2 (16.3) 45.9 (18.5) 37.6 (13.4) 46.6 (14.1) 55.0 (17.3) 37.0 (15.1) 43.2 (14.6) 44.8 (16.0) 44.2 (15.2) 43.4 (15.6) 36.7 (13.8)
Sex Male
(%) 48.3 48.0 45.8 47.2 41.8 38.4 53.0 53.6 56.2 46.2 49.7 IMD scor e (SD) 42.0 (9.6) 41.3 (10.1) 41.7 (9.9) 45.0 (8.8) 43.5 (8.3) 39.2 (12.1) 43.5 (9.1) 39.7 (7.9) 40.9 (7.3) 42.4 (9.2) 40.7 (10.7)
Residence Hackney
(n) 127 256 38 744 32 693 11 286 8667 1360 2312 3874 1047 19 753 7520 Newham (n) 172 357 29 274 31 229 16 407 7642 1953 19 831 22 450 14 741 22 842 5988
Tower Hamlets (n)
115 553 33 692 23 235 3068 1930 3271 29 432 2926 1096 10 055 6848 W
eight status BMI <20
(%) 8.2 8.9 10.9 3.3 3.8 23.1 5.9 6.9 5.3 7.5 12.0
BMI 20–25 (%)
36.8 40.3 44.8 21.2 23.0 52.8 34.1 34.7 26.3 33.7 42.8
BMI 25–30 (%)
31.9 28.4 27.0 36.3 34.5 19.2 41.1 37.4 38.6 32.9 27.3 BMI >30 (%) 23.1 22.5 17.4 39.3 38.8 4.9 18.9 21.0 29.8 25.8 18.0 Own-gr
oup ethnic density acr
oss dif fer ent MSOA A verage (%) 27 13 9 5 2 16 7 4 – – Minimum (%) 4 4 1 1 0 1 1 0 – – Maximum (%) 53 28 26 13 10 53 40 21 – – *Mixed/other (=white
and black Caribbean, white and black African, white and Asia
n, other mixed, other black, other Asian, other ethnic gr
oup).
BMI, body mass index; IMD, index of multiple deprivation; MSOA, Middle
Super Output Ar
ea.
on September 22, 2020 by guest. Protected by copyright.
ethnic density was found to be strongly associated as a risk factor for obesity. This is consistent with findings from the USA, which found ethnic density was a risk factor for obesity among certain ethnic groups.22 32 However, there is little consistency between US studies in determining which ethnic groups are influenced by ethnic density,23 and studies vary in their use of ethnic group categorisa-tion and in the size of geographical area used to calculate ethnic density, which typically tends to be much larger than we have used.
The lack of effect for most ethnic groups may reflect the complex and competing cultural influences on weight, as well as the overwhelming influence of other factors—in particular the ‘foodscape’, which describes the exposure
of individuals to food outlets in a geographical area.33 34 Previous research on ethnic density and access to food outlets in England, found increasing ethnic density was associated with larger numbers of fast food outlets and supermarkets.35 Such exposure may nullify any benefits of preserving traditional eating habits.
Research among black ethnic groups living in America suggests that, compared with other ethnic groups, black ethnic groups have a strong cultural preference for higher body weight.36 37 Such cultural norms may be amplified in areas of increased ethnic density, where acculturation to the western preferences of body size may be weaker. For example, we found the association between black Africans and increased same ethnic density only among
Figure 2 Multilevel logistic regression of adjusted odds* of obesity by ethnic group and sex, compared with white British/Irish. *Adjusted for age, deprivation, borough of residence, presence of serious mental illness or diabetes.
Table 2 Multilevel logistic regression of adjusted odds* of being obese given a 10% increase in own-group ethnic density for the study ethnic groups
Ethnic group
Male Female
OR (95% CI) P value OR (95% CI) P value
Bangladeshi 1.00 (0.97 to 1.04) 0.72 1.00 (0.95 to 1.06) 0.89
Black African 1.15 (1.07 to 1.24) <0.001 1.18 (1.08 to 1.30) <0.001
Indian 1.03 (0.96 to 1.09) 0.44 0.93 (0.88 to 0.99) 0.02
Pakistani 1.06 (0.96 to 1.17) 0.22 1.05 (0.95 to 1.15) 0.32
White British/Irish 0.98 (0.93 to 1.04) 0.60 0.98 (0.93 to 1.04) 0.56
*Adjusted for age, deprivation and borough of residence.
on September 22, 2020 by guest. Protected by copyright.
older age groups (>35 years); younger generations may be more acculturated to the western preferences of body size, preferring lower BMI.
The lack of variability in ethnic density among the black Caribbean population meant we were unable to examine the association of ethnic density and obesity among this group. In a sensitivity analysis, we clustered black Africans and black Caribbean together, finding no association between increasing black ethnic density and prevalence of obesity among black males or females (see online supple-mentary appendix table 1). This suggests the effects of ethnic density are not generalisable to other black ethnic groups and reflect distinct differences between black African and Caribbean populations, particularly in terms of migration history and residency in the UK.38 The longer period of residence among black Caribbean groups may weaken any effect of ethnic density as the population has more time to acculturate to Western norms.
strengths and limitations
To date, this is the largest study of adult obesity preva-lence among ethnic groups in England, including over 400 000 individuals, of whom over 75% are from ethnic minority groups. It is among the first studies exploring the relationship between ethnic density and obesity in the UK.21 The size of this study means that our findings are unlikely to have arisen by chance, reflected in our narrow confidence intervals for effect size. We explored the consistency of our results by performing a number of sensitivity analyses which confirmed no significant associations for different weight thresholds, different age groups and different clusters of related ethnic groups (see online supplementary appendix table 1).
The use of routine data introduces potential bias, with the risk of non-random absence of data. In common with many variables in electronic healthcare records, BMI recording is incomplete,39 as it is recorded opportunisti-cally or when of clinical relevance. We found differences in the proportions of individuals with a BMI recorded in the last 3 years by ethnic group. The highest complete-ness was among black Caribbean, with 80.9% having a BMI taken in the last 3 years, and lowest among Bangla-deshis with 61.6%. These differences may reflect variation by ethnic groups in their use of primary care services.40 This may lead to differential recording as a source of bias. It is difficult to determine the direction of bias. Those individuals with no recent measure of BMI were younger and free of chronic diseases, and therefore less likely to be obese, resulting in an overestimate of obesity preva-lence in those ethnic groups with higher proportions of missing BMI data. However, while this may impact our estimates for obesity prevalence between ethnic groups, it is unlikely to have effected the examination of ethnic density and obesity prevalence within ethnic groups.
We were unable to adjust for other potential confounders of the relationship between ethnic density and obesity, such as availability of green space and density of fast food outlets, and we could not explore differences
Table 3
Multilevel logistic r
egr
ession of adjusted* OR of 10% incr
ease in ar
ea own-ethnic density and obesity pr
evalence by study ethnic gr
oup, stratified by sex and age
gr
oup
Ethnic gr
oup
Male
Female
Under 35
Over 35
Under 35
Over 35
OR
(95%
CI)
P value
OR
(95%
CI)
P value
OR
(95%
CI)
P value
OR
(95%
CI)
P value
Bangladeshi
0.99 (0.94 to 1.05)
0.82
1.02 (0.98 to 1.07)
0.31
1.03 (0.96 to 1.13)
0.35
0.98 (0.93 to 1.04)
0.60
Black African
1.08 (0.96 to 1.28)
0.17
1.14 (1.06 to 1.23)
<0.001
1.13 (0.90 to 1.43)
0.29
1.19 (1.08 to 1.31)
<0.001
Indian
1.04 (0.95 to 1.14)
0.41
1.02 (0.95 to 1.10)
0.63
0.91 (0.82 to 1.00)
0.67
0.94 (0.89 to 0.99)
0.03
Pakistani
1.18 (0.97 to 1.43)
0.09
1.02 (0.92 to 1.13)
0.73
0.99 (0.83 to 1.18)
0.92
1.05 (0.94 to 1.17)
0.40
White British
0.99 (0.89 to 1.10)
0.84
0.96 (0.91 to 1.00)
0.09
1.05 (0.95 to 1.16)
0.37
0.96 (0.91 to 1.01)
0.13
*Adjusted for age, deprivation and bor
ough of r
esidence.
on September 22, 2020 by guest. Protected by copyright.
proxy measure of individual deprivation by using IMD. We were unable to measure deprivation at the level at which ethnic density was recorded. Our proxy measure of individual deprivation, IMD, is measured at the LSOA level and is likely to have captured deprivation at the level ethnic density was recorded. However, it is possible it did not fully capture deprivation thereby potentially masking any ethnic density effect.
Implications for practice and policy
The obesity epidemic, and associated health effects, is structured by social deprivation and by ethnic group. Our data suggest ethnic density does not play a protec-tive role in preventing obesity. It is possible that environ-mental factors such as food, exercise and cultural norms play a greater role in determining obesity than the ethnic composition of the area. Health policy should continue to focus on the known environmental factors that influ-ence obesity such as the proximity of highly calorific food,33 availability of green space41 and encouraging active transport.42
Further understanding of the ethnic disparities in the UK obesity epidemic may best be served by learning from groups with the lowest prevalence of obesity, such as the Chinese populations. Understanding the mechanisms through which Chinese immigrant populations in the UK maintain a healthy body weight may help formulate policy relevant to other ethnic groups. Further research is also needed to explore why among black Africans, increasing own-group ethnic density is associated with obesity, and how this can be tackled to reduce the burden of obesity experienced by black Africans living in the UK.
Acknowledgements The authors are grateful to the participating GPs for their
cooperation, without which such studies would be impossible. The authors are grateful for advice and support on data extraction from Kate Homer.
Contributors SH designed the study. SS extracted relevant data from electronic
health records. SS and RM conducted statistical analysis, and all authors contributed to data interpretation and revising drafts produced by SS. All authors had full access to all the data collected, have checked for accuracy and have approved the final version of this manuscript.
Funding The authors have not declared a specific grant for this research from any
funding agency in the public, commercial or not-for-profit sectors.
Map disclaimer Article contains map figures. Please include below disclaimer in
the endnotes. The depiction of boundaries on the map(s) in this article do not imply the expression of any opinion whatsoever on the part of BMJ (or any member of its group) concerning the legal status of any country, territory, jurisdiction or area or of its authorities. The map(s) are provided without any warranty of any kind, either express or implied.
Disclaimer This article presents independent research. The views expressed in
this publication are those of the author(s) and not necessarily those of the NHS, the Health Foundation or the University. The depiction of boundaries on the map(s) in this article do not imply the expression of any opinion whatsoever on the part of BMJ (or any member of its group) concerning the legal status of any country, territory, jurisdiction or area or of its authorities. The map(s) are provided without any warranty of any kind, either express or implied.
Competing interests None declared.
Patient consent for publication Not required.
patient data for research and development for patient benefit.
Provenance and peer review Not commissioned; externally peer reviewed.
Data sharing statement No additional data are available.
Author note SS is the guarantor of the report. SS affirms that the manuscript is
an honest, accurate and transparent account of the study being reported; that no important aspects of the study have been omitted and that any discrepancies from the study as planned have been explained.
Open access This is an open access article distributed in accordance with the
Creative Commons Attribution Non Commercial (CC BY-NC 4.0) license, which permits others to distribute, remix, adapt, build upon this work non-commercially, and license their derivative works on different terms, provided the original work is properly cited, appropriate credit is given, any changes made indicated, and the use is non-commercial. See: http:// creativecommons. org/ licenses/ by- nc/ 4. 0/.
reFerenCes
1. NCD Risk Factor Collaboration. Trends in adult body-mass index in 200 countries from 1975 to 2014: a pooled analysis of 1698 population-based measurement studies with 19.2 million participants.. The Lancet 2016;387:1377-96.
2. Moody A. Health Survey for England 2015: Adult overweight and obesity, 2016. http://www. content. digital. nhs. uk/ catalogue/ PUB22610/ HSE2015- Adult- obe. pdf [Accessed 30 May 2017]. 3. Wang YC, McPherson K, Marsh T, et al. Health and economic burden
of the projected obesity trends in the USA and the UK. Lancet 2011;378:815–25.
4. Health Survey of England: Health of ethnic minorities, 2004. http:// content. digital. nhs. uk/ catalogue/ PUB01209/ heal- surv- hea- eth- min- hea- tab- eng- 2004- rep. pdf
5. Higgins V. Ethnic Differences in Obesity, Diet and Physical Activity - A Literature review, 2008. http:// hummedia. manchester. ac. uk/ institutes/ cmist/ archive- publications/ working- papers/ 2008/ 2008- 17- ethnic- differences- in- obesity- diet- abd- physical- activity. pdf [Accessed 12 July].
6. Delavari M, Sønderlund AL, Swinburn B, et al. Acculturation and obesity among migrant populations in high income countries – a systematic review. BMC Public Health 2013;13:458–58. 7. Hazuda HP, Mitchell BD, Haffner SM, et al. Obesity in Mexican
American subgroups: findings from the San Antonio Heart Study. Am J Clin Nutr 1991;53:1529S–34.
8. Lee SK, Sobal J, Frongillo EA. Acculturation and health in Korean Americans. Soc Sci Med 2000;51:159–73.
9. Williams R. Health and length of residence among south Asians in Glasgow: a study controlling for age. J Public Health Med 1993;15:52–60.
10. Smith NR, Kelly YJ, Nazroo JY. The effects of acculturation on obesity rates in ethnic minorities in England: evidence from the Health Survey for England. Eur J Public Health 2012;22:508–13. 11. Holmboe-Ottesen G, Wandel M. Changes in dietary habits after
migration and consequences for health: a focus on South Asians in Europe. Food Nutr Res 2012;56:18891.
12. Bécares L, Nazroo J, Stafford M. The buffering effects of ethnic density on experienced racism and health. Health Place 2009;15:700–8.
13. Cozier YC, Yu J, Coogan PF, et al. Racism, segregation, and risk of obesity in the Black Women's Health Study. Am J Epidemiol 2014;179:875–83.
14. Bose M, Oliván B, Laferrère B. Stress and obesity: the role of the hypothalamic-pituitary-adrenal axis in metabolic disease. Curr Opin Endocrinol Diabetes Obes 2009;16:340–6.
15. Shaw RJ, Atkin K, Bécares L, et al. Impact of ethnic density on adult mental disorders: narrative review. Br J Psychiatry 2012;201:11–19. 16. Bécares L, Shaw R, Nazroo J, et al. Ethnic density effects on physical
morbidity, mortality, and health behaviors: a systematic review of the literature. Am J Public Health 2012;102:e33–e66.
17. Mathur R, Schofield P, Smith D, et al. Is individual smoking behaviour influenced by area-level ethnic density? A cross-sectional electronic health database study of inner south-east London. ERJ Open Res 2017;3:00130-2016.
18. Das-Munshi J, Becares L, Dewey ME, et al. Understanding the effect of ethnic density on mental health: multi-level investigation of survey data from England. BMJ 2010;341:c5367.
on September 22, 2020 by guest. Protected by copyright.
19. Schofield P, Das-Munshi J, Mathur R, et al. Does depression diagnosis and antidepressant prescribing vary by location? Analysis of ethnic density associations using a large primary-care dataset. Psychol Med 2016;46:1321–9.
20. Bécares L, Dewey ME, Das-Munshi J. Ethnic density effects for adult mental health: systematic review and meta-analysis of international studies. Psychol Med 2018;48:2054–72.
21. Ecob R, Williams R. Sampling Asian minorities to assess health and welfare. J Epidemiol Community Health 1991;45:93–101.
22. Kirby JB, Liang L, Chen HJ, et al. Race, place, and obesity: the complex relationships among community racial/ethnic composition, individual race/ethnicity, and obesity in the United States. Am J Public Health 2012;102:1572–8.
23. Moloney KL, South SJ. Ethnic density and obesity: evidence from fixed-effects models. Health Place 2015;31:199–207.
24. Astell-Burt T, Feng X, Croteau K, et al. Influence of neighbourhood ethnic density, diet and physical activity on ethnic differences in weight status: a study of 214,807 adults in Australia. Soc Sci Med 2013;93:70–7.
25. EIoD, 2010. Available: https://www. gov. uk/ government/ publications/ english- indices- of- deprivation- 2010
26. Gray LJ, Yates T, Davies MJ, et al. Defining obesity cut-off points for migrant South Asians. PLoS One 2011;6:e26464.
27. O'Brien R, Potter A, Collins TW. 2011 Census analysis: Ethnicity and religion of the non-UK born population in England and Wales: 2011, 2015. Available: https://www. ons. gov. uk/ peop lepo pula tion andc ommunity/ culturalidentity/ ethnicity/ articles/ 2011 cens usan alys iset hnic itya ndre ligi onof then onuk born popu lati onin engl anda ndwales/ 2015- 06- 18
28. Hull S, Mathur R, Boomla K, et al. Research into practice:
understanding ethnic differences in healthcare usage and outcomes in general practice. Br J Gen Pract 2014;64:653–5.
29. Hull SA, Mathur R, Badrick E, et al. Recording ethnicity in primary care: assessing the methods and impact. Br J Gen Pract 2011;61:e290–e294.
30. 2011 Census: Population and Household Estimates for Wards and Output Areas in England and Wales: Office of National Statistics, 2012. Available: https://www. ons. gov. uk/ peop lepo pula tion andc
ommunity/ popu lati onan dmig ration/ populationestimates/ datasets/ 2011 cens uspo pula tion andh ouse hold esti mate sfor ward sand outp utar easi neng land andwales
31. English indices of deprivation, 2015. Available: https://www. gov. uk/ government/ statistics/ english- indices- of- deprivation- 2015 32. Chang VW, Hillier AE, Mehta NK. Neighborhood Racial Isolation,
Disorder and Obesity. Social forces; a scientific medium of social
study and interpretation. 2009;87:2063–92.
33. Burgoine T, Forouhi NG, Griffin SJ, et al. Associations between exposure to takeaway food outlets, takeaway food consumption, and body weight in Cambridgeshire, UK: population based, cross sectional study. BMJ 2014;348:g1464.
34. Lebel A, Daepp MI, Block JP, et al. Quantifying the foodscape: A systematic review and meta-analysis of the validity of commercially available business data. PLoS One 2017;12:e0174417.
35. Molaodi OR, Leyland AH, Ellaway A, et al. Neighbourhood food and physical activity environments in England, UK: does ethnic density matter? Int J Behav Nutr Phys Act 2012;9:75.
36. Quick VM, Byrd-Bredbenner C, eating D. Disordered eating, socio-cultural media influencers, body image, and psychological factors among a racially/ethnically diverse population of college women. Eat Behav 2014;15:37–41.
37. Robinson SA, Webb JB, Butler-Ajibade PT. Body image and modifiable weight control behaviors among black females: a review of the literature. Obesity 2012;20:241–52.
38. Black Britons - The Next Generation. The Economist, 2016. 39. Bhaskaran K, Forbes HJ, Douglas I, et al. Representativeness and
optimal use of body mass index (BMI) in the UK Clinical Practice Research Datalink (CPRD). BMJ Open 2013;3:e003389.
40. Gillam SJ, Jarman B, White P, et al. Ethnic differences in consultation rates in urban general practice. BMJ 1989;299:953–7.
41. Mytton OT, Townsend N, Rutter H, et al. Green space and physical activity: an observational study using Health Survey for England data. Health Place 2012;18:1034–41.
42. Wanner M, Götschi T, Martin-Diener E, et al. Active transport, physical activity, and body weight in adults: a systematic review. Am J Prev Med 2012;42:493–502.
on September 22, 2020 by guest. Protected by copyright.