Generalized estimation of the ventilatory
distribution from the multiple‑breath washout:
a bench evaluation study
Gabriel Casulari Motta‑Ribeiro
1, Frederico Caetano Jandre
1, Hermann Wrigge
2and Antonio Giannella‑Neto
1,2*Background
The estimation of the pulmonary ventilation-to-volume (v/V) distribution may provide clinically useful information on intrapulmonary gas-mixing but is an underused byproduct of the end-expiratory lung volume (EELV) measurements during mechanical ventilation. The v/V can be calculated with the multiple-breath washout (MBW) test, especially using N2 as the inert and low solubility gas (MBN2W). The classical method [1–3] models the
Abstract
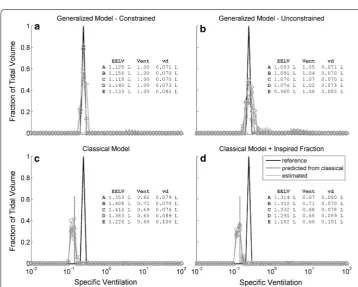
Background: The multiple‑breath washout (MBW) is able to provide information about the distribution of ventilation‑to‑volume (v/V) ratios in the lungs. However, the classical, all‑parallel model may return skewed results due to the mixing effect of a common dead space. The aim of this work is to examine whether a novel mathematical model and algo‑ rithm is able to estimate v/V of a physical model, and to compare its results with those of the classical model. The novel model takes into account a dead space in series with the par‑ allel ventilated compartments, allows for variable tidal volume (VT) and end‑expiratory lung volume (EELV), and does not require a ideal step change of the inert gas concentration. Methods: Two physical models with preset v/V units and a common series dead space (vd) were built and mechanically ventilated. The models underwent MBW with N2 as inert gas, throughout which flow and N2 concentration signals were acquired. Distribu‑ tion of v/V was estimated—via nonnegative least squares, with Tikhonov regulariza‑ tion—with the classical, all‑parallel model (with and without correction for non‑ideal inspiratory N2 step) and with the new, generalized model including breath‑by‑breath vd estimates given by the Fowler method (with and without constrained VT and EELV). Results: The v/V distributions estimated with constrained EELV and VT by the gen‑ eralized model were practically coincident with the actual v/V distribution for both physical models. The v/V distributions calculated with the classical model were shifted leftwards and broader as compared to the reference.
Conclusions: The proposed model and algorithm provided better estimates of v/V than the classical model, particularly with constrained VT and EELV.
Keywords: Pulmonary function tests, Ventilatory distributions, Multiple‑breath washout, End‑expiratory lung volume, Functional residual capacity, Dead space, Nitrogen, Ventilation to volume, Tikhonov regularization, Common dead space
Open Access
© The Author(s) 2018. This article is distributed under the terms of the Creative Commons Attribution 4.0 International License (http://creativecommons.org/licenses/by/4.0/), which permits unrestricted use, distribution, and reproduction in any medium, provided you give appropriate credit to the original author(s) and the source, provide a link to the Creative Commons license, and indicate if changes were made. The Creative Commons Public Domain Dedication waiver (http://creativecommons.org/publicdo‑ main/zero/1.0/) applies to the data made available in this article, unless otherwise stated.
RESEARCH
*Correspondence: [email protected] 1 Pulmonary Engineering Laboratory, Biomedical Engineering Programme, COPPE, Universidade Federal do Rio de Janeiro, Rio de Janeiro, Brazil
lungs as a set of all-parallel units, including a dead space, whose contributions to the total lung ventilation are the unknowns. This approach has some limitations. For instance, it disregards the effects of the series dead space (vd), whose volume may be estimated via the Fowler’s method [4] throughout the washout; not only the EELV but also the tidal volume (VT) must remain constant during the MBN2W; the inspired fraction of tracer gas should decrease instantaneously to zero. Recently, we [5] proposed a generalized multicompart-mental model for MBN2W that includes a series dead space and copes with a non-ideal step change in gas concentration, variable VT during the maneuver, and changes in EELV, as long as no compartment is completely emptied. Computational simulations showed that this model, together with an algorithm to estimate its parameters from measurements taken at the airway opening during MBN2W, usually retrieved more correct estimations of the v/V distribution than previous proposals [5]. Furthermore, the alternative to impose a priori constraints determined along the MBN2W limits the set of the v/V parameters estimates. However, since this same novel model drove the simulated MBN2W, the results could have favored the algorithm in some form. It is arguable, hence, that bench tests with well-known physical models would allow for a better, less biased assessment of the effects of modelling the series dead space in the estimates of v/V distributions.
The present work intends to compare the v/V distributions estimated by both the clas-sical and generalized approaches employing experimental data obtained from phyclas-sical models, under the conditions (constant VT and EELV) required by the assumptions of the classical model. Similar estimation procedures were used for both models, employ-ing non-negative least squares and Tikhonov regularization plus a weightemploy-ing matrix. The generalized approach adds a constrained least squares solver with imposed EELV, VT and vd. The results previously obtained by us [5], with numerically simulated experimen-tal noise, directed the choice of the weighting matrix.
Methods
Mathematical model of the MBN2W
The generalized mathematical model of the MBN2W is as follows. The respiratory sys-tem comprises N parallel compartments, all connected through a single duct whereby the gases are exchanged with the ambient air. Each compartment J, whose volume is VolJ, is an ideal mixer characterized by the fraction γ of VT that enters and leaves it at each cycle, and its specific ventilation (S(J) = γVT/VolJ), the sum of all compartmental volumes being equal to EELV-vd. A series dead space is incorporated, considering that a compartment inspires a mixture of fresh gas from the inspiratory circuit and the con-tent of the common duct. This also allows the model to be driven by a non-ideal step in inspiratory concentration of the tracer gas. Variable VT is admitted by defining S(J) with respect to a reference VT, and variable EELV is achieved by tracking the differences between inspired and expired volumes, returning the distribution corresponding to EELV at the onset of maneuver [5].
In the experimental setup, where VT and EELV were constant, the end-tidal N2 con-centration (FNet
2) at the k-th cycle is modeled by
(1)
FNet
2(k)=
N
J=1
γ (J)FNA
with the compartmental concentrations given by
where α is the dead space to tidal volume ratio (vd/VT).
The classical approach to model multiple compartment MBN2W considers an ideal
step change of the inspired tracer gas at the onset of washout with the dead space as an additional parallel compartment. Under these assumptions, Eq. 2 simplifies to
and the combined compartmental concentrations are fitted to the measured mean expir-atory N2, by adjusting the respective weights. For a single compartment with a series dead space, it can be demonstrated, by using Eqs. 2 and 3, that this classical parallel model estimates a compartment with ventilation (1−α) shifted leftwards (lower specific
ventilation) from the real compartment. The estimated specific ventilation (S′) depends on the actual specific ventilation (S′ = (1 − α) · S/(αS + 1)), causing larger differences for faster compartments. Accordingly, the estimated compartmental volume is equal to EELV.
In case of a non-ideal step at onset of washout, a further shift depending on the ratio of inspired to expired concentrations occurs. To distinguish partially between this effect of a non-ideal step and the presence of a series dead space, an alternative classical model was tested. This is modeled by Eq. 2 with α = 0.
Experimental setup
To test the effect of a series dead space in the washout maneuver under controlled con-ditions, two physical models were assembled: one with four compartments of equal γ
and different VolJ (4C); and one with a single compartment (1C). The 4C allowed to examine the recovery of location, and the spread/breadth of the distribution, while with 1C the classical model distribution shift could be analytically predicted. Both models were ventilated by an Evita XL (Draeger Medical, Lübeck, Germany) and N2, O2 and CO2 concentrations were measured by a fast mass spectrometer (AMIS 2000, Innovi-sion, Glamsbjerg, Denmark). Pressure and flow signals were acquired directly from the ventilator and with a proximal pneumotachograph plus a pressure transducer. In order to synchronize the signals of gas concentration and flow, an uncalibrated flow signal was recorded from a pneumotachograph connected to the mass spectrometer, and the main-stream capnometer from the ventilator was placed close to the gas sampling port. All data were recorded simultaneously with a program written in LabView (National Instru-ments, Austin, USA).
The ventilated compartments were 1-L anesthetic bags (VBM Medizintechnik GmbH, Sulz am Neckar, Germany) with end-expiratory volume maintained by application of a positive end-expiratory pressure (PEEP). A super-syringe inflation determined that at PEEP of 10 cmH2O the volume of the bag was 1 L. CO2 production was simulated by a (2)
FNA
2(J,k)=
FN2et(k−1)α+FN2I (k)(1−α)
S(J)+FN2A(J,k−1)
1+S(J)
(3)
FNA
2(J,k)=
FNA
constant low flow of this gas into the compartment with the smallest v/V ratio. CO2 flow was titrated to achieve end-tidal concentration between 0.5 and 1% to reduce effects in expired volume.
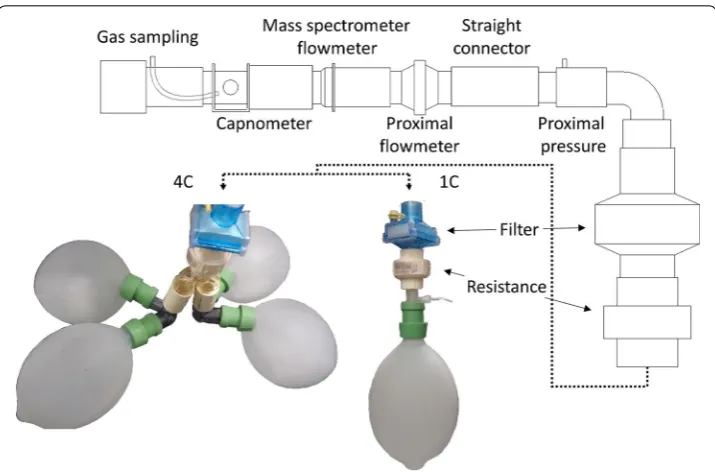
The series dead space comprised an anatomical and an instrumental dead space. The anatomical dead space was represented by a resistive piece and standard connec-tors used in mechanical ventilation, such as 22-to-15 mm reductions and Y-pieces. The instrumental dead space was the connector for sidestream gas sampling and the pneu-motachograph of the mass spectrometer, the mainstream capnometer of the ventilator, the proximal pneumotachograph and pressure outlet, a 90° connector to the resistance, and an HME filter (BB25, Pall Medical, Port Washington, USA) (Fig. 1). The total dead space volume (vd), calculated from the geometry, were of 92 mL for 1C and of 152 mL for 4C.
Tidal volume and end-expiratory volume of compartments were selected to match, as nearly as possible, specific compartments from a logarithmic distribution of N = 50 ventilation-to-volume ratios ranging from 0.01 to 100. The 1C model was ventilated with VT = 250 mL, representing a compartment with S = 0.25. The respiratory frequency was of 15 breaths/min. A total of 5 washouts were performed with a N2 step change from 50% to zero. The 4C model compartments had 1.00, 0.83, 0.69 and 0.57 L and were ventilated with VT = 560 mL, or 140 mL per compartment (S = 0.14, 0.83, 0.69 and 0.57, respectively). Where applicable, the compartmental end-expiratory volumes avail-able for gas washout were reduced by inserting closed, impermeavail-able plastic containers (Profissimo Gefrierbeutel, Germany) into the anesthetic bags, filled with appropriate volumes of air. The respiratory frequency was of 12 breaths/min (7 tests), 10 breaths/min (3 tests) or 15 breaths/min (2 tests). A total of 12 washouts were performed. In 9 tests,
Fig. 1 Representation of the experimental setup. The physical models are shown as photos with the anes‑
the N2 step change was from 50% to zero and in 3 tests the step change was limited from 10% to zero. Experiments were performed in ATPD conditions, disabling the ventilator’s BTPS compensation.
Signal processing
Before the data analysis, gas concentrations and flow were synchronized with a two-step procedure. First, flow curves from the ventilator and the mass spectrometer were aligned by maximizing their cross-correlation. Second, the delay from gas sampling was compensated breath-by-breath using the cross-correlation between the CO2 signals from the mass spectrometer and the ventilator mainstream sensor.
The synchronized signals were processed to estimate vd, EELV and the γ values of the compartments. The vd was calculated from CO2 and volume curves using Fowler’s method [4]. The EELV was estimated from inspired and expired N2 volume during the washout (from onset until a N2 concentration ≤ 1/40th of initial value) [6]. Analogously, the distri-butions were estimated using the same number of cycles. The parameters of the multiple compartment model were estimated with nonnegative least squares and Tikhonov regu-larization with a fixed gain (4 × 10⁻³ for 1C and 3.3 × 10⁻² for 4C) and a weighting matrix
proportional to the compartmental washout ratio [2]. The generalized model was also esti-mated with a constrained least squares solver, imposing the sum of compartmental vol-ume equal to the EELV-vd and unitary total ventilation [5]. Overall resistance and elastance were calculated from pressure and flow signals to ensure similar mechanical behaviors of the compartments. Data were analyzed in MatLab (Mathworks, USA).
Results
The time profile of inspiratory N2 was not that of an ideal step and, as expected, the
washout of 4C was slower than that of 1C (Fig. 2a). EELV was estimated, from the
MBN2W inspired and expired N2 volumes, as 1.13 + 0.01 L for 1C and 3.24 ± 0.07 L for 4C. Typical expiratory capnogram curves were observed, despite the difference in magnitude (Fig. 2b). The estimated vd were 73.8 ± 6.4 mL for 1C and 185.7 ± 4.5 mL for 4C (see the Additional file 1: Tables S1 and S2, for individual estimates of each experi-ment). The calculated overall resistance and elastance were R = 16.6 ± 0.3 cmH2O/ L/s and E = 78.5 ± 1.2 cmH2O/L for 1C and R = 16.1 ± 0.6 cmH2O/L/s and E = 20.8 ± 0.3 cmH2O/L for 4C.
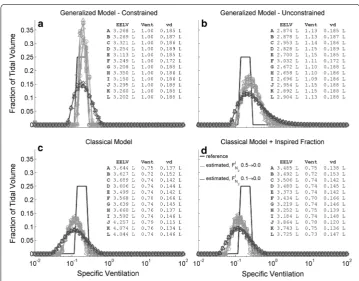
For large N2 step changes (9 washouts, corresponding to cases A to I), the results for the model 4C were analogous to those for 1C. The constrained generalized model esti-mated v/V matching the expected specific ventilation, although narrower (Fig. 4a); the unconstrained generalized model underestimated EELV and overestimated the total
Fig. 2 Examples of N2 washout and CO2 versus volume curves for the single (hollow square) and four
compartment (filled square) physical models. a Inspiratory (black) and expiratory (gray) end‑tidal N2 fractions
during one washout maneuver of each model. b Expired CO2 versus volume, the dashed line represents the
dead space volume as calculated by Fowler’s technique
ventilation by 13%, causing a rightward-shifted and broadened estimated v/V (Fig. 4b). The distribution estimated with the classical model was broader than expected and shifted leftwards from the actual distribution (Fig. 4c, d); the EELV was overestimated by 15% and vd was underestimated by 6%. Again, including the measured inspired N2 in the classical model partially corrected EELV estimation reducing the errors to 7%. For N2 step changes limited to 10% (3 washouts, Fig. 4, corresponding to the cases J to L), all estimated distributions with the generalized as well as the classical approach resulted broadened (Fig. 4) and with larger sums of squared errors relative to the real distribu-tion (Table 1), indicating the deleterious effect of a decreased signal-to-noise ratio on Table 1 Sums of the squared errors between the estimated and true ventilation-to-vol-ume ratio distributions
Single compartment (1C) Four compartments (4C)
50% N2 step 50% N2 step 10% N2 step
Generalized constrained 0.19 ± 0.15 0.07 ± 0.03 0.08 ± 0.006
Generalized unconstrained 0.55 ± 0.15 0.12 ± 0.01 0.12 ± 0.004
Classical 1.21 ± 0.03 0.16 ± 0.01 0.16 ± 0.003
Classical + inspired fraction 1.20 ± 0.02 0.15 ± 0.02 0.16 ± 0.002
Fig. 4 Distribution of specific ventilation estimated from the N2 washout of a four compartments physical model. Results from each of twelve repetitions are represented (A to I, in light gray, with FN2I step from 0.5 to 0, and J to L, in dark gray, with FN2I step from 0.1 to 0), with different symbols for each test. The reference distributions are shown in black. EELV is the end‑expiratory lung volume; vent is the sum of the fractional compartmental ventilations (∑γ); and vd is the dead space volume estimated by: Fowler’s technique (for the generalized model, panels a and b) or the complement of total ventilation (for the classical model, panels c
the estimates. All individual estimated distributions are shown in the Additional file 1: Figures S5–S8.
Discussion
We proposed a bench comparison between a novel generalized mathematical model for the MBN2W [5] and a classical all-parallel model [1]. The tests were performed with a commercial intensive care unit ventilator and physical models mimicking lungs with one or four parallel compartments and a common series dead space. The main results are: (1) the retrieved v/V distribution with the constrained generalized approach was practi-cally coincidental with the actual v/V distribution for both physical models for high N2 step changes; the unconstrained solution did not represent the expected distributions, missing the true values of EELV and VT; (2) the v/V distribution retrieved with the clas-sical approach was leftward shifted and broader, as compared to the actual, and its cor-responding estimates of EELV were slightly favored when the non-ideal step change of N2 at the washout onset was taken into account.
We used estimates of respiratory mechanics to provide a first assessment of the repro-ducibility of the tests and of the assumption of equal ventilation to each of the compart-ments in 4C. The small spread shows that the physical properties of the models may be considered constant along the washout repetitions, while the fourfold decrease in elastance in 4C compared to 1C suggests that all four anesthetic bags have similar com-pliances and, consequently, similar ventilations.
The anatomy of the airways consists of a network of ramifications where a strictly common dead space is restricted only to the trachea [7]. The set of subdivisions from the main bronchi to the deeper bronchioles results, during the expiration, in a mixture of alveolar gases originated from their respective airways. Thus, assuming the totality of the anatomical dead space simply as a common series duct is a considerable simplifica-tion, even though, as reported by Fortune and Wagner [8], most of the dead space lies proximal to the carina. Nevertheless, the lungs, as represented by the classical model (alveoli connected to the airways opening and the airways as one additional parallel compartment), is less corresponding to the reality. In the present experiments, the phys-ical models agreed very well to the proposed mathematphys-ical model, since most of the tub-ings comprise the common dead space.
Nevertheless, a tradeoff between accuracy and sensitivity to noise and artifacts is expected, hence this choice should be subjected to further investigations.
The distribution recovering technique applied to the classical model is essentially unconstrained. The solution includes the estimates of EELV and the parallel dead space of the distribution. This dead space does not necessarily correspond to vd, representing the ventilation of a compartment with an infinite specific ventilation [3]. Regarding the EELV estimates, they were always overestimated with the classical model. EELV alone has been increasingly regarded as a useful parameter to evaluate the overall lung aera-tion [9], and it may be straightforwardly calculated by the breath-by-breath summation of the net N2 (or other inert gas) volumes expired during the washout.
For the generalized model of MBN2W, the EELV that serves as input to the constrained least squares estimation was calculated as above. The EELV estimates resulted accurate for both physical models. Gas exchange calculations based on measurements of gas con-centrations and flow rate are very sensitive to the correction of the time delay between these signals [10]. A mainstream capnometer, currently a usual instrument in mechani-cal ventilation, was used as the time reference to synchronize the mass spectrometer measurements with the flow rate. This time correction, using just the maximal cross-correlation between the CO2 concentration signals from the capnometer and the mass spectrometer, revealed feasible and reliable (EELV error < 5% and variability between repetitions < 10% [6]). Alternatively, an ultrasound flowmeter monitoring the washout of sulfur hexafluoride (SF6), an inert and insoluble gas with a high molecular mass com-pared to the ambient air components, may be used. This device allows simultaneous and synchronous measures of flow rate and SF6 concentration and has been used for the esti-mation of ventilatory inhomogeneity [11, 12].
Breath-by-breath estimates of the series dead space is a requirement for both the con-strained and the unconcon-strained generalized v/V distribution. Instead of using predic-tion formulae, a direct measurement of that dead space is recommended, for example by applying Fowler’s technique [4] to the capnogram [5] as in the present work. Pre-diction formulae are scarce and inaccurate, especially for some conditions such as dur-ing mechanical ventilation, in which body position varies and EELV depends on the applied PEEP. For instance, there are conflicting reports as to the effect of the dead space on a vastly employed index to quantify ventilatory inhomogeneity, the lung clearance index (LCI). Despite Haidopoulou et al. [11] concluded that LCI is minimally affected by airway dead space, Neumann et al. [12] found an association between LCI and vd/ VT. The LCI is an overall index of ventilatory inhomogeneity; in theory the increase of vd/VT should increase the magnitude of LCI. As an alternative, the alveolar lung clear-ance index (aLCI) [11] was proposed by considering the alveolar ventilation instead of the total ventilation as the bulk flow washing the alveolar units. The present general-ized approach is based on the same assumption. Notably, an error in vd estimation will result in a shifted distribution [5], as demonstrated with the extreme case of the classical model. Likewise, if vd is overestimated the shift will be to the right (Additional file 1: Fig-ure S9) due to slower washout (increased rebreathing) for each modeled v/V.
three assumptions relevant to the estimation method are smoothness, known bounds and discrete representativity. The first assumption was discussed above. The bounds used here are the same from [1, 13], and clearly will lead to wrong estimates if they don’t encompass all the v/V ratios of the real compartments. The a priori choice of 50 com-partments is usual in the literature [1, 3, 13, 14]. In this study we tried to match every physical compartment to values present in the chosen 50 v/V ratios, favoring estimation: mismatch(es) between the physical v/V ratios and the set of chosen v/V ratios in the mathematical model will, in general, cause the true ratio to be represented by a combi-nation of modeled compartments. This should affect mainly the amplitude and breadth of the distribution, and less its location. An example of the effects of such mismatch can be seen in Additional file 1: Figure S10.
Some limitations are addressed hereupon. To our best knowledge, this is the first report on multiple-breath washout of a multicompartmental physical model. Hence, we could not discuss our results against the literature as to possible comparative improve-ments. The physical models were limited to up to 4 units and this is far from the number of units found in experimental works with humans [3, 14–16]. Considering that the v/V is distributed on a log scale, a simulation with many more units would be difficult to perform in view of the present method of construction of v/V units. For the estimation of v/V distribution we used the same cycles selected for calculating the EELV [6]. For our combination of VT and compartments’ volumes, this choice lead to a larger number of cycles than the commonly used of 17 [1, 2], which could have favored our results. Numerical simulations showed that, for the generalized model, both choices of cycles have similar estimations, although 17 cycles respected more the number of modes [5]. In the Additional file 1: Figures S1–S8, we show that this equivalence holds true in our experimental condition, including for the classical model. Lastly, one of the features of the generalized approach to estimate v/V distributions is that VT and EELV are not nec-essarily constrained to be constant, as in the classical method. The present results did not include tests with variable ventilation [17] feasible at the laboratory since commer-cial mechanical ventilators currently feature this choice of strategy.
Conclusions
In conclusion, the present work compared the v/V distributions estimated by both the classical and generalized approaches employing experimental data obtained with in vitro models. The method that resulted in better coincidence with the actual distribution was the generalized approach with a constrained least squares solver with imposed EELV and VT.
Abbreviations
MBN2W: multiple‑breath nitrogen washout; EELV: end‑expiratory lung volume; vd: series dead space; v/V: ventilation‑ to‑volume; VT: tidal volume; N: number of modeled alveolar units; Vol: alveolar unit end‑expiratory volume; γ: alveolar
Additional file
unit fraction of tidal volume; J: index of alveolar unit; S: specific ventilation; k: index of breath cycle; FA
N2: alveolar unit
concentration of N2; FetN2: end‑tidal N2 concentration; F
I,A
N2: alveolar unit inspired N2 concentration; FNI2: ventilator delivered N2 concentration.
Authors’ contributions
GCMR and AGN conceived the work, developed the physical models and performed the tests. GCMR, FCJ, HW and AGN drafted, revised the manuscript. All authors read and approved the final manuscript.
Author details
1 Pulmonary Engineering Laboratory, Biomedical Engineering Programme, COPPE, Universidade Federal do Rio de Janeiro, Rio de Janeiro, Brazil. 2 Department of Anesthesiology and Intensive Care Medicine, University of Leipzig, Leipzig, Germany.
Acknowledgements
The authors would like to thank Alessandro Beda for developing the time delay correction software.
Competing interests
The authors declare that they have no competing interests.
Availability of data and materials
The results from the experiments of the current study are available from the corresponding author on request.
Consent for publication Not applicable.
Ethics approval and consent to participate Not applicable.
Funding
AGN was founded by CAPES, Ministério da Educação do Brasil (Fellowship BEX10876/13‑8), AGN, FCJ and GMR were founded by FAPERJ—Fundação Carlos Chagas Filho de Amparo à Pesquisa do Estado do Rio de Janeiro and CNPq— Brazilian Research Council. To cover publishing costs, we acknowledge support from the German Research Foundation (DFG) and Leipzig University within the program of Open Access Publishing. The funders had no role in study design, data collection and analysis, decision to publish, or preparation of the manuscript.
Publisher’s Note
Springer Nature remains neutral with regard to jurisdictional claims in published maps and institutional affiliations.
Received: 8 May 2017 Accepted: 11 January 2018
References
1. Wagner PD. Information content of the multibreath nitrogen washout. J Appl Physiol Respir Environ Exerc Physiol. 1979;46:579–87.
2. Whiteley JP, Gavaghan DJ, Hahn CE. A mathematical evaluation of the multiple breath nitrogen washout (MBNW) technique and the multiple inert gas elimination technique (MIGET). J Theor Biol. 1998;194:517–39. https://doi. org/10.1006/jtbi.1998.0772.
3. Lewis SM, Evans JW, Jalowayski AA. Continuous distributions of specific ventilation recovered from inert gas wash‑ out. J Apply Physiol Respir Environ Exerc Physiol. 1978;44:416–23.
4. Fowler WS. Lung function studies. II. The respiratory dead space. Am J Physiol. 1948;154:405–16.
5. Motta‑Ribeiro GC, Jandre FC, Wrigge H, Giannella‑Neto A. Generalized estimation of the ventilatory distribution from the multiple‑breath nitrogen washout. Biomed Eng Online. 2016;15:89.
6. Robinson PD, Latzin P, Verbanck S, Hall GL, Horsley A, Gappa M, et al. Consensus statement for inert gas washout measurement using multiple‑ and single‑ breath tests. Eur Respir J. 2013;41:507–22. https://doi. org/10.1183/09031936.00069712.
7. Weibel ER. What makes a good lung? Swiss Med Wkly. 2009;139:375–86. https://doi.org/10.4414/smw.2009.12270. 8. Fortune JB, Wagner PD. Effects of common dead space on inert gas exchange in mathematical models of the lung. J
Appl Physiol. 1979;47:896–906.
9. Chiumello D, Cressoni M, Chierichetti M, Tallarini F, Botticelli M, Berto V, et al. Nitrogen washout/washin, helium dilu‑ tion and computed tomography in the assessment of end expiratory lung volume. Crit Care. 2008;12:R150. https:// doi.org/10.1186/cc7139.
10. Brunner JX, Wolff G, Cumming G, Langenstein H. Accurate measurement of N2 volumes during N2 washout requires dynamic adjustment of delay time. J Appl Physiol. 1985;59:1008–12.
11. Haidopoulou K, Lum S, Turcu S, Guinard C, Aurora P, Stocks J, et al. Alveolar LCI vs. standard LCI in detecting early CF lung disease. Respir Physiol Neurobiol. 2012;180:247–51.
12. Neumann RP, Pillow JJ, Thamrin C, Frey U, Schulzke SM. Influence of respiratory dead space on lung clearance index in preterm infants. Respir Physiol Neurobiol. 2016;223:43–8.
• We accept pre-submission inquiries
• Our selector tool helps you to find the most relevant journal • We provide round the clock customer support
• Convenient online submission • Thorough peer review
• Inclusion in PubMed and all major indexing services • Maximum visibility for your research
Submit your manuscript at www.biomedcentral.com/submit
Submit your next manuscript to BioMed Central
and we will help you at every step:
14. Prisk GK, Guy HJ, Elliott AR, Paiva M, West JB. Ventilatory inhomogeneity determined from multiple‑breath washouts during sustained microgravity on Spacelab SLS‑1. J Appl Physiol. 1994;78:597–607.