https://doi.org/10.5194/essd-9-657-2017 © Author(s) 2017. This work is distributed under the Creative Commons Attribution 3.0 License.
floodX: urban flash flood experiments monitored with
conventional and alternative sensors
Matthew Moy de Vitry1,2, Simon Dicht1, and João P. Leitão1
1Eawag, Swiss Federal Institute of Aquatic Science and Technology, 8600 Dübendorf, Switzerland 2Institute of Civil, Environmental and Geomatic Engineering, ETH Zurich, 8093 Zurich, Switzerland
Correspondence to:Matthew Moy de Vitry ([email protected])
Received: 1 February 2017 – Discussion started: 23 February 2017 Revised: 24 July 2017 – Accepted: 25 July 2017 – Published: 4 September 2017
Abstract. The data sets described in this paper provide a basis for developing and testing new methods for monitoring and modelling urban pluvial flash floods. Pluvial flash floods are a growing hazard to property and inhabitants’ well-being in urban areas. However, the lack of appropriate data collection methods is often cited as an impediment for reliable flood modelling, thereby hindering the improvement of flood risk mapping and early warning systems. The potential of surveillance infrastructure and social media is starting to draw attention for this purpose. In the floodX project, 22 controlled urban flash floods were generated in a flood response training facility and monitored with state-of-the-art sensors as well as standard surveillance cameras. With these data, it is possible to explore the use of video data and computer vision for urban flood monitoring and modelling. The floodX project stands out as the largest documented flood experiment of its kind, providing both conventional measurements and video data in parallel and at high temporal resolution. The data set used in this paper is available at https://doi.org/10.5281/zenodo.830513.
1 Introduction
1.1 The need for comprehensive urban flood data
Urban pluvial floods, which occur when precipitation cannot be fully assimilated by a city’s drainage system, can cause substantial economic disruption and claim lives every year. In Switzerland, the damages caused by surface water runoff to urban infrastructure is around CHF 45 million per annum,1 and the figure is proportionally similar in the United King-dom (Evans, 2004). Numerical modelling is an essential tool for urban flood risk assessment and flood risk management, allowing flood events to be simulated so that drainage sys-tem weaknesses can be identified and possible corrective so-lutions can be evaluated. Additionally, such models make it possible to create detailed forecasts and optimize drainage network operation with model predictive control (Raso and Malaterre, 2016). Currently, urban pluvial flood models are most often calibrated with monitoring data from sensors
in-1Etablissement Cantonal d’Assurance, Switzerland, personal
communication, 2016
stalled in the underground drainage network, if at all. This information, while sufficient for modelling urban drainage in normal weather conditions, does not directly inform on the situation above ground during flood events. The lack of surface flood information leaves model parameters such as ground roughness with large uncertainty (Hunter et al., 2008), and makes it difficult to estimate the predictive per-formance of the model (Dottori and Todini, 2013). This de-ficiency is regularly brought up in urban flood modelling re-search (Fewtrell et al., 2011; Hénonin et al., 2015; Sampson et al., 2012; Schmitt et al., 2004). Additionally, the lack of data limits the detail in which events can be modelled (Ciervo et al., 2015). To further illustrate the need for urban flood calibration data, Leandro et al. (2011) proposed a method for circumventing the issue by using detailed physical models to generate virtual overland flow data.
ve-658 M. Moy de Vitry et al.: floodX
locimetry (LSPIV) can be used to estimate flood discharges, and researchers have started leveraging social media and crowdsourcing to collect data for this purpose (Le Bour-sicaud et al., 2016; Le Coz et al., 2016; Dramais et al., 2011). The potential of such data will grow as the availability and pervasiveness of image-capturing devices such as smart-phones, surveillance cameras, and unmanned aerial vehicles (Perks et al., 2016) increases.
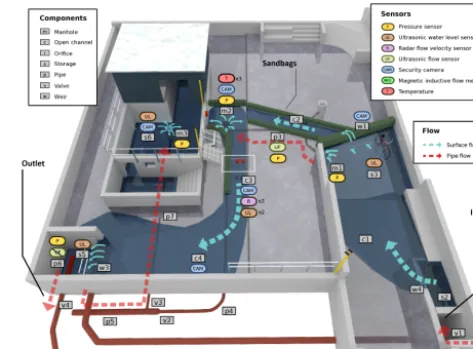
In this context, the floodX project was launched to create a comprehensive urban flood data set in which conventional sensors are complemented with surveillance cameras in a controlled environment. Three key points make the floodX project stand out. First, it is the largest-scale controlled ex-periment examining the urban pluvial flood phenomenon (compare Fraga et al., 2015; Hakiel and Szydłowski, 2016; Testa et al., 2007). Second, the experiment has a relatively high density of sensors providing information at major stor-age nodes and flow channels (Fig. 1) so a comprehensive pic-ture of the flooding dynamics can be gained. Third, the sen-sors used are a combination of state-of-the-art conventional sensors, such as a magnetic-inductive pipe profiler and radar-based flow measurement, and novel sources of data (surveil-lance cameras) for monitoring water levels, overland flow ve-locities, and manhole overflows.
In summary, the floodX data will be used for two distinct but related areas of urban flood research: (i) automatic in-terpretation of image data into useful information for flood monitoring and model validation, and (ii) development of flood model calibration methods with overland flow data to improve the predictive power of the models.
1.2 Paper structure
The following sections contain information essential for un-derstanding and using the data produced from the conducted flash flooding experiments. In Sect. 2, the hydraulic network of the experimental setup is presented and its general hy-draulic behaviour is described. In Sect. 3, an overview of the sensor network is given, and in Sect. 4 the experimental pro-cedure and data preparation are presented. In Sect. 5, the ac-curacy of the data with regard to temporal shifts, drifts, and anomalies is described. In Sect. 6, the organization, avail-ability, and licences of the data are presented. In Sect. 7, an outline is given of the potential applications of the data for urban pluvial flood research.
2 Hydraulic network
The experiments took place at a flood response training fa-cility (Fig. 1) at a military training area in the Canton of Bern, Switzerland. This facility was used for a period of 5 days, during which the whole experimental setup was in-stalled, used, and dismantled. Water comes from a 450 m3 reservoir 10 m higher than the facility and is continually re-plenished by surrounding groundwater at low but stable rate.
Figure 1.Computer rendering of the flood facility, illustrating main hydraulic flows on the surface (blue arrows), and in pipes (red ar-rows). The labels indicate hydraulic components and the placement of sensors; the “CAM” labels indicate what component is in the centre of each camera view.
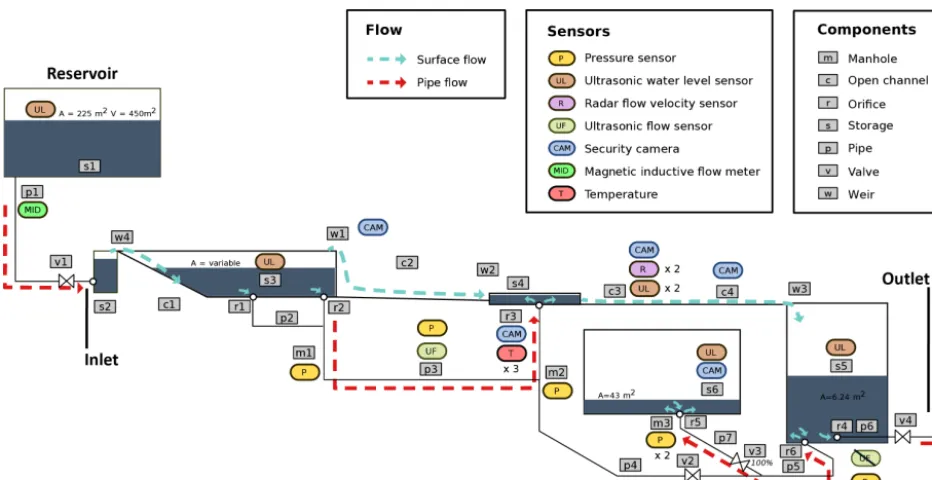
The facility consists of a floodable area of around 500 m2 with a maximum elevation difference of 2.9 m. It contains a small construction with a basement and has a configurable drainage system with multiple drainage points and manholes. The floodX Documentation package (Moy de Vitry et al., 2017a) contains the detailed construction plans of the facility. The existing hydraulic network was configured in a way that would instigate dynamic behaviour and increase the re-sponse time of the facility, despite its limited size. To this end, sandbag walls were used to dam and channel water, and valves of the sewer network were configured so that the sys-tem would display the following phenomena relevant to ur-ban flooding: indoor and outdoor ponding of water, drainage into sewer inlets, overflowing of a surcharged manhole, and overland flow of one-dimensional and two-dimensional char-acter. The resulting hydraulic network, including the reser-voir, is depicted schematically in Fig. 2. The locations and characteristics of the hydraulic components can be found in thefloodX Documentationpackage. The measurement of flow at the inlet and outlet pipes of the system (p1 and p6, Fig. 2) was a challenge because of the non-laminar flow con-ditions caused by a turn in the pipe or the presence of valve v4, respectively. For this reason, the flow meters were in-stalled in specially designed pipe extensions as documented in the Supplement.
wa-Figure 2.Schematic representation of the facility and reservoir’s hydraulic network, including hydraulic components and sensors.
ter can spill at weir w1 and into an open channel c2. Two orifices (r1 and r2) drain storage s3 into manhole m1, from which the water can flow to manhole m2 through pipe p3. The natural exit of manhole m2 is pipe p4, but valve v2 at the extremity of pipe p4 was closed during the experiments, causing manhole m2 to overflow through its opening r3 into a small storage area s4. Storage s4 is also the outlet of chan-nel c2, which originates from the dam overflow w1. Stor-age s4 drains through open channel c3 (well-defined channel walls) and channel c4 (no walls) into shaft s5, at the base of which there are two orifices. The first orifice (r4) leads out of the facility through pipe p6, valve v4 and pipe p8. The second orifice (r6) leads to a manhole (m3) in the base-ment of the small building through pipe p5, valve v3 and pipe p7. Because valve v4 was partially closed, water could build up in the exit shaft s5 and cause manhole m3 to overflow through its opening r5 and into the basement s6. These hy-draulic components are graphically represented in Fig. 2 and their characteristics can be found in thefloodX Documenta-tionpackage.
3 Sensor network
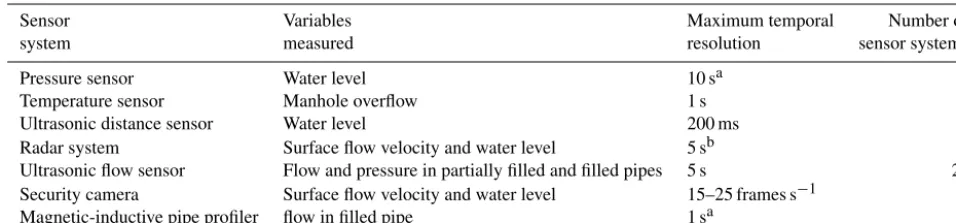
A total of 21 sensor systems were installed to monitor flooding-relevant variables (Table 1). For readability, the complete list of sensors, including their mounting location and other relevant information can be found in the floodX Documentation package. The sensors used were not only state-of-the-art equipment used in urban drainage monitor-ing, but also security cameras and temperature probes for monitoring surface flooding. Naturally, some sensor systems
were composed of multiple sensors – for example a Radar flow measurement system not only measures surface veloc-ity but also water level. The naming convention used for data sources guarantees clear distinction between sensors (e.g. p1_q_mid_endress_logi designates data from pipe p1 repre-senting discharge measured with a magnetic-inductive sensor produced by Endress+Hauser and logged with a Logitech data logger).
4 Experimental procedure and data preprocessing
4.1 Initial conditions of the hydraulic network
To ensure that manhole m2 would overflow, the valve v2 was closed for each experiment. Thus, to enter the basement, the water has to flow over the surface (channels c3 and c4) to the shaft s5 and flow back through pipes p5 and p7, and out the manhole m3. However, this also meant that water could not drain from pipes p3 and p4 at the end of a flood event. Most often, before the start of an experiment, valve v2 was opened and pipes p3 and p4 were allowed to drain. However, in a few cases, the water was intentionally left in pipes p3 and p4. The consequence of pipes p3 and p4 being full is that the system would respond much faster to inflow, thus resulting in man-hole m2 overflowing very rapidly. Valve v4, which allows the whole facility to be drained, was fully opened between each experiment.
4.2 Experiment execution
660 M. Moy de Vitry et al.: floodX
Table 1.Sensor systems installed for flood monitoring.
Sensor Variables Maximum temporal Number of
system measured resolution sensor systems
Pressure sensor Water level 10 sa 3
Temperature sensor Manhole overflow 1 s 4
Ultrasonic distance sensor Water level 200 ms 4
Radar system Surface flow velocity and water level 5 sb 2
Ultrasonic flow sensor Flow and pressure in partially filled and filled pipes 5 s 2c
Security camera Surface flow velocity and water level 15–25 frames s−1 5
Magnetic-inductive pipe profiler flow in filled pipe 1 sa 1
aThe data recorded directly by the sensor data logger have a resolution of 1 min, but a greater temporal resolution can be acquired by interpreting images of the data
logger screen.bTwo systems were installed at the same location. One has a temporal resolution of 1 min and the other of 5 s. See floodX Documentation package for
more information.cData from one of the two sensors were omitted from the final data sets due to quality issues.
used for the experiments were based on simple step-like functions rather than realistic-looking hydrographs. There are several justifications for this. First, the valve control-ling the inflow to the system had to be controlled manually and therefore the flow commands had to be simply defined. Second, well-defined shapes make the experiments more re-producible, and third, the presence of a high-storage node (s3) at the very start of the hydraulic network dampens high-frequency variability of flow into the system. The extra effort to produce such variability was therefore not justified.
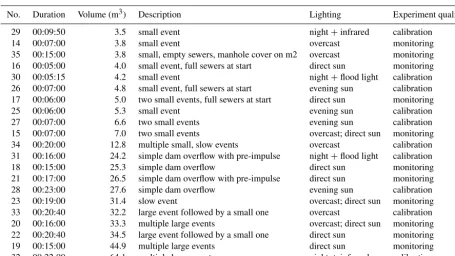
The individual experiments (Table 2) were planned to be as expedient as possible, so as to optimize the experimenta-tion time. For this reason, experiments were stopped after the main dynamics of the system stabilized, even though water often remained in some pipes as well as in the exit shaft s5. The experiments range from a scale of 3.5 to 64.1 m3 dis-charge volume, and last between 6 and 23 min. The hydro-graphs of the flood events were defined through trial and er-ror to produce a range of system responses (e.g. occurrence of dam overflow, flooding in basement). The environmental conditions in which the experiments were carried out include overcast skies, direct sunlight, windy conditions, and night so the robustness of video-based flood monitoring can be tested.
4.3 Variable quality of flood experiment data
The experiments conducted produced data with varying de-grees of quality (Table 2). Three levels of experiment data quality have been defined in order to facilitate reuse of the data:
– Insufficient quality experiments have issues with sen-sor performance and experimental layout. These ex-periments are omitted from the preprocessed data sets. However, they are still available in the raw data and documented in the metadata provided in the floodX Raw Data, Metadata, and Preprocessing Codepackage (Moy de Vitry et al., 2017h).
– Monitoring quality experiments provide data that can be used for investigating novel flood monitoring ap-proaches with video material. The data provided are cor-rect but the hydraulic system (e.g. valve configuration) is not necessarily the same between experiments, and so the data are not suited for model calibration research. The data set for these experiments is available in the floodX Preprocessed Monitoring Datapackage (Moy de Vitry et al., 2017g).
– Calibration quality experiments are a subset of the mon-itoring quality experiments and can be used to calibrate and validate urban flooding and drainage models. The hydraulic system is the same for each experiment, only the hydrograph differs. The data set for these experi-ments is available in thefloodX Preprocessed Calibra-tion Datapackage (Moy de Vitry et al., 2017f).
4.4 Preprocessing of data
The data provided in the monitoring and calibration data sets have been preprocessed to facilitate reuse of the data. The raw data and the Python code used to perform the prepro-cessing are provided in thefloodX Raw Data, Metadata, and Preprocessing Codepackage.
The following transformations were applied to preprocess the data: consolidation of multiple data files, chronological sorting, reformatting of date, time, and null values, correc-tion of temporal offsets, removal of extreme and impossible values, and segmentation of data into a separate file for each experiment. In order to reach higher sampling rates for cer-tain sensors, images and videos2of the sensor displays were made and analysed with optical character recognition (OCR). To further enhance the usability of the data, the code is avail-able on GitHub3and will be continually adapted as new
ap-2floodX Data Logger Imagesand floodX Data Logger Videos
packages (Moy de Vitry et al., 2017b, c)
Table 2.Selection of high-quality experiments conducted, including the duration of the flooding, the total volume of water introduced in the system, and the experiment quality. The experiments are sorted by their total flood volume.
No. Duration Volume (m3) Description Lighting Experiment quality
29 00:09:50 3.5 small event night+infrared calibration
14 00:07:00 3.8 small event overcast monitoring
35 00:15:00 3.8 small, empty sewers, manhole cover on m2 overcast monitoring 16 00:05:00 4.0 small event, full sewers at start direct sun monitoring
30 00:05:15 4.2 small event night+flood light calibration
26 00:07:00 4.8 small event, full sewers at start evening sun calibration 17 00:06:00 5.0 two small events, full sewers at start direct sun monitoring
25 00:06:00 5.3 small event evening sun calibration
27 00:07:00 6.6 two small events evening sun calibration
15 00:07:00 7.0 two small events overcast; direct sun monitoring
34 00:20:00 12.8 multiple small, slow events overcast calibration
31 00:16:00 24.2 simple dam overflow with pre-impulse night+flood light calibration
18 00:15:00 25.3 simple dam overflow direct sun monitoring
21 00:17:00 26.5 simple dam overflow with pre-impulse direct sun monitoring
28 00:23:00 27.6 simple dam overflow evening sun calibration
23 00:19:00 31.4 slow event overcast; direct sun monitoring
33 00:20:40 32.2 large event followed by a small one overcast calibration 20 00:16:00 33.3 multiple large events overcast; direct sun monitoring 22 00:20:40 34.5 large event followed by a small one direct sun monitoring
19 00:15:00 44.9 multiple large events direct sun monitoring
32 00:22:00 64.1 multiple large events night+infrared calibration
plications for the data require it. Importantly, flood image and video data are not modified but provided as collected.
5 Data accuracy
5.1 Temporal accuracy
For a majority of the sensors, an offset in the time records was observed and was corrected for in the preprocessed data sets of this paper. However, the following sensor systems have a more complex temporal offset that is worth mention-ing.
5.1.1 Security cameras
The internal clocks of the cameras CAM1, CAM3, CAM4, and CAM5 displayed variable temporal offsets, whereas CAM2 was verified to be correctly synchronized. Because the camera recordings were started and stopped at the same moment in time (no more than a second), the relative mis-alignment of the camera’s internal clocks could be quantified by comparing the video file times of the recordings. Visual investigation of moments in the video material confirms the related misalignments. The offsets are provided in a text file of thefloodX Flooding Videospackage (Moy de Vitry et al., 2017e).
5.1.2 Overland flow sensors at channel c3 for water depth and velocity (c3_h_us_nivus and c3_v_radar_nivus)
A comparison of the video material from camera c3_ cam3_ instar with measurements from overland flow measurements from sensors c3_ h_us_nivus and c3_v_radar_nivus revealed a discrepancy in the time of the logger of these two devices. The logger time is consistently found to be between 5 and 16 s ahead of reference time. Given the logging frequency of 5 s of the Nivus PCM Pro logger used for c3_h_us_nivus and c3_ v_radar_nivus, it is assumed that the variability of the offset is largely due to sampling errors. A fixed offset of 12 s was assumed for preprocessing the data.
5.2 Sensor accuracy
5.2.1 Drift in ultrasonic water level measurements
662 M. Moy de Vitry et al.: floodX
Figure 3.Water level behind dam s3 measured by ultrasonic sensor s3_h_us_maxbotix. The measured level in absence of water can be seen varying over time. At 14:30 (rectangle to the right), the level is lower than at 13:00 (rectangle to the left).
5.2.2 Other characteristics and anomalies of the data
– s1_h_us_maxbotix_1: waves on the surface of the water can be seen in the signal. The amplitude of these waves increases as the water level in the reservoir decreases. The data were not modified to suppress the waves.
– c3_v_radar_nivus: in the absence of flow and when a person walked near the measurement location, this sen-sor produced flow estimations. When flow is present, the passage of people on the crossing does not appear to affect the measurement. The false measurements have been removed from the data sets.
– p1_q_mid_endress_logi: outliers can be found in the flow data logged by the webcam. These data values were read using optical character recognition from images of the flow meter display. Invariantly, there are errors in the interpretation, especially when the image was taken at the same moment at which the value was being updated on the display. The most critical outliers have been re-moved from the data but some remain.
– s6_h_us_maxbotix: a curious artefact is visible after flooding occurs in the basement (Fig. 4). For a few min-utes, the water level appears to be negative, before re-turning to normal. No corrective action was taken.
5.3 Data omitted from data sets
Over all experiments, the discharge measured by the ultra-sonic discharge sensor p6_q_us_nivus at the facility outlet deviates substantially from the discharge measured at the in-let of the flood facility in pipe p1. Different hypotheses to explain the volume differences were brought forward, such as residual water in the system and pipe leaks, but investiga-tion of the data and the facility plans led to the conclusion
Figure 4.Measured water level in basement s6 by ultrasonic sen-sor s6_h_us_maxbotix presents abnormally low values after flood-ing (negative water levels of up to−7 mm can be seen in the red rectangle).
Figure 5.Signs of leakage visible in the water level at manhole m2 (sensor m2_h_p_endress_minilog). The pipe network should not be able to drain but over the course of 2 h (starting at the red line) the water level in manhole m2 falls by around 1.7 m.
that such factors could not fully explain the discrepancy. The only remaining explanation is that the constrained measure-ment conditions, especially the short stabilization distance before and after the sensor, the presence of a valve at the end of the pipe, and the frequent regime changes between full and partially filled pipe, caused the measurement to be erroneous. This conclusion is corroborated by the discovery of artefacts in the discharge data. Since the volume differ-ences are larger than the expected measurement error for the technology (DWA, 2011), the data were judged to be of in-sufficient quality and were therefore removed from the data sets.
5.4 Incomplete control of facility infrastructure
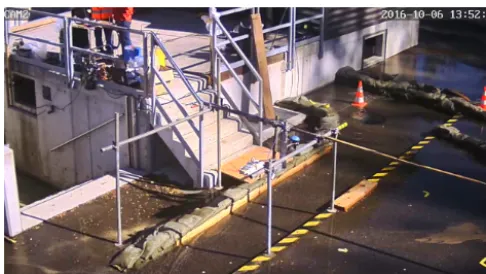
Figure 6.View from camera CAM2 in which channel c3 is visi-ble, as well as the scaffolding holding two radar-based flow mea-surement systems. The same channel is also visible from camera CAM3.
5.5 Gaps in the data
Equipment manipulation errors and data management issues led to a few gaps in the data. This has been observed for the Nivus radar system mounted in channel c3 in experiment 7, sensors m1_h_p_endress and m2_h_p_endress for exper-iments 14 to 23, and the temperature sensors in experiment 24. This information is also available in the experiment meta-data file.4
5.6 Discussion
The floodX experiments illustrated the importance of certain aspects of experimental design and execution. In our case, certain issues could have been avoided if the following points were given more attention:
– Synchronization of data loggers must be performed manually and at an appropriate temporal resolution.
– Environmental disturbances like wind and solar radia-tion, which can influence experiment execution and sen-sor performance, should be anticipated and planned for.
– Checklists should be used to ensure that equipment is functioning correctly before each experiment.
– Performance of data loggers can be as important as that of sensors, depending on the timescale of an experi-ment’s dynamics.
6 Potential applications of data sets
Monitoring data for historic urban pluvial floods is typically limited to the (underground) drainage network because most sensors are designed specifically for that setting. Overland flow and accumulation is of much more interest than the
4floodX Raw Data, Metadata, and Preprocessing Codepackage
Figure 7.View from camera CAM1 in which a bicycle is visible in the flood water behind the dam. Deep learning could make it pos-sible to automatically estimate the water level from such an image. An ultrasonic sensor above the water and a pressure sensor in man-hole m1 provide water level data.
drainage network when modelling urban pluvial floods, but the lack of suitable sensors means that flood hydrologists must often calibrate and validate their models with very lim-ited or partial information. The data collected in the floodX project will be used to develop and investigate both image-based flood monitoring methods and flood model calibration schemes that can assimilate non-standard overland flow data. The tools developed in these two lines of research are neces-sary for the long-term vision of utilizing social media images and surveillance videos from real flood events to obtain more reliable flood models.
A trove of overland flow information lies in existing surveillance infrastructure and social media in the form of images and videos. With appropriate processing methods, flow and water depth could be automatically estimated from these data, and the floodX data sets5provide an opportunity to research such methods. For example, the measurement of shallow overland flows with large-scale particle image ve-locimetry (LSPIV) could be investigated in channel c3 with the two cameras and two radar systems (Fig. 6). For the mo-ment, LSPIV has been investigated in urban settings only for large flows and without direct validation data (Guillén et al., 2017; Perks et al., 2016), or for seeded flows (Branisavlje-vi´c and Prodano(Branisavlje-vi´c, 2006). Another example is the use of deep learning to estimate flood water levels through seman-tic scene interpretation, e.g. by interpreting the immersion level of objects of known dimensions in snapshots and videos (Fig. 7).
The floodX data can also be used for urban pluvial flood model calibration research since the flood monitoring setup was contained within a hydraulic system comparable to an urban catchment. Thanks to this unique setup and the
sub-5floodX Preprocessed Monitoring Data, floodX Flooding
664 M. Moy de Vitry et al.: floodX
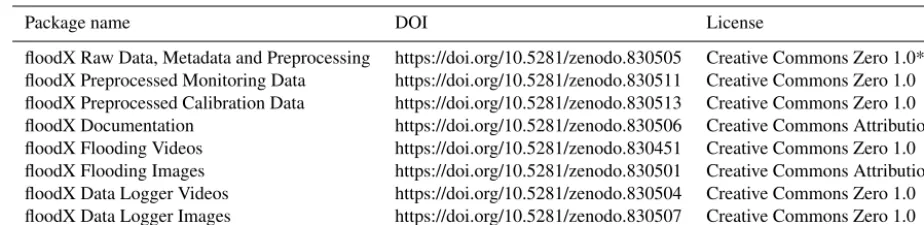
Table 3.Data packages associated with the floodX project.
Package name DOI License
floodX Raw Data, Metadata and Preprocessing https://doi.org/10.5281/zenodo.830505 Creative Commons Zero 1.0* floodX Preprocessed Monitoring Data https://doi.org/10.5281/zenodo.830511 Creative Commons Zero 1.0 floodX Preprocessed Calibration Data https://doi.org/10.5281/zenodo.830513 Creative Commons Zero 1.0 floodX Documentation https://doi.org/10.5281/zenodo.830506 Creative Commons Attribution floodX Flooding Videos https://doi.org/10.5281/zenodo.830451 Creative Commons Zero 1.0 floodX Flooding Images https://doi.org/10.5281/zenodo.830501 Creative Commons Attribution floodX Data Logger Videos https://doi.org/10.5281/zenodo.830504 Creative Commons Zero 1.0 floodX Data Logger Images https://doi.org/10.5281/zenodo.830507 Creative Commons Zero 1.0
* The preprocessing code included in this package is under the MIT license.
set of calibration-quality data,6 it will be possible to test model calibration concepts capable of assimilating the over-land flooding data delivered by the novel monitoring meth-ods. Specific questions that need to be addressed include the choice of appropriate objective functions and of an appropri-ate weighting strappropri-ategy for multiple objective functions.
In summary, the research made possible by the floodX data will both contribute to urban flood monitoring innovation and improve the reliability of urban flood modelling, thereby in-creasing the effectiveness of urban flood management ser-vices such as flood forecasting, response, and risk manage-ment.
7 Data availability
Eight data packages are provided through the Zenodo data repository as described below, in open-access and with lib-eral licences (see Table 3 for a summary). It is important to note that while the time series data have been preprocessed, the videos and images of the flooding are provided as is. A brief description of the data packages follows.
floodX Raw Data, Metadata, and Preprocessing Code
This package contains all collected data that is avail-able in a text format, as well as useful code for preprocessing data.
– metadata: this directory contains metadata for the sen-sors used, the data sources (sensor +location +data logger), flooding experiments and image files for opti-cal character recognition.
– data_raw: this directory contains the raw text format data, organized by sensor.
– code: this directory contains processing code for mak-ing the raw data more usable for visualization and mod-elling, including the code for interpreting sensor read-outs with OCR. The code is maintained in the
fol-6floodX Preprocessed Monitoring Data.
lowing repository: https://github.com/eaw-sww/floodx_ data_preprocessing.git.
– data_ocr_result: this directory contains data read from sensor display images using OCR.
floodX Preprocessed Monitoring Data
This package contains a preprocessed subset of the flooding experiments for which the data quality is appropriate for urban flood monitoring research. The package includes text-based data only – videos and images of flooding can be found in thefloodX Flooding Videos andfloodX Flooding Imagespackages, respectively.
floodX Preprocessed Calibration Data
This package contains a preprocessed subset of the flooding experiments for which the data quality is appropriate for urban flood model calibration and validation research. The package includes text-based data only – videos and images of flooding can be found in thefloodX Flooding Videosand floodX Flooding Imagespackages, respectively.
floodX Flooding Videos
This package contains archives of videos of the flood-ing taken with surveillance cameras. The videos are grouped by camera and by recording sessions.
floodX Flooding Images
This package contains pictures taken during the flood-ing experiments. The cameras used to take the pictures had shifted timestamps, so a text file provides the time shifts of the cameras to the reference times.
floodX Documentation
docu-menting the flood facility and the sensors that were used in the experiments.
– Facility construction plans (provided as is, without any guarantee for geometric accuracy).
– Plan of floodable area, including hydraulic components and sensors.
– Information regarding individual sensors and dimen-sions of hydraulic elements such as pipes and storage elements.
– Photos of the experimental layout.
floodX Data Logger Images
This package contains archives of pictures taken of sensor displays in order to record measurements at a higher frequency than certain data loggers allowed. The images for the pressure data is stored in multiple archive files that must be assembled during unpacking. The images are grouped together because sometimes the camera had to be moved between experiments, thereby changing the position of the display in the image. Each image group contains a settings file that indicates the location of the display(s) in the images of the group. With this information, the sensor reading can be automatically extracted from the images.
floodX Data Logger Videos
This package contains videos that constitute an alter-native to the data logger images. The videos provide high-quality readings of the logger displays, and values can be read more frequently. The image quality may be superior to that of the data logger images.
8 Conclusions
The flood experiments described in this paper stand out from similar urban flood experiments thanks to the relatively con-trolled conditions and the diversity of sensor systems in-volved. While not void of blemishes, the data generated in the floodX project hold significant potential to support ur-ban flooding research, especially for the exploration of al-ternative measurement strategies for the quantification of ur-ban flood phenomena. In particular, the published data sets constitute a valuable starting point for investigating large-scale particle image velocimetry in urban environments and computer-vision-based water level estimation. Indeed, the need for flood monitoring data has often been pointed out by researchers, and alternative data sources could be the key to providing such data. Additionally, thanks to the large number of experiments, the data sets provide a unique opportunity to explore methods for calibrating urban flood models with alternative data sources. In the face of climate change, the
potential improvements to urban flood monitoring and mod-elling expedited by these data will contribute to the integrity of urban infrastructure and the populations that rely on them.
The Supplement related to this article is available online at https://doi.org/10.5194/essd-9-657-2017-supplement.
Author contributions. Matthew Moy de Vitry was lead for the project design and execution, as well as for drafting the paper. Si-mon Dicht was the lead technician, responsible for the acquisition and installation of instrumentation. João P. Leitão was principal in-vestigator of the project, providing valuable support in the orienta-tion and coordinaorienta-tion of project execuorienta-tion and paper drafting. All authors were involved in reviewing the paper.
Competing interests. This project was financed by the Swiss National Science Foundation under grant #169630. The authors de-clare that they have no conflict of interest.
Acknowledgements. The authors wish to thank the handling editor and the three anonymous referees, whose detailed comments greatly improved the quality of this paper. The authors would like to thank the following people for their valuable counsel for conceptual design of the experiments: Tobias Doppler, Frank Blumensaat, Andreas Scheidegger, and Kris Villez. Additionally, great assistance was provided in execution of the experiments by Christian Ebi, Alex Hunziker, Lena Mutzner, Joerg Rieckermann, Andreas Scheidegger, Luis M. de Sousa, and Omar Wani. The project was made possible thanks to the cooperation of armasuisse and the training village facility managers Roland Rickli and Michael Gehriger. Furthermore, the authors thank Stebatec AG and Nivus AG for their collaboration in providing sensor equipment.
Edited by: David Carlson
Reviewed by: three anonymous referees
References
Branisavljevi´c, N. and Prodanovi´c, D.: Large Scale Particle Image Velocimetry – Measuring Urban Discharge, Vodoprivreda, 38, 233–238, available at: http://www.vodoprivreda.net/ large-scale-particle-image-velocimetry-merenje-urbanog-oticaja/ (last access: 18 March 2016), 2006.
Ciervo, F., Papa, M. N., Medina, V., and Bateman, A.: Simula-tion of flash floods in ungauged basins using post-event surveys and numerical modelling, J. Flood Risk Manag., 8, 343–355, https://doi.org/10.1111/jfr3.12103, 2015.
Dottori, F. and Todini, E.: Testing a simple 2D hydraulic model in an urban flood experiment, Hydrol. Process., 27, 1301–1320, https://doi.org/10.1002/hyp.9370, 2013.
666 M. Moy de Vitry et al.: floodX
improving stage–discharge curves, J. Hydro-Environment Res., 5, 301–312, https://doi.org/10.1016/j.jher.2010.12.005, 2011. DWA: Merkblatt DWA-M 181 Messung von Wasserstand und
Durchfluss in Entwässerungssystemen, DWA Deutsche Vereini-gung für Wasserwirtschaft, Abwasser und Abfall e. V., 2011. Evans, E., Ashley, R., Saul, A., Sayers, P., Thorne, C., and
Watkinson, A.: Foresight Future Flooding – Executive Summary, available at: http://www.bis.gov.uk/foresight/our-work/projects/ published-projects/flood-and-coastal-defence (last access: 25 January 2017), 2004.
Fewtrell, T. J., Duncan, A., Sampson, C. C., Neal, J. C., and Bates, P. D.: Benchmarking urban flood models of vary-ing complexity and scale usvary-ing high resolution terrestrial Li-DAR data, Phys. Chem. Earth, Parts A/B/C, 36, 281–291, https://doi.org/10.1016/j.pce.2010.12.011, 2011.
Fraga, I., Cea, L., and Puertas, J.: Validation of a 1D-2D dual drainage model under unsteady part-full and sur-charged sewer conditions, Urban Water J., 14, 74–84, https://doi.org/10.1080/1573062X.2015.1057180, 2015. Guillén, N. F., Patalano, A., García, C. M., and Bertoni, J. C.: Use of
LSPIV in assessing urban flash flood vulnerability, Nat. Hazards, 87, 383–394, https://doi.org/10.1007/s11069-017-2768-8, 2017. Hakiel, J. and Szydłowski, M.: Interaction between storm water conduit flow and overland flow for Numerical modelling of urban area inundation, in: GeoPlanet: Earth and Planetary Sciences, vol. none, edited by: Rowi´nski, P. M. and Marion, A., Springer International Publishing, 23–34, 2016.
Hénonin, J., Hongtao, M., Zheng-Yu, Y., Hartnack, J., Havnø, K., Gourbesville, P., and Mark, O.: Citywide multi-grid urban flood modelling: the July 2012 flood in Beijing, Urban Water J., 12, 52–66, https://doi.org/10.1080/1573062X.2013.851710, 2015. Hunter, N. M., Bates, P. D., Neelz, S., Pender, G., Villanueva, I.,
Wright, N. G., Liang, D., Falconer, R. A., Lin, B., Waller, S., Crossley, A. J., and Mason, D. C.: Benchmarking 2D hydraulic models for urban flooding, Proc. Inst. Civ. Eng.-Water Manag., 161, 13–30, https://doi.org/10.1680/wama.2008.161.1.13, 2008. Leandro, J., Djordjevi´c, S., Chen, A. S., Savi´c, D. A., and Stani´c, M.: Calibration of a 1D/1D urban flood model using 1D/2D model results in the absence of field data, Water Sci. Technol., 64, 1016–1024, https://doi.org/10.2166/wst.2011.467, 2011. Le Boursicaud, R., Pénard, L., Hauet, A., Thollet, F., and
Le Coz, J.: Gauging extreme floods on YouTube: applica-tion of LSPIV to home movies for the post-event determi-nation of stream discharges, Hydrol. Process., 30, 90–105, https://doi.org/10.1002/hyp.10532, 2016.
Le Coz, J., Patalano, A., Collins, D., Guillén, N. F., García, C. M., Smart, G. M., Bind, J., Chiaverini, A., Le Boursicaud, R., Dramais, G., and Braud, I.: Crowdsourced data for flood hy-drology: Feedback from recent citizen science projects in Ar-gentina, France and New Zealand, J. Hydrol., 541, 766–777, https://doi.org/10.1016/j.jhydrol.2016.07.036, 2016.
Moy de Vitry, M., Dicht, S., and Leitao, J.: floodX Documentation, Zenodo, https://doi.org/10.5281/zenodo.830506, 2017a. Moy de Vitry, M., Dicht, S., and Leitao, J.: floodX Data Logger
Images, Zenodo, https://doi.org/10.5281/zenodo.830507, 2017b. Moy de Vitry, M., Dicht, S., and Leitao, J.: floodX Data Logger Videos, Zenodo, https://doi.org/10.5281/zenodo.830504, 2017c. Moy de Vitry, M., Dicht, S., and Leitao, J.: floodX Flooding Images,
Zenodo, https://doi.org/10.5281/zenodo.830501, 2017d. Moy de Vitry, M., Dicht, S., and Leitao, J.: floodX Flooding Videos,
Zenodo, https://doi.org/10.5281/zenodo.830451, 2017e. Moy de Vitry, M., Dicht, S., and Leitao, J.:
floodX Preprocessed Calibration Data, Zenodo, https://doi.org/10.5281/zenodo.830513, 2017f.
Moy de Vitry, M., Dicht, S., and Leitao, J.: floodX Preprocessed Monitoring Data, Zenodo, https://doi.org/10.5281/zenodo.830511, 2017g.
Moy de Vitry, M., Dicht, S., and Leitao, J.: floodX Raw Data, Metadata, and Preprocessing Code, Zenodo, https://doi.org/10.5281/zenodo.830505, 2017h.
Perks, M. T., Russell, A. J., and Large, A. R. G.: Technical Note: Advances in flash flood monitoring using unmanned aerial vehicles (UAVs), Hydrol. Earth Syst. Sci., 20, 4005–4015, https://doi.org/10.5194/hess-20-4005-2016, 2016.
Raso, L. and Malaterre, P. O.: Combining Short-Term and Long-Term Reservoir Operation Using Infinite Horizon Model Predictive Control, J. Irrig. Drain. E.-ASCE, 143, 1–7, https://doi.org/10.1061/(ASCE)IR.1943-4774.0001063, 2016. Sampson, C. C., Fewtrell, T. J., Duncan, A., Shaad, K., Horritt, M.
S., and Bates, P. D.: Use of terrestrial laser scanning data to drive decimetric resolution urban inundation models, Adv. Water Re-sour., 41, 1–17, https://doi.org/10.1016/j.advwatres.2012.02.010, 2012.
Schmitt, T. G., Thomas, M., and Ettrich, N.: Analysis and modeling of flooding in urban drainage systems, J. Hydrol., 299, 300–311, https://doi.org/10.1016/j.jhydrol.2004.08.012, 2004.