R E S E A R C H
Open Access
Control of cortical oscillatory frequency by
a closed-loop system
Mattia D
’
Andola
1†, Massimiliano Giulioni
2†, Vittorio Dante
2, Paolo Del Giudice
2and Maria V. Sanchez-Vives
1,3*Abstract
Background:We present a closed-loop system able to control the frequency of slow oscillations (SO) spontaneously generated by the cortical network in vitro. The frequency of SO can be controlled by direct current (DC) electric fields within a certain range. Here we set out to design a system that would be able to autonomously bring the emergent oscillatory activity to a target frequency determined by the experimenter.
Methods:The cortical activity was recorded through an electrode and was analyzed online. Once a target frequency was set, the frequency of the slow oscillation was steered through the injection of DC of variable intensity that generated electric fields of proportional amplitudes in the brain slice. To achieve such closed-loop control, we designed a custom programmable stimulator ensuring low noise and accurate tuning over low current levels. For data recording and analysis, we relied on commercial acquisition and software tools.
Results:The result is a flexible and reliable system that ensures control over SO frequency in vitro. The system guarantees artifact removal, minimal gaps in data acquisition and robustness in spite of slice heterogeneity.
Conclusions:Our tool opens new possibilities for the investigation of dynamics of cortical slow oscillations—an activity pattern that is associated with cognitive processes such as memory consolidation, and that is altered in several
neurological conditions—and also for potential applications of this technology.
Keywords:Stimulation, Cortex, In vitro, Real-time, Slow oscillations, Emergent properties, Direct current stimulation, Brain stimulation
Background
The control of brain activity to restore function ideally requires the recording, or reading, of such activity, its online analysis and the correct stimulation/inhibition to achieve a target, which is a desired activity pattern. If this is done with periodicity, the system is defined as a closed loop. In order to gain control over the modulated parameters in electrophysiology, neuroscientists have employed closed-loop systems at different levels ranging from single-cell to network levels. At the single-cell level, notable examples are the voltage-clamp technique used in 1952 by Hodgkin and Huxley to design their model [1], or the dynamical-clamp technique introduced in 1993 by Sharp and colleagues to add in-silico
conductances to the biological ones [2]. More recently, at the network level, different groups have demonstrated their ability to control the bursting frequency in in-vitro preparations [3,4], and Jackson and colleagues were able to induce plasticity in the motor cortex during an in-vivo experiment thanks to an implantable closed-loop device [5]. Furthermore, a closed-loop system using al-ternating current (AC) stimulation of the human tem-poral cortex has been recently found to be useful for improving episodic memory [6] (for a review see [7]).
In the realm of clinical applications, even though some brain stimulation procedures, such as deep brain stimu-lation in Parkinson’s disease [8], have been well estab-lished for over two decades, the use of closed-loop systems associated with deep brain stimulation is recent and still experimental [9] despite their advantages [10]. In order to advance the design and use of closed-loop systems for the control of brain activity, in the current study we designed and tested a closed-loop system that * Correspondence:[email protected]
†Mattia D’Andola and Massimiliano Giulioni contributed equally to this work.
1Systems Neuroscience, IDIBAPS, Rosselló 149-153, Barcelona 08036, Spain 3ICREA, Passeig de Lluís Companys, 23, Barcelona 08010, Spain
Full list of author information is available at the end of the article
controls the frequency of cortical slow oscillations (SO) by means of direct current (DC) stimulation of the cor-tical network, and we demonstrate that it is a flexible and reliable system.
SO are the dominant activity pattern of the cerebral cortex spontaneously emerging in various states, includ-ing slow-wave sleep, deep anesthesia, and in some brain areas after lesions (e.g., cortical islands). SO also emerge spontaneously in acute cortical slices in vitro in the ab-sence of any pharmacological or electrical stimulation [11,12]. The tendency for the cortical network to gener-ate SO has prompted the suggestion that this activity is indeed the default activity pattern of the cortex [13] (reviewed in [14]). Furthermore, it is well established that SO during slow-wave sleep are associated with con-solidation of information, and with enhanced memory and cognitive performance [15, 16] (reviewed in [17]). SO alternate at a frequency of≤1 Hz between active and silent periods of neuronal activity [18], also referred to as Up and Down states, respectively. The neuronal firing of both excitatory and inhibitory neurons, which are linked by recurrent connections, results in reverberant or persistent activity during Up states. During Up states there is synchronization in beta (15–30 Hz) and gamma (30–90 Hz) frequencies, similar to what can be observed during wakefulness [12,19]. These frequency bands dur-ing wakefulness have been associated with cognitive pro-cesses, short-term and working memory [20,21], as well as with attention and arousal levels [22–25].
Interestingly, SO in in-vitro cortical slices [11, 12] can be modulated by DC stimulation. This is particularly relevant given that transcranial direct current stimula-tion (tDCS) has acquired a lot of attenstimula-tion in the past few years but, in spite of the extended use of tDCS, the network and cellular mechanisms underlying cortical DC stimulation are only partially known [26–28]. Appli-cation of DC electric fields parallel to the polarization direction of pyramidal neurons (i.e., perpendicular to the cortex layers) to act on the cortical activity modulates many network parameters characterizing SO, such as the frequency: the logarithm of the SO frequency varies linearly with the intensity and the polarity of the stimu-lation [28]. This effect is due to an elongation or short-ening of the Down state duration due to hyperpolarizing or depolarizing fields, respectively, while Up state dur-ation stays constant across stimuldur-ation levels.
Here we envisioned a closed-loop system that controls SO frequency in the cerebral cortex network in vitro as a proof of concept of the possibility to control this activ-ity in vivo, eventually with therapeutic applications. This system is autonomous, able to stabilize the SO fre-quency, robust across time and flexible, as the intensity of the network response to the stimulation varies across slices [28]. In the following sections we present our
closed-loop system as a proof of concept: it allows us to follow and to control the time evolution of the biological activity by controlling the injected current. Our closed-loop system is based on a commercial low-noise acquisition tool, a standard non-real-time PC, and a cus-tom reprogrammable DC stimulator. An abstract of this article was previously published in a conference pro-ceedings [29].
Methods
The aim of this study was to design a flexible and reli-able compact closed-loop system reli-able to control the fre-quency of SO spontaneously generated by the cortical network in vitro. For this, we designed an experimental protocol consisting of two main parts: an open-loop part, for response characterization of the cortical net-work response; and a closed-loop part, where the bio-logical activity was steered towards the desired SO frequency (seeExperimental protocolbelow).
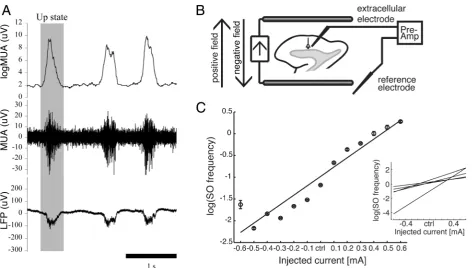
Setup
Our setup was a loop composed of four main elements (Fig.1): a cortical slice, a recording system, a PC for data analysis and a stimulator. Such a loop allowed us to con-tinuously monitor the slow cortical oscillations, to com-pute their frequency (v) on-line and to adjust the stimulation current (I) to increase or decreasev.
update, and to maintain a low noise level, we designed a custom stimulator.
In the following sections we provide a detailed descrip-tion of the various parts composing the setup.
Slice preparation and experimental conditions
Ferrets were cared for and treated in accordance with Spanish regulatory laws (BOE-A-2013-6271), which comply with the European Union guidelines on protec-tion of vertebrates used for experimentaprotec-tion (Directive 2010/63/EU of the European Parliament and of the Council of 22 September 2010). All experiments were approved by the Ethics Committee of the Hospital Clinic (Barcelona, Spain).
Slice preparation and solution composition are de-scribed in detail in Sanchez-Vives [36]. In brief: ferrets (4– 6 months old, either sex) were anesthetized with sodium pentobarbital (40 mg/kg) and decapitated. Then the entire forebrain was rapidly removed and placed into oxygenated cold (4–10 °C) bathing medium and 400-μm-thick coronal slices from visual cortex (areas 17, 18 and 19) were ob-tained. Tissue viability was increased during preparation by modification of the sucrose-substitution technique [37]. The slices were then placed into an interface style
recording chamber (Fine Science, Foster City, CA) where the slices were superfused for 1–2 h with a continuous so-lution flow (2–4 ml/min); the artificial cerebrospinal fluid (ACSF) contained (in mM): NaCl, 126; KCl, 2.5; MgSO4,
2; Na2HPO4, 1; CaCl2, 2; NaHCO3, 26; dextrose, 10; and
was aerated with 95% O2, 5% CO2 to a final pH of 7.4.
Then, a modified ACSF simulating ionic values in vivo (as described in [11,36]), was used throughout the rest of the experiment, which had the same ionic composition except for different levels of the following (in mM): KCl, 4; MgSO4, 1; and CaCl2, 1. Bath temperature was maintained
at 34–36 °C. Throughout the experiment the temperature was maintained at 34–36 °C.
Electrophysiological recordings
The extracellular LFP was recorded from deep cortical layers with a 2–5 MΩ tungsten electrode (FHC, Bow-doinham, ME) and was amplified by 1000 by a Neurolog System (Digitimer, Letchworth, UK). The reference elec-trode, a Ag-AgCl wire, was placed in the bath. The amp-lified signal was digitized at 5 kHz by a CED instrument (Power1401 ADC/DAC, Cambridge Electronic Design, Cambridge, UK) and streamed to the PC.
Slow oscillation identification and analysis
As mentioned in the introduction, SO are characterized by the alternation of active and silent periods, namely Up and Down states. During Up states, the increase in the spiking activity of single neurons increases multiunit activity (MUA) levels. A method to estimate MUA has already been described [28, 38]: in brief, the power spectrum of the population firing rate has Fourier com-ponents proportional to the firing rate itself [39]. Thus the components of the LFP between 0.2 kHz and 1.5 kHz can be seen as a linear transform of spiking activity [40], so that power changes in the Fourier components at those frequencies provide a reliable estimation of the population firing rate.
For an online estimation of MUA, we applied a DC-removal filter with a rectangular window of 10 ms (roughly corresponding to a high-pass filter with cut-off frequency at 100 Hz) and a second online moving-average filter with a rectangular window of 0.6 ms (roughly corre-sponding to a low pass filter with a cut-off frequency at 1700 Hz) to traces from LFP waveforms recorded during closed-loop stimulation (Fig. 2a). We then rectified the
signal and applied another moving-average filter with a longer time-window of 80 ms to obtain MUA traces, simi-lar to the ones obtained offline in [28, 38] (Fig. 2a). Up-ward and downUp-ward transitions — that is, from a Down state to an Up state, respectively, and vice versa— were detected by setting time and amplitude thresholds in the MUA traces. In order to obtain a better automatic recog-nition of the Up/Down cycles, the frequency cutoff of the bandpass filter for the MUA estimation was adjusted to [0.1 1.7] kHz on an empirical basis, with respect to the one reported in [40].
The detection procedure just described was performed by our Spike2 scripts which analyzed data online, de-tected the Up states and computed their onset frequency (i.e., the SO frequency) over a window of variable dur-ation (see below). Up state onsets were identified as an increase in the MUA crossing a given threshold and last-ing more than 200 ms. The threshold could be automat-ically adjusted by the software at a specific percentage of the amplitude of the MUA during Up states with respect to the baseline activity. At the same time it was also pos-sible to adjust it manually at any moment of the
Fig. 2Sample recording traces, stimulation configuration and SO frequency behavior across injected DC currents.aSample recording (3 s). Bottom row, raw LFP trace; middle and top rows, the MUA and MUA waveforms, respectively, obtained with online filtering of the LFP. Up states (gray shade) were automatically recognized through the use of amplitude and time thresholds in the MUA traces.bScheme of electrode stimulation setup. Electric fields were directed parallel to the polarization direction of pyramidal neurons.cTypical distribution of SO frequency across injected currents for one of the recorded slices (mean ± SD). For each stimulation current (xaxis), all the measured values of the slow oscillation frequency obtained during the stimulation interval at that specific intensity were averaged (58 values). The logarithm of the SO frequency monotonically increases with the applied DC currents. The linear fit is superimposed [28] (p-value = 3.9182 × 10⁻⁷). The variability of the
recording. In the set of recordings that we will show, the threshold was either automatically set or manually ad-justed throughout the experimental trials.
Every second the software compared the chosen target frequency ðv) with the measured one (v) and increased or decreased the stimulation level by a certain current step (Istep). The software acted as a proportional controller, such
that the farther the signal was from the target the larger the current step was. Whenjv−vj≤10%of v, we considered the target had been reached and we did not modify the stimula-tion current. To avoid permanent damages to the slice we also enforced a maximum absolute value for the stimulation current of 650μA. Current intensity ranges were chosen on the basis of previous observations [28] (see below).
To reduce false positives, the software detected and re-moved artifacts on the MUA channel before performing the analysis of the Up state onsets. Artifacts in the re-cordings derived from a sudden change of the voltage potential in the recording site caused by stimulus up-dates or by environmental interferences. Fast oscillations of the signal, creating a V-shaped peak of at least 30μV height, were recognized by the system as artifacts. Apart from the real-time analysis, the software also ensured the execution of an entire experimental protocol involv-ing different phases (see below).
Stimulation
Stimulation was effected by a custom-made stimulator com-posed of an injection module, an Atmel microcontroller and
a Bluetooth communication module. Wireless commu-nication and battery powering were chosen primarily to get rid of ground loops that can arise in closed-loop systems that include multiple devices. In this way, and with additional measures including suited ground con-nections, we eliminated noise due to power lines, radio mobile signals and so on.
The microcontroller was in charge of managing wire-less communication, DACs employed to set stimulation currents, and triggers for artifact removal.
The stimulator offers a command-line COM-based user interface for easy programming and provides four stimulation channels, independently settable. In the experiments reported in this work we used a single channel.
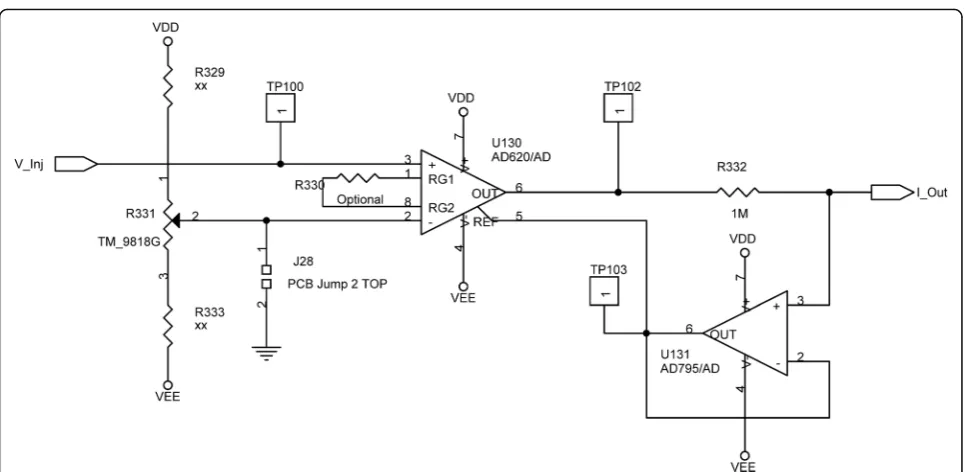
The current injector is basically a voltage-current con-verter and is illustrated in the diagram in Fig.3. The in-strumental amplifier and op-amp implement a feedback circuit that keep the voltage across the resistor R332 at the V_Inj value, which in turn determines the current
I_Outto be injected.
Lab tests on the current injector confirmed linearity of the relationship between set and injected currents, up to clipping conditions that depend on the load impedance; such tests allowed us to easily assess whether the stimu-lation current is reliable by checking that, for the set current, the applied voltage is below the clipping value (about 8 V). All measurements were remarkably stable over time. For our injector, output noise can be safely
Fig. 3Diagram of the stimulator. Input voltage is applied at Vinj, output current flows between IOutand Gnd. The leftmost resistor branch ensures
estimated to be very small (3.3μV peak-to-peak), based on the components data sheet and circuit schematics.
The circuit guarantees a linear relationship between the input voltage V_Injand the injected current I_Outas long
as the output voltage of the instrumental amplifier is below the clipping values VDD or VEE. We remark that the maximum injected current will obviously depend on the load downstream I_Out. The injected current will be
positive (negative) for positive (negative) V_Inj. The
avail-ability of the test points TP102 and TP103 allowed us to check the V_Inj - I_Out ratio in situations where load
in-crease and clipping conditions could be expected.
Every second the software instructed the stimulator to inject current into the cortical slice [26,28,41] through two parallel customized silver-chloride wires (1 mm diameter, 10 mm length) placed 5–8 mm apart (depend-ing on the slice size), such that the electric field was ori-ented parallel to the apical-dendritic axis of cortical pyramidal cells (Fig. 2b). Positive fields are fields that depolarize the pyramidal neurons, oriented from the white matter to the cortical surface, while negative fields are oriented in the opposite direction, inducing hyperpo-larization of pyramidal neurons. Homogeneity of the electric fields generated by the electrodes was tested in a separate study with a systematic voltage measure across the recording area.
Upon the arrival of a new command, the outputs were updated within a few microseconds and a digital trigger was activated on an optically decoupled dedicated
channel. We connected this output to the CED instru-ment to mark current updates.
For the present work we used one single stimulation channel, we configured the stimulator to have reliable currents in the range−1 mA to 1 mA settable with 100 nA accuracy for output load resistances in the order of few kOhms.
The intensity for the applied current was kept in the range [0 ± 0.65] mA. According to what has been previ-ously observed [28, 41], in an interface chamber, where slices are bathed with the ACSF described before, elec-tric fields were generated in the range 1–6 V/m. Current intensity and electric field intensity are usually linearly correlated in this range. This measure is not appreciably modified, neither by the presence of the slice nor by the recording electrodes [41]. As our custom stimulator in-jects current, we present here the effects on the cortical activity provoked by the stimulation by showing the amount of applied current instead of the obtained elec-tric field intensity.
Some of the limitations of the present version of the stimulator will be overcome in an improved version (already designed) providing more channels, wider volt-age range, optically decoupled input and output triggers, and embedded monitoring of V/I ratio.
Experimental protocol
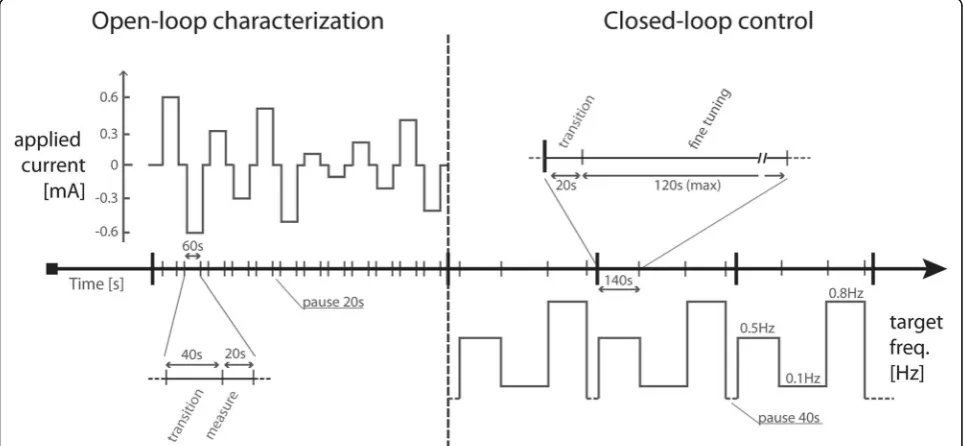
The experimental protocol consisted of two main parts (Fig.4): an open-loop part, for response characterization
of the cortical network response, and a closed-loop part, where the biological activity was steered towards the de-sired SO frequency.
During the open-loop characterization (Fig.4, left) we stimulated the slice with a series of six different random-ized current levels in the range [0.1 0.65] mA, injecting for each level first positive current and then negative current, and measuring the corresponding obtained SO frequency. Each current level was maintained for 60 s and in between the stimulation periods we introduced pauses of 20 s. For the entire open-loop characterization, we fixed the duration of the window for SO frequency evaluation at 20 s; hence, to measure the activity we waited 40 s after the current update. Data obtained from this phase were collected in a current-vs-frequency graph (Fig. 2c), which characterized the slice being tested. For each stimulation current, we averaged all the measured values of the slow oscillation frequency ob-tained during the stimulation interval at that specific in-tensity (58 values). Every slice responded differently to the stimulation (see inset in Fig.2c), as previously dem-onstrated [28]. Duration of Up and Down states in the spontaneous activity determined reactivity of the net-work to the applied electric fields.
In the second part of the protocol we activated the closed-loop control: it autonomously adjusted the current to steer the slice activity towards the desired targets. We chose three target values: 0.5, 0.1 and 0.8 Hz. For each slice we repeated three times the sequence of the three targets (Fig.4, right). The duration of the measuring win-dow was adjusted according to the target values such that, on average, ten Up states would be included in every measure. We also imposed a maximum limit of 40 s for the window duration. Thus, when the target was 0.8 Hz the measuring windows lasted 12.5 s, for 0.5 Hz we used a 20 s window and for 0.1 Hz a 40 s one. The closed-loop took advantage of the open-loop characterization made specifically for each slice by using, as a first guess for the current, a value obtained from the characterization data. As in the open-loop characterization, there was a“ transi-tion”phase before the start of data acquisition soon after the first estimated current was applied. After the transi-tion phase, a fine-tuning closed-loop phase took place. The maximum duration of such a phase was set to 120 s. In case the target was reached, the system tried to main-tain it for the following 40 s before passing on to the next target value.
During the initial experimental trials we tested 15 slices using different versions of the protocol, observing trends of the SO frequency modulation and optimizing the system and the experimental protocol. Although we faced some experimental issues, those initial tests pro-vided valuable results that we discuss in the next section. After the test and troubleshooting phase was over, we
applied the final stimulation protocol on 5 slices. The re-sults presented in the following session refer to these 5 cases.
Results
Reaching the target frequencies
Cortical slices spontaneously engaged in the generation of the typical pattern of slow (< 1 Hz) oscillatory activity that has been proposed to be the default emergent activ-ity of the cortical network [13, 14]. In a previous study [28] we demonstrated that the frequency of SO could be modulated in vitro by means of DC electric fields. In particular, positive (depolarizing) fields increased the SO frequency, while negative (hyperpolarizing) fields de-creased it. Such modulation was proportional to the in-tensity of electric fields on a logarithmic scale. We aimed then to construct a closed-loop system (Fig. 1) able to steer the SO frequency toward specific targets, by stimulating the slices with DC current, as a proof of concept that the frequency of cortical SO can be con-trolled online at will.
Throughout the run, the closed-loop system tuned the current amplitude to induce the desired slice activity. In Fig. 2a we report 3 s of recording obtained with a fixed stimulation intensity of 0.3 mA. In this case the SO fre-quency of the slice being tested was about 1 Hz. Up states lasted 0.22 s on average (range [0.19 0.28] s, vari-ance 0.0019 s), and their duration did not vary with the stimulation amplitude [28]. On the contrary, the dur-ation of the Down states was finely modulated by the electric fields, decreasing for positive fields and increas-ing for negative fields. Therefore, in this example, the duration of Down states decreased by raising the stimu-lation level. For this particular slice the mean SO fre-quency in the absence of stimulation was 0.44 Hz.
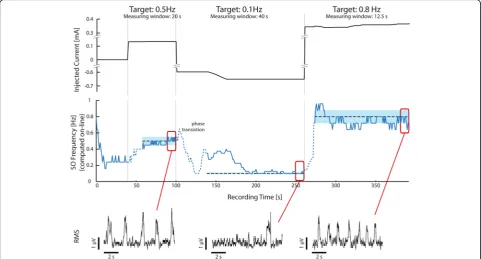
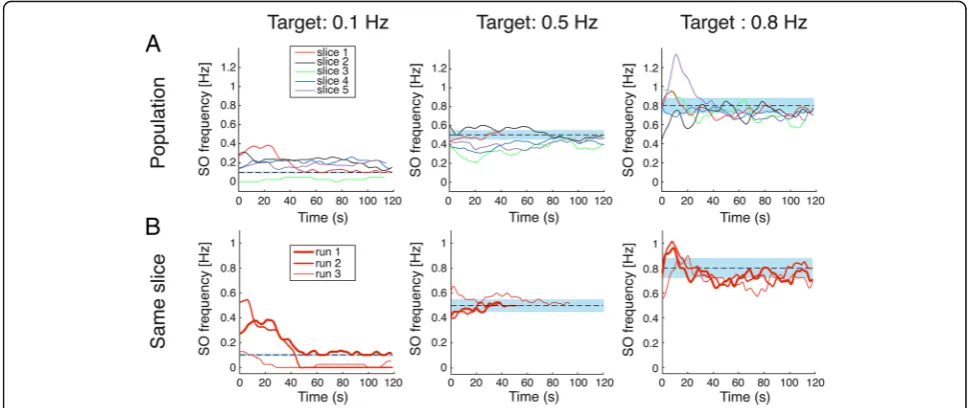
To validate our closed-loop system we tested the final protocol (Fig.4) in 5 cortical slices. Previous results [28] demonstrated that the intensity of the cortical response to the DC stimulation varies across slices. Thus, for each slice, an open-loop characterization was performed through the application of DC stimulation at random-ized intensities for periods of 60 s. The recorded re-sponses were rapidly fitted (Fig. 2c) in order to be able to make a proper guess on the stimulation intensity to be applied for each of the 3 closed-loop targets that we imposed (0.5 Hz, 0.1 Hz and 0.8 Hz). In all cases the closed-loop DC stimulation succeeded to steer the SO frequency to the desired target.
long as the measuring window set for that target (see Methods), a fine tuning was started to bring and keep the SO frequency inside the tolerance range around the target. For the first target (0.5 Hz), the system made an estimation of the necessary current injection that was right and a short-lasting fine-tuning phase was neces-sary. For the second target (0.1 Hz), the initial guess for current injection was not enough to reach the target, and the network went into a frequency of oscillation of ca. 0.38 Hz. Then, the closed-loop acted to progressively reduce the stimulation current, achieving a stable fre-quency of oscillation around 0.1 Hz. For the third target (0.8 Hz), the current kept increasing trying to compen-sate for a too-low SO frequency. In this last case, even though we did not reach a final stable equilibrium, we kept the slice activity close to the desired target. The closed-loop continuously measured the activity and fine-tuned the stimulation, thus allowing both for the correction of imprecise current guesses and for slice ac-tivity stabilization over long time periods. We also report the MUA traces during the last 10 s of every phase (Fig. 5, bottom). We remark here that the duration of the window used to measure the SO frequency varied accordingly to the target frequency: it was set to 20 s
when the target was 0.5 Hz, to 40 s for 0.1 Hz and 12.5 s for 0.8 Hz (seeMethodsfor details).
Flexibility of the system and consistency of the network response
As mentioned before, different slices responded with dif-ferent intensity to DC stimulation, in a manner strongly dependent on the initial activity [28]. DC fields act on the activity produced by the local network during the Down state, increasing or decreasing the firing rate (with de-polarizing or hyperde-polarizing fields, respectively) and changing the probability of the production of the follow-ing Up state [28]. Networks with high initial excitability (higher SO frequency) have small room for modulation at the intensities that we tested, thus hardly showing a strong response to the stimulation [28]. The closed-loop is an ideal setup to keep networks with such a heterogeneous behavior under control (Fig. 6a). In order to make the plots easier to read, the frequency patterns were smoothed by a cubic spline (Matlab‘csaps’function) with a smooth-ing parameter of 0.5, resampled at 100 Hz, and color-coded to illustrate the response of the different slices. Only the fine-tuning phase is illustrated in Fig.6.
Independently from the departing frequency, the com-bination of current guessing and fine-tuning allowed the system to bring the oscillations close to the desired fre-quency. For the target 0.1 Hz, across all slices the mean SO frequency in the last 10 s of each run was 0.19 ± 0.1 Hz (mean ± SD), thus with an average deviation from the target of 0.09 Hz. For the targets 0.5 Hz and 0.8 Hz, the average SO frequency in the last 10 s was respect-ively 0.43 ± 0.06 Hz (deviation from target 0.07 Hz) and 0.75 ± 0.04 (deviation from target 0.05 Hz). In some cases, the frequency did not reach the target in the max-imum time imposed by our protocol (120 s). The slope of the patterns, particularly for the targets 0.5 Hz and 0.8 Hz, suggests that the frequency would have reached the target over time. The same cannot be said for the 0.1 Hz target, where many times the reached frequency was strongly decreased to a value between 0 and 0.2 Hz but, within the time and current amplitude constrains that we imposed, it instead remained constant without reaching exactly 0.1 Hz. The 120 s limit derives from the experimental need not to “stress” the slice for too long to avoid deterioration of the network, and from the elec-trochemical degradation of the stimulation electrodes when high currents are applied for very long periods. When comparing the slice response among reiterations of the protocol, we often observed differences among repetitions of the same target-reaching phase (Fig. 6b). Differences are evident both in the departing points and
in the time-evolution of the oscillatory patterns. In the illustrative case in Fig. 6b, when the target was 0.1 Hz (left column) the slices responded similarly to the first current guess twice (run 1 and run 2), while the follow-ing evolution of the SO pattern was different across the two cases (target reached only in the first runs). In the third run, in contrast, the slice response was completely different even at the first stimulation guess. For the 0.5 Hz target, the response was short and very similar twice (run 1 and run 2), while during the third run a longer fine-tuning phase was needed to reach the target. Fi-nally, three very similar responses were observed when the target was 0.8 Hz, as probably there was little room for activity variations at such oscillation frequency, when the applied current was so high. These heteroge-neities in the response could probably be related to some fatigue effects, to the intrinsic variability of the slice activity, or to some other environmental effects such as electrode oxidation or some unavoidable slight changes in temperature or solution flow. Nevertheless, the closed-loop system was able to steer the activity to-wards the desired target. Among all the recordings, when the target was set to 0.1 Hz, the activity often stabilized at a lower level (Fig.6): at such low frequen-cies, a much longer time period would probably be necessary to evaluate whether the observed behavior was actually an incorrect stable equilibrium or a long-lasting undershoot.
System stability
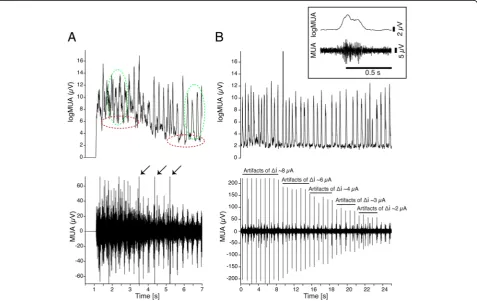
To obtain the control level described above, the first issue we encountered in this system involved artifacts in the recordings due to the current intensity update: every change in the current applied to the slices created an artifact in the recordings consisting of oscillations in the LFP signal baseline that caused the saturation of the ac-quisition system for several seconds. Our custom stimu-lator was designed paying particular attention to avoid the generation of undesired artifacts whose amplitude was reduced with respect to those observed in the same setup and preparation with commercial stimulators. With the custom stimulator, this kind of artifact was re-duced so that the artifacts appeared as small spikes in the MUA traces (Fig.7a and b, bottom), with the ampli-tude depending on the current step (Fig. 7b, bottom) while the duration was short enough to be able to be automatically distinguished from the Up states, which lasted at least 100 ms (Fig. 7b, top inset). Furthermore, thanks to the digital trigger sent back to the recording system, we were able to know precisely the moment in
which the current was changed. This allowed us to re-move online the majority of the artifacts from the fil-tered MUA traces (Fig. 7a and b, top). We note here that the commonly used artifact removal techniques consisting in disconnecting the pre-amplifiers for a short time-period around the stimulation is not useful in our context where we never detach the stimulation but instead keep adjusting its level.
Interestingly, the short artifacts generated by the current injection seemed to have no effect on the emer-ging activity of the network, either when they occurred during Down states or during Up states. We did not ob-serve any network responses to the artifacts, as they just appeared in the recording trace and were mainly due to the non-infinite CMRR (common-mode-rejection-ratio) of the differential pre-amplifier. We also noted that the Up and Down states amplitude in the frequency range considered for the MUA traces remained unchanged across different amplitudes of artifacts (Fig.7b, top).
Since the artifact amplitudes were proportional to the stimulation change, when the current step was large
enough there was still a short period in which the signal went out of scale (see Fig. 7a for a representative case). Stimulation aligned at t= 0, and activity returned to a measurable range at around t= 1.5 s, much earlier than with other commercial stimulators. Since the signal did not go out of scale for long, we were able to observe that the network needed a few seconds of adaptation to return to its normal oscillatory activity (Fig.7a). The ex-ample in Fig. 7a shows the first 7 s of a stimulation phase in which the current jump was about 0.1 mA (from ~−0.4 mA to ~ 0.6 mA). During this short period, the baseline of the MUA traces was increased (as highlighted by the red dashed circles in Fig. 7a) while the amplitude of the Up states remained almost unchanged (as highlighted by the green dashed circles in Fig. 7a). This effect was, to our knowledge, not an artifact in the recordings, but a response of the network activity to a large variation in the DC field.
Discussion
In this study we designed, tested and demonstrated a closed-loop system that can control the frequency of SO generated by the cerebral cortex by means of DC current stimulation. It is a proof of concept that this rhythmic activity that emerges from cortical networks can be regulated within some limits, a principle that has both research and medical applications. To suc-ceed, we solved several challenges in different fields ranging from artifact-related issues to real-time data analysis, to problems purely related to experiment execution. We discuss these interesting challenges in the following paragraphs.
Challenges faced by a closed-loop system that are derived from the physiology
Our designed system falls into the category of semi-automatic systems, meaning that it can work alone but it also allows for user intervention online. This possibility to automatically and manually intervene provides the flexibility of our system, which also responds to the nat-ural variability of the network oscillatory activity. We tested our system on the SO spontaneously generated by the cortical network [14], that consist of Up states (active periods of neuronal firing) and Down states (relatively silent periods). Automatic identification of Up states can be difficult due to many factors, ranging from the mechanisms of the network response to the changes in SO frequency caused by an applied electric field through DC stimulation. Changes in the SO fre-quency due to DC stimulation are related to an increase in the activity levels at high frequencies (200–1500 Hz), which corresponds to neuronal spikes, in the Down states [28]. Depolarizing fields induce an increase in ex-citability, and thus in the firing rate during Down states.
The increase of firing rate during the Down states en-hances the probability of triggering new Up states, thus resulting in a higher SO frequency. But it also results in a more challenging separation between Up and Down states, since there is more activity now in the Down states, and therefore a more difficult online autonomous identification of the Up states (see Methods section), in particular when injected currents were close to the max-imum (around 0.6 mA). In most cases, the method for automatically setting the identification thresholds in the MUA traces worked fine; in a few cases (usually when injecting 0.5–0.6 mA), however, user intervention to change the Up state-identification threshold on the fly was needed, which was done without any interruption in the protocol.
Challenges derived from the continuous DC stimulation and its updates
Particularly challenging was the managing of the arti-facts introduced in the recordings by the jumps in the level of injected currents, which in the first versions of the system looked almost as large as Up states. By redu-cing the noise produced by the hardware during current updates and by adopting software solutions (see above), we were able to reduce the appearance of such artifacts to short-lasting spikes with amplitudes proportional to the current jump (Fig. 7b). We could then easily avoid the artifacts in the identification of Up states by setting a threshold on their minimum duration.
A significant reduction of the out-scaling of the re-cording in response to large steps in the current level was also achieved (Fig. 7a). This illustrates that the sys-tem initially reaches a certain frequency and then slowly adapts a stationary state-frequency for a given electric field intensity. Since the spontaneously emergent rhyth-mic patterns are the result of both synaptic (excitation, inhibition) and intrinsic properties (ionic channels, membrane properties) of the network’s neurons, every new level of network excitability needs a period to settle into a new balance of the different mechanisms resulting in a stable oscillatory frequency.
of most slices. Limits can be easily expanded to user wishes, and degradation of the electrodes could be solved by using a different material: gold or platinum are good candidates. We used silver-silver chloride (Ag/ AgCl) to be consistent with previous studies from our-selves and others.
Improving the control
A set of possible tools ranging from dedicated hardware to real-time operating systems could be adopted to re-duce latencies in the loop and to access faster dynamics (for a review see [7]). In our case, to gain further control over the SO dynamics, apart from reducing latencies it would also be interesting to acquire data simultaneously from many spatially distributed electrodes, to impose different electric fields to different areas of the tissue and to explore more complex and dynamically adjustable stimulation patterns. This would allow us to control and understand the mechanisms underlying the SO dynam-ics in a more detailed way.
The intensity of the response of in-vitro networks to DC stimulation varies along with the initial spontaneous activity. In particular, the intensity correlates with Up and Down state durations in control conditions [28]. In some slices it is more difficult to achieve modulation of the SO frequency, especially for “extreme” targets such as 0.1 Hz or 0.8 Hz. In those cases, the distribution of the logarithm of the frequency across current intensities looks more like a sigmoid rather than a linear distribu-tion, and this makes it almost impossible to reach boundaries frequencies, at least with the limits that we imposed on timing and current intensities.
Potential applications
The modulation of SO frequency represents a starting point for a more complete closed-loop control of cor-tical activity. Once the identification of activity phases is achieved (in this case Up and Down states), it becomes easier to compute other activity parameters besides Up state frequency. It will then be possible to switch the sys-tem to control any of these activity parameters, as long as there is a specific model describing the system’s changes in relation to the DC stimulation, and as long as the timing of the changing parameters fits with the computation latencies.
The interest in closed-loop systems is corroborated by recent tests of closed-loop systems in humans. An im-plantable closed-loop system is thought to ameliorate the conditions of patients affected by Parkinson’s disease or suffering from epileptic crises (for a review see [42]). Because the imbalance between excitation and inhibition that leads to an alteration of the network activation pat-terns could be the basis of neurological or neurodegen-erative diseases, such as Parkinson’s disease [24] and
Alzheimer’s disease [43,44], implantation of closed-loop systems may aid these clinical populations too. In fact, tDCS has been shown to have good potential for a wide range of clinical applications [45–47] (for a recent re-view see [48]).
Regarding SO, it is now rather established that en-hancement of SO during slow wave (NREM) sleep can be a useful approach to enhance cognition at all ages (for a recent review see [17]). In particular, SO during sleep enhanced through transcranial magnetic stimula-tion have been found to enhance memory [49]. There is also memory enhancement while activated during wakefulness [50], although through the activation of higher frequencies. Furthermore, slow waves have been entrained through auditory close-loop stimulation, also enhancing memory [51].
Our system is a proof of concept of the possibility of regulating SO by means of direct current in a closed-loop way, a principle that here we demonstrate in an in-vitro section of the cerebral cortex, but it can be applied in vivo. The possibility of an autonomous system that controls and sets SO during patient sleep could be an interesting application for future developments of our system. The closed-loop would ensure a controlled ap-plication of low intensity currents in order to re-adjust SO parameters in case they get aberrant during the NREM sleep phases of patients, leading to a more fo-cused use of this treatment. In this perspective, future improvements of the system would involve the control of many parameters simultaneously, an objective that will pose challenges on the reduction of timing and de-lays of the computation system.
Conclusions
We designed a closed-loop system that can control the frequency of cortical slow oscillations. The designed sys-tem was able to identify Up states in real-time, measure their frequency, and autonomously adjust the intensity of the injected current such that a target frequency set by the user would be reached. To minimize the time re-quired to hit the target frequency, an initial current guess was obtained from an exponential model of the network’s reaction to DC electric fields [28]. By finely and continuously tuning the injected current to keep the frequency inside a tolerance range around the target fre-quency, the system compensated for natural and unpre-dictable fluctuations arising from the spontaneous activity of the network. Our system paves the way for fu-ture studies on in-vitro and in-vivo oscillatory dynamics of the cerebral cortex.
Abbreviations
Acknowledgements
We would like to thank Dr. Maurizio Mattia (ISS, Rome) for his suggestions Dr. Cristina Gonzalez-Liencres for her comments on the manuscript and Tony Donegan for the language revision.
Funding
This study was supported by the EU project CORTICONIC (Contract number 600806) to PdG and MVSV and by Ministerio de Economía y Competitividad (Spain) (BFU2017–85048-R) and FLAG-ERA (PCIN-2015-162-C02–01) to MVSV.
Availability of data and materials
The datasets used and/or analyzed during the current study are available from the corresponding author on reasonable request.
Authors’contributions
MD contributed to the design of the study, contributed to the design of the closed-loop software, performed the experiments, analyzed data and wrote the paper. MG contributed to the design of the study, to the design of the closed-loop software, to the creation of the stimulator, analyzed data and wrote the paper. VD built the stimulator. PG designed and supervised the study, wrote the paper. MVSV designed and supervised the study, wrote the paper. All authors read and approved the final manuscript.
Ethics approval and consent to participate
Ferrets were cared for and treated in accordance with Spanish regulatory laws (BOE-A-2013-6271), which comply with the European Union guidelines on protection of vertebrates used for experimentation (Directive 2010/63/EU of the European Parliament and of the Council of 22 September 2010). All experiments were approved by the Ethics Committee of the Hospital Clinic (Barcelona, Spain).
Consent for publication
Not applicable.
Competing interests
The authors declare that they have no competing interests.
Publisher’s Note
Springer Nature remains neutral with regard to jurisdictional claims in published maps and institutional affiliations.
Author details
1Systems Neuroscience, IDIBAPS, Rosselló 149-153, Barcelona 08036, Spain. 2
Istituto Superiore di Sanità, Rome, Italy.3ICREA, Passeig de Lluís Companys, 23, Barcelona 08010, Spain.
Received: 7 June 2018 Accepted: 5 December 2018
References
1. Hodgkin AL, Huxley AF. A quantitative description of membrane current and its application to conduction and excitation in nerve. J Physiol. 1952; 117:500–44.
2. Sharp AA, O’Neil MB, Abbott LF, Marder E. The dynamic clamp: artificial conductances in biological neurons. Trends Neurosci. 1993;16:389–94. 3. Wagenaar DA, Madhavan R, Pine J, Potter SM. Controlling bursting in
cortical cultures with closed-loop multi-electrode stimulation. J Neurosci. 2005;25:680–8.
4. Keren H, Marom S. Controlling neural network responsiveness: tradeoffs and constraints. Front Neuroeng. 2014;7:11.
5. Jackson A, Mavoori J, Fetz EE. Long-term motor cortex plasticity induced by an electronic neural implant. Nature. 2006;444:56–60.
6. Ezzyat Y, Wanda PA, Levy DF, Kadel A, Aka A, Pedisich I, et al. Closed-loop stimulation of temporal cortex rescues functional networks and improves memory. Nat Commun. 2018;9:365.
7. Arsiero M, Luscher HR, Giugliano M. Real-time closed-loop
electrophysiology: towards new frontiers in in vitro investigations in the neurosciences. Arch Ital Biol. 2007;145:193–209.
8. Limousin P, Pollak P, Benazzouz A, Hoffmann D, Le Bas JF, Perret JE, et al. Effect on parkinsonian signs and symptoms of bilateral subthalamic nucleus stimulation. Lancet. 1995;345:91–5.
9. Little S, Pogosyan A, Neal S, Zavala B, Zrinzo L, Hariz M, et al. Adaptive deep brain stimulation in advanced Parkinson disease. Ann Neurol. 2013;74:449–57. 10. Rosin B, Slovik M, Mitelman R, Rivlin-Etzion M, Haber SN, Israel Z, et al.
Closed-loop deep brain stimulation is superior in ameliorating parkinsonism. Neuron. 2011;72:370–84.
11. Sanchez-Vives MV, McCormick DA. Cellular and network mechanisms of rhythmic recurrent activity in neocortex. Nat Neurosci. 2000;3:1027–34. 12. Compte A, Reig R, Descalzo VF, Harvey MA, Puccini GD, Sanchez-Vives MV.
Spontaneous high-frequency (10-80 Hz) oscillations during up states in the cerebral cortex in vitro. J Neurosci. 2008;28:13828–44.
13. Sanchez-Vives MV, Mattia M. Slow wave activity as the default mode of the cerebral cortex. Arch Ital Biol. 2014;152:147–55.
14. Sanchez-Vives M V., Massimini M, Mattia M. Shaping the Default Activity Pattern of the Cortical Network. Neuron. 2017;94:993–1001.
15. Marshall L, Molle M, Hallschmid M, Born J. Transcranial direct current stimulation during sleep improves declarative memory. J Neurosci. 2004;24:9985–92.
16. Diekelmann S, Born J. The memory function of sleep. Nat Rev Neurosci. 2010;11:114–26.
17. Wilckens KA, Ferrarelli F, Walker MP, Buysse DJ. Slow-wave activity enhancement to improve cognition. Trends Neurosci. 2018;41:470–82. 18. Steriade M, Contreras D, Curró Dossi R, Nuñez A. The slow (< 1 Hz)
oscillation in reticular thalamic and thalamocortical neurons: scenario of sleep rhythm generation in interacting thalamic and neocortical networks. J Neurosci. 1993;13:3284–99.
19. Steriade M, Amzica F, Contreras D. Synchronization of fast (30–40 Hz) spontaneous cortical rhythms during brain activation. J Neurosci. 1996;16: 392 LP–417.
20. Buzsaki G, Silva FL. High frequency oscillations in the intact brain. Prog Neurobiol. 2012;98:241–9.
21. Siegel M, Donner TH, Engel AK. Spectral fingerprints of large-scale neuronal interactions. Nat Rev Neurosci. 2012;13:121–34.
22. Lopes da Silva FH, van Rotterdam A, Storm van Leeuwen W, Tielen AM. Dynamic characteristics of visual evoked potentials in the dog. I. Cortical and subcortical potentials evoked by sine wave modulated light. Electroencephalogr Clin Neurophysiol. 1970;29:246–59.
23. Lopes da Silva FH, van Rotterdam A, Storm van Leeuwen W, Tielen AM. Dynamic characteristics of visual evoked potentials in the dog. II. Beta frequency selectivity in evoked potentials and background activity. Electroencephalogr Clin Neurophysiol. 1970;29:260–8.
24. Bouyer JJ, Montaron MF, Rougeul A, Buser P. Parietal electrocortical rhythms in the cat: their relation to a behavior of focused attention and possible mesencephalic control through a dopaminergic pathway. C R Seances Acad Sci D. 1980;291:779–83.
25. Desmedt JE, Tomberg C. Transient phase-locking of 40 Hz electrical oscillations in prefrontal and parietal human cortex reflects the process of conscious somatic perception. Neurosci Lett. 1994;168:126–9.
26. Frohlich F, McCormick DA. Endogenous electric fields may guide neocortical network activity. Neuron. 2010;67:129–43.
27. Reato D, Rahman A, Bikson M, Parra LC. Low-intensity electrical stimulation affects network dynamics by modulating population rate and spike timing. J Neurosci. 2010;30:15067–79.
28. D’Andola M, Weinert JF, Mattia M, Sanchez-Vives M V. Modulation of slow and fast oscillations by direct current stimulation in the cerebral cortex in vitro. bioRxiv. Cold Spring Harbor Laboratory; 2018;246819. 29. D’Andola M, Giulioni M, Dante V, Del Giudice P, Sanchez-Vives M V. A
closed-loop stimulation system to modulate slow oscillations frequency of in vitro acute cortical slices. B-DEBATE A Dialogue with Cereb Cortex Cortical Funct Interfacing. Frontiers in Systems Neuroscience; 2015. 30. Sorensen M, DeWeerth S, Cymbalyuk G, Calabrese RL. Using a hybrid neural
system to reveal regulation of neuronal network activity by an intrinsic current. J Neurosci. 2004;24:5427–38.
31. Mavoori J, Jackson A, Diorio C, Fetz E. An autonomous implantable computer for neural recording and stimulation in unrestrained primates. J Neurosci Methods. 2005;148:71–7.
32. Schiff SJ. Neural control engineering: the emerging intersection between control theory and neuroscience. Press MIT, editor. Comput. Neurosci. Cambridge, Massachusetts: 2012 Massachusetts Institute of Technology; 2012. 33. Dorval AD, Christini DJ, White JA. Real-time linux dynamic clamp: a fast and
34. Rolston JD, Gross RE, Potter SM. Closed-loop, open-source electrophysiology. Front Neurosci. 2010;4.
35. Zrenner C, Eytan D, Wallach A, Thier P, Marom S. A generic framework for real-time multi-channel neuronal signal analysis, telemetry control, and sub-millisecond latency feedback generation. Front Neurosci. 2010;4:173. 36. Sanchez-Vives MV. Spontaneous Rhythmic Activity in the Adult Cerebral
Cortex In Vitro. In: Ballanyi K, editor. Isol Cent Nerv Syst Circuits. 2012. p. 263–84.
37. Aghajanian GK, Rasmussen K. Intracellular studies in the facial nucleus illustrating a simple new method for obtaining viable motoneurons in adult rat brain slices. Synapse. 1989;3:331–8.
38. Reig R, Mattia M, Compte A, Belmonte C, Sanchez-Vives MV. Temperature modulation of slow and fast cortical rhythms. J Neurophysiol. 2010;103: 1253–61.
39. Mattia M, Del Giudice P. Population dynamics of interacting spiking neurons. Phys Rev E Stat Nonlin Soft Matter Phys. United States. 2002;66: 51917.
40. Ruiz-Mejias M, Ciria-Suarez L, Mattia M, Sanchez-Vives MV. Slow and fast rhythms generated in the cerebral cortex of the anesthetized mouse. J Neurophysiol. 2011;106(6):2910–21.
41. Bikson M, Inoue M, Akiyama H, Deans JK, Fox JE, Miyakawa H, et al. Effects of uniform extracellular DC electric fields on excitability in rat hippocampal slices in vitro. J Physiol. 2004;557:175–90.
42. Sun FT, Morrell MJ. Closed-loop neurostimulation: the clinical experience. Neurotherapeutics. NeuroPace Inc., 445 N. Bernardo Avenue, Mountain View, CA, 94043, USA, [email protected]; 2014;11:553–63.
43. Stam CJ, van der Made Y, Pijnenburg YA, Scheltens P. EEG synchronization in mild cognitive impairment and Alzheimer’s disease. Acta Neurol Scand. 2003;108:90–6.
44. Babiloni C, Ferri R, Moretti DV, Strambi A, Binetti G, Dal Forno G, et al. Abnormal fronto-parietal coupling of brain rhythms in mild Alzheimer’s disease: a multicentric EEG study. Eur J Neurosci. 2004;19:2583–90. 45. Priori A, Berardelli A, Rona S, Accornero N, Manfredi M. Polarization of the
human motor cortex through the scalp. Neuroreport. 1998;9:2257–60. 46. Nitsche MA, Cohen LG, Wassermann EM, Priori A, Lang N, Antal A, et al.
Transcranial direct current stimulation: state of the art 2008. Brain Stimul. 2008;1:206–23.
47. Nitsche MA, Paulus W. Noninvasive brain stimulation protocols in the treatment of epilepsy: current state and perspectives. Neurotherapeutics. 2009;6:244–50.
48. Lefaucheur J-P, Antal A, Ayache SS, Benninger DH, Brunelin J, Cogiamanian F, et al. Evidence-based guidelines on the therapeutic use of transcranial direct current stimulation (tDCS). Clin Neurophysiol. 2017;128:56–92. 49. Marshall L, Helgadóttir H, Mölle M, Born J. Boosting slow oscillations during
sleep potentiates memory. Nature. 2006;444:610–3.
50. Kirov R, Weiss C, Siebner HR, Born J, Marshall L. Slow oscillation electrical brain stimulation during waking promotes EEG theta activity and memory encoding. Proc Natl Acad Sci. 2009;106:15460–5.