profiling for the optimization of microbial and
enzymatic processes
Kunze
et al.
R E S E A R C H
Open Access
Minireactor-based high-throughput temperature
profiling for the optimization of microbial and
enzymatic processes
Martin Kunze
1, Clemens Lattermann
1, Sylvia Diederichs
1, Wolfgang Kroutil
2and Jochen Büchs
1*Abstract
Background:Bioprocesses depend on a number of different operating parameters and temperature is one of the most important ones. Unfortunately, systems for rapid determination of temperature dependent reaction kinetics are rare. Obviously, there is a need for a high-throughput screening procedure of temperature dependent process behavior. Even though, well equipped micro-bioreactors are a promising approach sufficient temperature control is quite challenging and rather complex.
Results:In this work a unique system is presented combining an optical on-line monitoring device with a customized temperature control unit for 96 well microtiter plates. By exposing microtiter plates to specific temperature profiles, high-throughput temperature optimization for microbial and enzymatic systems in a micro-scale of 200μL is realized. For single well resolved temperature measurement fluorescence thermometry was used, combining the fluorescent dyes Rhodamin B and Rhodamin 110. The real time monitoring of the microbial and enzymatic reactions provides extensive data output. To evaluate this novel system the temperature optima forEscherichia coliandKluyveromyces
lactisregarding growth and recombinant protein production were determined. Furthermore, the commercial cellulase
mixture Celluclast as a representative for enzymes was investigated applying a fluorescent activity assay.
Conclusion:Microtiter plate-based high-throughput temperature profiling is a convenient tool for characterizing temperature dependent reaction processes. It allows the evaluation of numerous conditions, e.g. microorganisms, enzymes, media, and others, in a short time. The simple temperature control combined with a commercial on-line monitoring device makes it a user friendly system.
Keywords:High-throughput screening, On-line monitoring, Microtiter plate, Optical measurement, Temperature optimum
Background
Bioprocesses, either fermentations or enzymatic cataly-sis, depend on a number of different operating parame-ters. Temperature is one of the most important. It is commonly known that processes should be performed under optimal conditions in order to achieve best re-sults, e.g. reaction rates or yields [1]. Thereby, the temperature optimum can be different within one mi-crobial or enzymatic system, either the focus is on growth or product formation [2], on enzyme activity or stability [3,4].
Over the last decades the number of potential biopro-cesses for the production of valuable products increased and this trend continues. Consequently, more and more microbial and enzymatic systems need to be character-ized regarding their temperature optima. Conventional methods are disadvantageous in many ways. Repetitive batch cultivations at varied temperatures, either in shake flasks or bench scale bioreactors, provide only a few data points at the expense of relatively high material and time input. The analysis of temperature-specific activities and kinetic parameters of enzymes is traditionally performed in a spectrophotometric way by use of a temperature-controlled water jacketed single cuvettes [5]. Even though the external thermostat provides constant and accurate temperature control over a broad temperature range, the
* Correspondence:[email protected] 1
AVT-Chair for Biochemical Engineering, RWTH Aachen University, Worringerweg 1, 52074 Aachen, Germany
Full list of author information is available at the end of the article
numbers of samples handled for simultaneous reading in such spectrophotometers are usually very limited.
To face these limitations micro-bioreactors (MBR) be-came a promising alternative, but sufficient temperature control is quite challenging [6]. The simplest way is to use MBRs, e.g. microtiter plates (MTP), in temperature controlled rooms [7] or incubators [8]. Another option is to link the MBR system to a thermostat system and circulate water through the MBR chamber base [4,9-11]. The major disadvantage of these systems is their limita-tion in operating parallel reactors at different tempera-tures. One exceptional system allows the operation of sixteen parallel small scale reactors equipped with cer-amic heating jackets but its use requires costly instru-mentation and is focused on chemical reactions [12]. The integration of electrical micro-heaters to the bot-toms or walls of MBRs allows individual temperature control of parallel MBRs [13-15]. However, for high-throughput application the required hardware and con-trol become exceedingly complex.
Whilst temperature control is rather challenging in MBRs, temperature measurement is relatively simple. There are several reports on the application of temperature dependent resistances [14-16] or thermocouples [10,17]. Also thermal or infrared cameras allow temperature determination in MBRs [18,19]. Furthermore, the so called fluorescence thermometry can be used [11,20-22]. The combination of a temperature dependent fluorophore and a spectrophotom-eter is a promising method for high-throughput temperature determination, e.g. in MTPs.
In this work, a system is presented combining the on-line monitoring system BioLector [23,24] with a custom-ized temperature control unit for 96 well MTPs, thereby, allowing high-throughput temperature optimization for microbial and enzymatic reaction systems in a micro-scale of 200μL. On the one hand, the BioLector system allows quasi-continuous measurement of optical signals over time representative for microbial growth and prod-uct formation or enzymatic activity. On the other hand, the tempering system, consisting of a special thermostat-ing block connected to two thermostats, creates specific temperature profiles over a MTP. For the single well temperature measurement fluorescence thermometry was used. Combining the fluorescent dyes Rhodamin B (RhB) and Rhodamin 110 (Rh110) a reliable assay was established for application with the BioLector technique [21]. After defining several profiles at different temperature levels, the device was used to characterize microbial and enzymatic systems. The whole temperature profiles and optima for the bacterium Escherichia coli and the yeast
Kluyveromyces lactis regarding growth and recombinant protein production were determined in single shot experi-ments. Additionally, the commercial cellulase mixture Celluclast as a representative for enzymes was investigated
applying a fluorescent activity assay. The results of this temperature high-throughput screening could be used for a mathematical description of the particular temperature dependent behavior of the investigated biological system as an extended Arrhenius model for catalyst activation and deactivation [25].
Material and methods Temperature control unit
The design of the heating block is based on the work of Rachinskiy et al. [4,9]. It is made of aluminium with tube adapters for the two water circulation systems (Figure 1C). The circulation system for cooling was op-erated with the FL300 recirculation cooler (Julabo, Seelbach, Germany) allowing temperature set points from −20°C to 40°C. The flow rate was determined to 2.1 L min−1. The heating water circulation worked with the Ecoline E300 thermostat (Lauda, Lauda-Königshofen, Germany) for temperature set points of 25-100°C. A flow rate of 1.1 L min−1 was measured. Both circulation sys-tems were operated with tap water. Temperature set points below 5°C and above 95°C were avoided to prevent the water from freezing or boiling.
On-line monitoring system
The optical measurement technique is identical to that described in the work of Samorski et al. [24]. The in-house constructed device is henceforth referred as BioLector. Wavelengths and gain factors for all optical signals are specified in Table 1. For all experiments 96well lumox multiwell plates (Greiner Bio-One GmbH, Frickenhausen, Germany) were used.
Temperature determination
For the temperature measurement via fluorescent dyes a mixture of Rhodamin B (RhB) and Rhodamin 110 (Rh110) was used. Before each experiment a fresh meas-uring solution was prepared from 100-fold concentrated stock solutions of RhB and Rh110, respectively. For these stock solutions dye powder was dissolved in pure methanol yielding a concentration of 1 g L−1and stored at 4°C. For the measuring solution the two stock solu-tions were mixed with water and diluted to a final con-centration of 10 mg L−1, respectively. 200 μL of the prepared solution were filled into each well of the MTP and shaken at a frequency of 995 rpm at a shaking diam-eter of 3 mm.
For the calibration of the fluorescence signal versus the temperature only the well equipped with the PT100 sensor was monitored in order to accelerate the proced-ure. For each point five consecutive measuring values were averaged. For temperature profiles twelve con-secutive measurement cycles of the whole MTP were
performed to get the average for each well. The PT100 sensor was placed as reference in well A2. For each spe-cific temperature profile fresh prepared measuring solu-tion with a new determined calibrasolu-tion curve was used.
Microorganisms
The E. coli clone expressing FbFP was E. coli BL21 (DE3) with the pRhotHi vector and kanamycin resist-ance. For alcohol dehydrogenase A (ADH-A, from Rho-dococcus ruber) expression E. coli BL21 (DE3) with the pET22b vector and ampicillin resistance was used. For
K. lactis experiments the strain GG799 with the pKlac1 vector expressing GFP was applied.
Media and cultivation
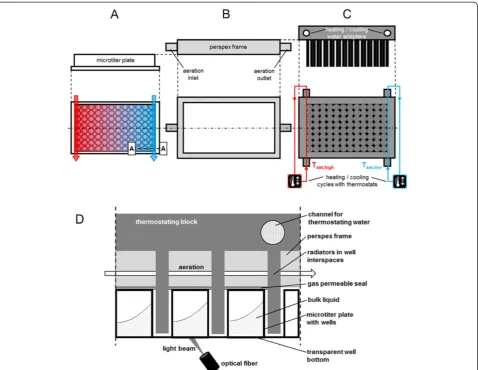
ForE. colipre-cultures terrific broth (TB) medium con-sisting of 12 g L−1 tryptone, 24 g L−1 yeast extract, Figure 1Scheme of the temperature control unit for temperature profiling in microtiter plates (MTP). (A)Side view on the MTP and top view with schematic illustration of thermostating water flows (arrows) and resulting temperature profile.(B)Side and top view on the perspex frame for aeration(C)Side view on the thermostating block and bottom view with schematic illustration of the heating (red) and cooling (blue) water circulation and their two respective thermostats. Tset,highand Tset,lowstand for thermostat set point temperatures for heating and cooling water, respectively.(D)Cut A-A-view (see Figure 1A) on the microtiter plate with attached thermostating block and optical measurement.
Table 1 Optical signals and applied setup for on-line monitoring
Optical signal λex[nm] λem[nm] Gain
12.54 g L−1 K2HPO4, 2.31 g L−1 KH2PO4, and 5 g L−1 glycerol (all ingredients from Roth, Germany) dissolved in water was used. The pH value was 7.2 ± 0.2 without ad-justment. For the main cultivation of E. coli under non-induced conditions either TB medium or a modified Wilms and Reuss medium (henceforth referred as Wilms-MOPS medium) were used [26,27]. Wilms-MOPS medium con-sists of 5 g L−1 (NH4)2SO4, 0.5 g L−1 NH4Cl, 3.0 g L−1 K2HPO4, 2 g L−1 Na2SO4, 0.5 g L−1 MgSO4· 7H2O, 0.01 g L−1 thiamine hydrochloride, 20.9 g L−1 3-(N-mor-pholino)-propanesulfonic acid (MOPS, 0.2 M), 20 g L−1 glucose and 1 mL L−1 trace element solution. This trace element solution consists of 1.98 g L−1 CaCl2· 2H2O, 0.54 g L−1 CoCl2· 6H2O, 0.48 g L−1 CuSO4· 5H2O, 41.76 g L−1FeCl3· 6H2O, 0.3 g L−1MnSO4· H2O, 0.54 g L−1 ZnSO4· 7H2O, 33.39 g L−1Na2EDTA (Titriplex III). The pH was adjusted with 5 M NaOH to a value of 7. For experi-ments under induced conditions either the commercially available ready-made complex auto-induction medium Overnight Express Instant TB medium (OnEx, Novagen®/ Merck, Darmstadt, Germany) or a modified Wilms-MOPS medium was used. OnEx consists of complex com-ponents similar to TB medium and the carbon sources glucose, lactose, and glycerol. For preparing the medium 60 g of the commercial granulate and 12.6 g of glycerol were dissolved in water and filled up to 1 L without pH-adjustment. HPLC analysis of the medium indicated a glu-cose concentration of 0.5 g/L and a lactose concentration of 2 g/L. For the modification of Wilms-MOPS medium in order to get a mineral auto-induction medium 1 g L−1 glucose, 4 g L−1lactose and 5 g L−1glycerol where added instead of 20 g L−1glucose as carbon source. Depending on the clone’s resistance, 50 μg mL−1 kanamycin or 100μg mL−1ampicillin were added to the medium from a 1000 fold concentrated stock solution.
For K. lactis pre-cultures and cultivation under non-induced conditions yeast extract peptone (YP) [28] medium was used, consisting of 10 g L−1yeast extract, 20 g L−1 tryptone and 20 g L−1 glucose. For cultiva-tions under induced condicultiva-tions 20 g L−1 galactose in-stead of glucose served as carbon source and inducer for recombinant protein expression.
For E. coli pre-cultivation, 10 mL of TB medium in a 250 ml shake flask were inoculated with 50 μL from a cryoculture, and cultures were grown for 8 h at 350 rpm (shaking diameter 50 mm) and 37°C. K. lactis pre-culture conditions were the same aside from being grown in YP medium for 12 h at 30°C.
For all main cultivations the respective medium was inoculated from the pre-culture, resulting in an initial OD600 of 0.1. 200μL of the already inoculated medium was then transferred to each of the wells of the MTP. The plates were sealed with gas-permeable seals (AB-0718, Thermo Scientific, Dreieich, Germany). Subsequently, the
pre-tempered thermostating block was mounted atop the MTP and both were fixed on the orbital shaker (Kühner AG, Basel, Switzerland) of the BioLector. The cultivation was performed at a shaking frequency of 995 rpm and a shaking diameter of 3 mm. For aeration pure oxygen was used. For scattered light and fluorescence measurement the initial light intensity (I0), which is mainly attributed to such factors as the media background or the type of the mi-crotiter plate, was subtracted from the original mea-sured data (I-I0).
Reference shake flask cultures were performed in a Res-piration Activity Monitoring System (RAMOS) [29,30] built in-house. Commercial versions of this device are available from Hitec Zang (Herzogenrath, Germany) or Kühner AG (Birsfelden, Switzerland). 10 mL of OnEx medium in a special 250 ml shake flask were inoculated from the pre-culture, resulting in an initial OD600 of 0.1. Subsequently, the cultures were shaken at 350 rpm with a shaking diameter of 50 mm at temperatures of 22-37°C with aeration by pressurized air. Cells for ADH-A analysis were harvested in the stationary phase, indicated by the OTR on-line signal of the RAMOS device.
Cellulase experiments
For hydrolysis experiments the substrate 4-methylumbelliferyl-β-D-cellobioside (4MUC) was used in combination with the commercial cellulase mix Celluclast 1.5 L (Novo-zymes, Bagsvaerd, Denmark). A 0.75 mM stock solution of 4MUC in 0.1 M acetate buffer (pH = 4.8) was prepared. The enzyme stock solution contained 5 g L−1of Celluclast crude extract in 0.1 M acetate buffer (pH = 4.8). Before starting the experiments, 180μL of the 4MUC stock solu-tion were filled in each well of a 96 well MTP and pre-heated for 30 min applying the respective temperature profile. Subsequently, 20 μL of the enzyme stock solu-tion were added to each MTP well resulting in final concentrations of 0.6 mM 4MUC and 1 g L−1 Cellu-clast. Since no aeration was necessary, the plate was sealed with a non-permeable foil (AB-0580, Thermo Scientific, Dreieich, Germany). The further procedure was identical to the cultivation experiments in MTPs besides that 4-methylumbellyferone (4MU) fluores-cence was the only measuring signal (Table 1). To cali-brate the fluorescence signal, 200 μL of solutions with varied 4MU concentrations were filled in a 96 well MTP and their fluorescence intensity was measured using the BioLector. The calibration measuring points are aver-age values from three independent measurements.
Offline analysis
For values higher than 0.5 the samples were appropri-ately diluted with 0.9% [wt/vol] NaCl solution.
The volumetric activity of the produced alcohol de-hydrogenase A (ADH-A) was determined at 30°C by fol-lowing the oxidation of NADH at a wavelength of 340 nm in 96-well microtiter plates (F-profile, Roth, Germany) using a Synergy-4 Multi-Mode Microplate Reader (BioTek Instruments, Germany). For cell disrup-tion of E. coli expressing ADH-A, the cell pellet of 500 μL culture broth was suspended in 100μL BugBuster Protein Extraction Reagent (Novagen, Merck, Germany) adding 1000 U/mL lysozyme (Roth, Germany) and 25 U/mL DNaseI (AppliChem, Germany). Cell disruption was contin-ued according to the manufacturers’specifications obtaining the soluble fraction with dissolved ADH-A. 200μL reaction mixture (including enzyme solution) were prepared for measurement of ADH-A activity and contained 50 mM Tris buffer (pH 8, RT), 100 mM 2,5-hexanedione, and 0.5 mM NADH (biomol, Germany). By addition of the enzyme solu-tion the reacsolu-tions were initiated, thereby, applying appropri-ate enzyme solution amounts to ensure linear decreases of NADH absorbance over 1 min at least. One unit (U) was de-fined as the amount of enzyme converting 1μmol cofactor per min.
Results and discussion
Development of the instrumentation
The here used measurement setup is a modification of an earlier developed system, the so called Enzyme Test Bench [4,9]. It combines an optical on-line monitoring system for cultivations and reactions in microtiter plates with a special system for temperature regulation.
The temperature control unit is depicted in Figure 1. It is similar to the heat transfer block of the Enzyme Test Bench for oxygen consuming reactions described by Rachinskiy et al. [9]. During experiments the MTP (side and top views in Figure 1A) is covered by a perspex frame (side and top views in Figure 1B) with an inlet and an outlet for aeration. The thermostating block (side and top views in Figure 1C) is mounted on top. It in-cludes radiators which fit exactly within the well inter-spaces. Thus, the wells are jacketed by these radiators providing efficient heat transfer between the thermostat-ing block and the MTP wells. The heat transfer proper-ties of the system were specified before [4]. The whole system itself was placed in a temperature controlled en-vironment. To minimize the evaporation, a gas perme-able seal is fixed between the MTP and the perspex frame. In this foil a pattern in the radiators’shape is cut. Additionally, the aeration gas is passed through five bub-ble columns to saturate it with water vapor. A sectional view (A-A-cut in Figure 1A) of the MTP attached with the perspex frame and thermostating block is shown in Figure 1D.
The original thermostating block described by Rachinskiy et al. was designed to ensure a homogeneous temperature distribution over the microtiter plate [9]. Contrary to that, in this work the aim was to create a temperature gradient. For this purpose, the thermostating block has two water circulation systems instead of one, each with a separate thermostat (Figure 1C). If operated at different tempera-tures a certain temperature profile can be imposed onto the MTP just by heat conductance through the aluminium block (Figure 1A).
The advantage of the thermostating block mounted on top of the MTP, compared to systems working e.g. with electrical micro-heaters (9, 23, 34, 36) is that the trans-parent MTP bottom is still available for optical measure-ments. The applied on-line monitoring system (indicated by the optical fiber and light beam in Figure 1D) is simi-lar to the BioLector technique presented before [24]. Thereby, the equipped fluorescence spectrometer allows measurements at different wavelengths. With this setup, microbial growth (via scattered light) or the formation of various fluorescent components is continuously followed in microtiter plates without interruption of the shaking process.
Optical temperature determination in MTPs
It must be considered that the thermostat set point tem-peratures in Figure 2A and the actual temtem-peratures in the MTP’s wells are not identical since heat may be lost to the environment. For this reason, one well was equipped with an in-house constructed PT100 temperature sensor. In this way, the corresponding well temperatures for various RhB/Rh110 ratios were determined. In Figure 2B the resulting calibration curve is depicted. It is described by a polynomial equation of second degree applying MS Excel. The fluorescence ratios are average values of five measure-ments in one well. The maximum relative standard devi-ation was 0.4%. For further investigdevi-ation of the measuring accuracy the heating block temperature, as well as the
room temperature, was adjusted to 37°C. In this way, a constant temperature of 37°C in each well could be as-sumed. The regarding measurement of all 96 wells re-vealed an average value of 37°C with a maximum of 38.7°C and a minimum of 35.6°C. The standard devi-ation was 0.76 K. The reason for the devidevi-ation from well to well cannot be explained completely. Slight de-viations in the properties of the transparent microtiter plate bottom are possible which may influence the op-tical signals. A systematic position effect could be ex-cluded during the experiments.
Temperature profiles
The optical temperature measuring method was then used to characterize the temperature distribution over microtiter plates at varied set point temperatures of the heating and cooling thermostat (Tset,high, Tset,low) and at varied room temperature (RT). In Figure 3A the exem-plary temperature profile for Tset,low of 5°C, Tset,high of 50°C and a RT of 30°C is depicted. As expected, the pro-file shows a clear gradient from the warm right side (col-umn 1) to the cold left side (col(col-umn 12). The highest measured well temperatures were found in the wells A-D of column 1 (Tmax= 36.2-36.9°C), the lowest values in the wells A-F of column 12 (Tmin= 20.4-20.8°C). The rest of the wells cover the whole temperature range be-tween Tmin and Tmax. Even though not every MTP row shows exactly the same temperature gradient, a certain repetitive trend can be observed.
By varying the thermostat set temperatures the profile can be shifted to higher or lower temperature ranges. A decrease of Tset,high to 40°C results in a temperature range of 17.7-30.3°C, showing that the change of only one set point temperature has influence on both, Tmin and Tmax(comp. Figure 3A and B). This is not surpris-ing since the temperature gradient in the thermostatsurpris-ing block itself is strongly dependent on the two set point temperatures of the heating and cooling cycle.
The room temperature has a strong influence to the temperature profile, too. Its increase from 30°C to 37°C resulted in a higher temperature range (comp. Figure 3A and C). Tmin increased from 20.4 to 28.0°C, Tmax from 36.9 to 39.9°C. This effect is mainly attributed to the MTP’s bottom which is thermally completely exposed to the environment. Hence, there is a large heat exchange area. This cannot be avoided, e.g. by insulation, because the transparent bottom needs to be accessible for the optical measurement. On the other hand, this effect might be beneficial by making the RT an additional temperature control parameter.
Figure 3D and E show further profiles at higher temperature levels. By setting the thermostat tempera-tures to 5 and 60°C, respectively, well temperatempera-tures of 30.3-47.3°C can be realized (Figure 3D). To characterize Figure 2Optical temperature measurement in MTPs applying a
even thermophilic microbial or enzymatic systems a Tset,high of 95°C was chosen (Figure 3E). In this way a profile with Tmax of 64.5°C was achieved. Tmin was 42.1°C. It must be considered that under these condi-tions the cryostat was not able anymore to ensure a set point temperature of 5°C since the cooling water heated up to much while passing through the thermostating block. To work under defined conditions Tset,lowwas in-creased to 10°C.
In all determined profiles it is obvious that Tmin and Tmax differ strongly from Tset,low and Tset,high, respect-ively. This is due to heat losses in the temperature con-trol system. Some heat transfer might occur from the tubes of the circulation system. Measurements show that this loss is rather low, e.g. for the profile in Figure 3C with Tset,lowof 5°C and Tset,high of 50° the temperatures before entering the block were 5.2°C and 49.3°C, re-spectively. This proves that the tube insulation worked properly. On the contrary, the current version of the thermostating block has no special insulation to the envir-onment. It can be assumed that the exposed aluminum surface is mainly responsible for the observed temperature
differences. The non-insulated MTP bottom is responsible for additional heat dissipation as discussed above. The re-sults in Figure 3F support this argument. Compared to the profile in Figure 3D the MTP was not shaken during the measurement. Interestingly, the differences between the set point temperatures Tset,lowand Tset,highand the regard-ing minimal and maximal temperatures Tminand Tmaxare smaller. This results in a broader well temperature range of 22.2-51.3°C (comp. Figure 3D, 30.3-47.3°C). The phenomenon can be explained by a ventilation ef-fect caused by shaking of the MTP. While an insulating air layer may be generated below a non-shaken MTP de-creasing the environment’s influence, this layer may be lost when the plate starts moving. Nonetheless, for most processes sufficient shaking is absolutely necessary due to mixing and mass transfer requirements.
the heating water gets colder and the cooling water warms up. For the profile in Figure 3C the heating water’s temperature decreased by 1.2 K from entry to exit, whereas the cooling water got 0.5 K warmer. Of course these values will differ from one profile to another.
Temperature dependence of microbial systems
In the following experiments the information from the temperature profiles (Figure 3) was used to investigate several microbial systems in order to find optimal condi-tions for biomass formation or recombinant protein ex-pression. Microbial growth (via scattered light) and the formation of fluorescent proteins was followed on-line applying the BioLector technique. To ensure that really the temperature is the limiting factor during the cultiva-tion it was necessary to exclude other limitacultiva-tions. Previous studies showed that the applied media allow non-limiting growth [27,28,31]. A critical factor is the oxygen supply. For the applied shaking conditions (200μL filling volume, 995 rpm shaking frequency, 3 mm shaking diameter) and aeration with pressurized air a maximum oxygen transfer capacity of approx. 0.03 mol L−1 h−1 was determined (data not shown). This value differs among media de-pending on their oxygen solubility and diffusion coeffi-cient [32-34]. However, E. coli grown in rich medium at 37°C may require maximum oxygen transfer capaci-ties up to 0.1 mol L−1h−1(data not shown). To realize such high transfer rates the aeration was shifted from pressurized air to pure oxygen. In this way, almost the 5-fold maximum oxygen transfer capacity can be achieved and cultivations without oxygen limitation are warranted for all applied media and microorganisms.
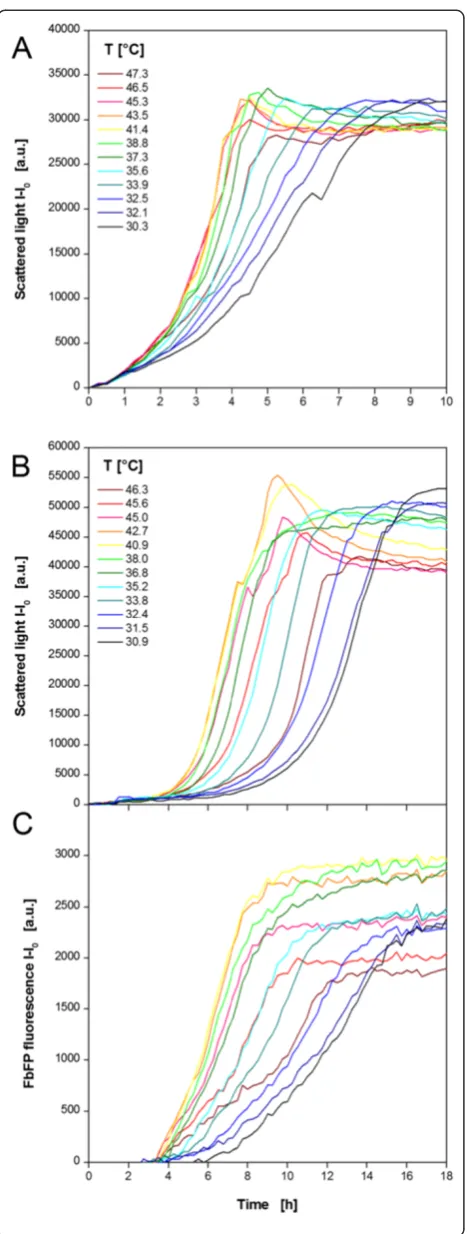
An E. coli strain expressing a fluorescent model pro-tein (FbFP) as product was investigated (Figure 4). Non-induced (MTP row A,C,E,G) and Non-induced (MTP row B, D, F, H) cultivations were performed in parallel in one MTP. The temperature profile was essentially identical to Figure 3D. The results of 12 (out of 48) exemplary non-induced cultures in TB medium are shown in Figure 4A. All cultures begin immediately with their exponential growth without any lag phase. After 1 h the curves start spreading indicating different growth rates at different temperatures. The lowest rate is observed at the lowest temperature of 30.3°C. Higher temperatures lead to increased growth rates indicated by steeper curves. The maximum growth rate occurs at temperatures of 41.4-45.3°C. A further increase retarded the microbial growth again. Due to varied growth rate the time point for reach-ing the stationary phase differs as well. At 41.4°C the cul-ture became stationary after 4.5 h, whereas it needed twice as long at 30.3°C. Comparing the final scattered light inten-sities, it can be seen that slightly more biomass was formed at lower temperatures. This might be explained by a higher energy demand for cell maintenance at
higher temperatures which withdraws metabolic resources from growth [35]. It was already found that organisms growing at temperatures above their optimal growth temperature show lower cell yields. Thereby, it was postu-lated that biosynthetic reactions at high temperatures do not keep pace with catabolic reactions [36].
Exemplary curves for growth and product formation under induced conditions are depicted in Figure 4B and C, respectively. The auto-induction medium OnEx was used which works as follows: glucose is the preferred carbon source and represses recombinant protein ex-pression to ensure undisturbed initial growth. After glucose depletion lactose is taken up and acts as the inducer of the expression system. Glycerol is an add-itional energy source. The scattered light curves reflect the medium’s working principle (Figure 4B) which was studied before in detail [37]. For all cultures a short
The curve’s slope depends on the temperature with the strongest increase at 40.9-42.7°C indicating the highest production rate. As a consequence, the maximum FbFP fluorescence is reached in the shortest time after 9 h. The slowest culture is found at 30.9°C reaching its maximum fluorescence after 17–18 h. These times correlate very well with the biomass signal (Figure 4B) which indicates that product formation stops with entering the stationary phase. Additionally, not only the production rate differs among the temperatures, but the maximum product con-centration, too. The highest level is observed again at 40.9°C revealing the optimal temperature for FbFP pro-duction combining the maximum propro-duction rate and product concentration.
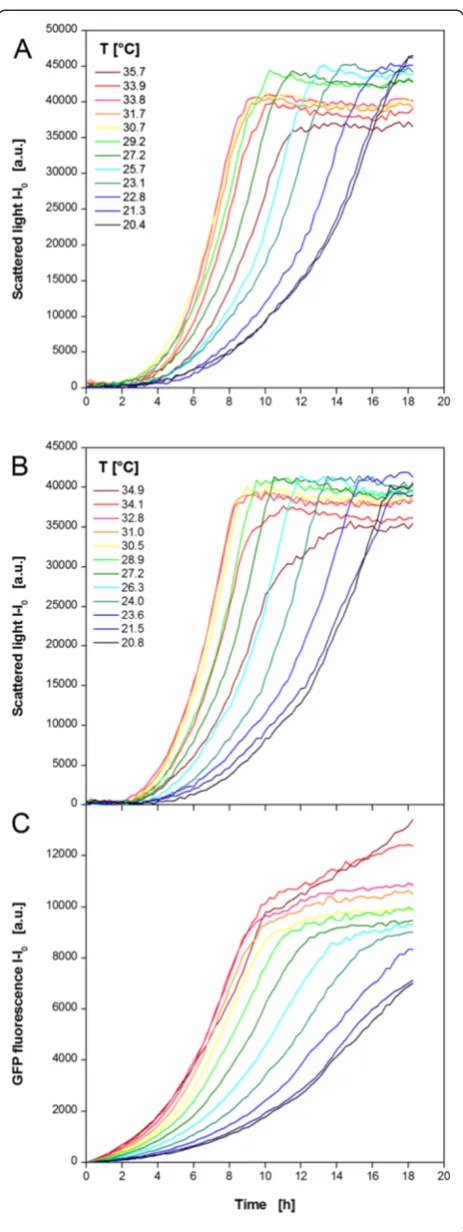
As a further microbial system the yeast K. lactis ex-pressing GFP as product was investigated (Figure 5). Again, non-induced (MTP row A, C, E, G) and induced (MTP row B, D, F, H) cultivations were performed in parallel in one MTP. The temperature profile was essen-tially identical to Figure 3A. The results of 12 exemplary non-induced cultures in YP medium containing glucose as carbon source are shown in Figure 5A. Contrary toE. coli, the cultures show a temperature dependent lag
phase. The minimum lag time of 2 h was observed at 27.2-33.8°C. During the subsequent exponential growth phase also the highest growth rates occur at those tem-peratures. Shifts to higher or lower temperatures lead to extended lag phases and reduced growth rates. As already observed for E. coli, the time point for reaching the stationary phase differs from 9–18 h due to the temperature dependent lag phase and growth rate. Again, the final scattered light intensities are higher at lower temperatures as already discussed forE. coli.
Contrary to E. coli, the growth behavior of K. lactis
under induced conditions is not much different from that under non-induced conditions (comp. Figure 5A and B). The substitution of glucose by galactose as car-bon source and inducer affects the microbial growth in-significantly. The lag phase, the growth rate, and the final biomass concentration show the same temperature dependent behavior as observed for the non-induced
K. lactis cultures. The product formation shows a slightly different trend (Figure 5C). All GFP fluorescence signals
increase continuously from the beginning. The strongest increase indicating the highest production rate is observed at 31.0-34.9°C meaning that the GFP expression rather than microbial growth favors higher temperatures. Also the final product concentration increases with rising temperature. The reason for the further increase of the GFP fluorescence in stationary phase observed for 34.1 and 34.9°C is yet unclear. A concentration effect due to in-creased evaporation cannot explain this phenomenon. The determination of the filling volume after the cultiva-tion revealed relatively low volume decreases of 1.1, 4.5, and 7% at 20.8, 31.0, and 34.9°C, respectively. For this rea-son, evaporation was not taken into consideration. Higher temperatures may provoke cell lysis in the stationary phase. As a result free GFP may induce brighter fluores-cence in the medium without the barrier of the yeast’s cell wall and membrane. Further studies, e.g. by applying flow cytometry, could help to clarify this effect.
For cultivation media it is known that temperature changes may result in pH changes as well, hence, two process parameters are unintendedly varied at once. This might lead to distorted results. The buffers used within this work show rather low changes within the applied temperature profiles with a maximum pH change of 0.2 (0.013 K−1). But for more sensitive systems this effect should be considered by adapting the initial pH to the regarding temperature.
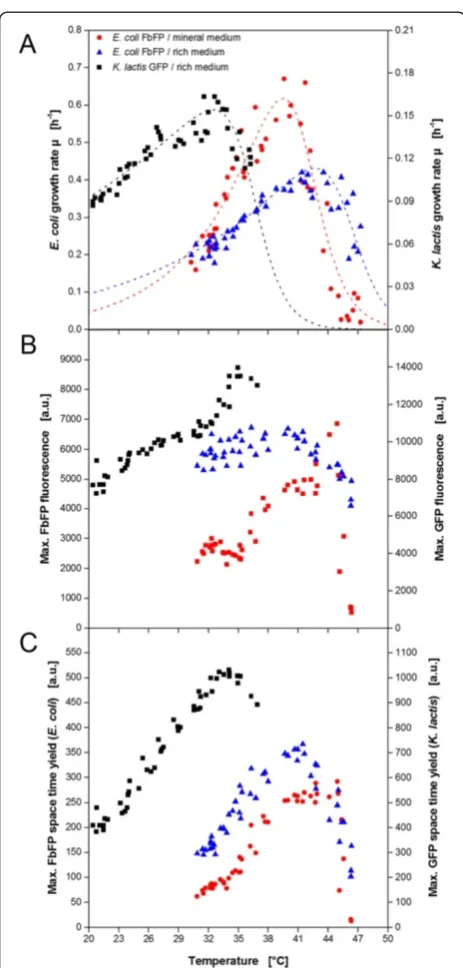
From the before described data sets (Figures 4 and 5) it is already possible to get an idea of the temperature optima for microbial growth and product formation in yeast and bacterial cells. But the high throughput of the MTP yields sufficient data for a more detailed characterization. For biomass formation the maximum growth rate under non-induced conditions was chosen as temperature dependent parameter (Figure 6A). As expected, the bacterial and the yeast system show a different behavior. E. coli in rich TB medium has a maximum growth rate of 0.41 h−1at 43°C. The highest growth rate determined forK. lactisin rich YP medium is 0.16 h−1at 32-33°C. In addition, the growth ofE. coli
in the mineral Wilms-MOPS medium was investigated. Compared to the growth in rich TB medium, a higher maximum growth rate of 0.67 h−1was determined but
at a lower temperature of 39.5°C. The observed values are in good agreement with earlier studies aboutE. coli
[42-45] and Kluyveromyces strains [35,46,47]. For the product formation the maximum product fluorescence
(indicator for product concentration) and the max-imum space time yield were exemplary chosen as char-acteristic values (Figure 6B and C). Again differences between the microbial systems and cultivation media occur.K. lactishas the maximum product fluorescence and highest STY in the same range of 34-35°C which is slightly higher than the temperature for optimal growth.
E. coliexpressing FbFP in the rich auto-induction medium OnEx shows constant high fluorescence values over a rela-tively broad range from 35-42°C before it drops sharply at higher temperatures. The regarding maximum STY was determined at 41°C. For FbFP production in the mineral auto-induction medium the highest values for fluorescence and STY are observed at 44°C and 40-45°C, respectively.
An overview of all determined temperature optima is given in Table 2. The optima for growth and product for-mation are not in agreement for some of the investigated expression systems. Interestingly, even the medium com-position has an influence. Compared to the standard culti-vation temperatures of 30 and 37°C forK. lactisandE. coli, respectively, the determined optima differ to some extent. Consequently, an individual temperature screening is rec-ommended guided by the desired aim of the process.
It is noticed that the measuring points in Figure 6 show some scattering indicating certain measurement inaccuracies. The fluorescence thermometry method has a standard deviation of ±0.76 K (see chapter Temperature profiles) which might be one explanation. Furthermore, it should be considered that the temperature profiles were determined in separate experiments without the microbial reaction system. It was assumed that no significant changes are encountered during cultivations, thereby, neglecting the possibility of produced reaction heat. In fu-ture studies, it should be investigated how fluorescence thermometry can be used directly in the reaction system in order to realize temperature real time monitoring. Nonetheless, the high number of measuring points com-pensates these disadvantages and gives a clear trend.
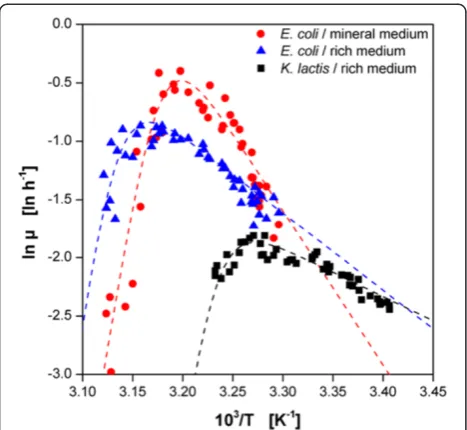
A typical procedure to describe the temperature dependent behavior of microorganisms and (bio-)catalysts is the Arrhenius plot. An extended version of the Arrhenius equation was used for mathematical modeling Figure 6Determination of the optimal temperature for
microbial growth and product formation ofE.coliandK. lactis resulting from temperature profile experiments in MTPs. (A) Temperature dependent growth rate ofE.coli(in rich and mineral medium) andK. lactis(in rich medium) under non-induced conditions. Temperature dependent maximum product formation (B)and maximum STY(C)ofE.coliproducing FbFP (in rich and mineral medium) andK. lactisproducing GFP (in rich medium) under induced conditions. Dotted lines in A indicate Arrhenius fits due to Eq. 1.
Table 2 Temperature optima for growth and recombinant
protein expression ofE. coli(in rich and mineral medium)
andK. lactis(in rich medium) under non-induced (ni) and auto-induced (ai) conditions
Temperature optimum
Expression system Growth Product concentration
Product STY
E. coli(rich medium) 42°Cni, 43°Cai 35-42°Cai 41°Cai
E. coli(mineral medium)
40.5°Cni, 41.5°Cai 43-44°Cai 40-45°Cai
(Eq. 1). Thereby, the numerator is the classical Arrhenius equation with the numerical constant A and the activation energy Eg describing the typical increase of the growth rate or catalyst activity with increasing temperatures. Assuming that proteins are temperature-denatured and inactivated by a reversible chemical reaction with free energy change (ΔGd), the nominator describes the behavior beyond the temperature optimum due to the Hougen-Watson expression for catalyst activity [25]. In Figure 7 the data from Figure 6A for the microbial growth ofE. coliandK. lactiswas plotted logarithmic-ally over the reciprocal absolute temperature.
vmax ¼ A exp −Eg=RT
1 þ B expð−ΔGd=RTÞ ð1Þ
By solving Eq. 1 in MS Excel, the parameters for the different investigated microbial systems were determined (Table 3). The model fit for E. coli in rich TB medium
reveals an activation energy of 55 kJ mol−1which is in very good agreement with earlier reports [42-44]. Inter-estingly, E. coli in the mineral Wilms-MOPS medium shows a much higher value compared to that in TB medium.K. lactis shows a lower value of 34.5 kJ mol−1. Literature values for Kluyveromyces strains range from 36.6 to 85.2 kJ mol−1[35,46,47]. In contrast to the acti-vation, the deactivation behavior indicated by ΔGd is similar for all organisms and media.
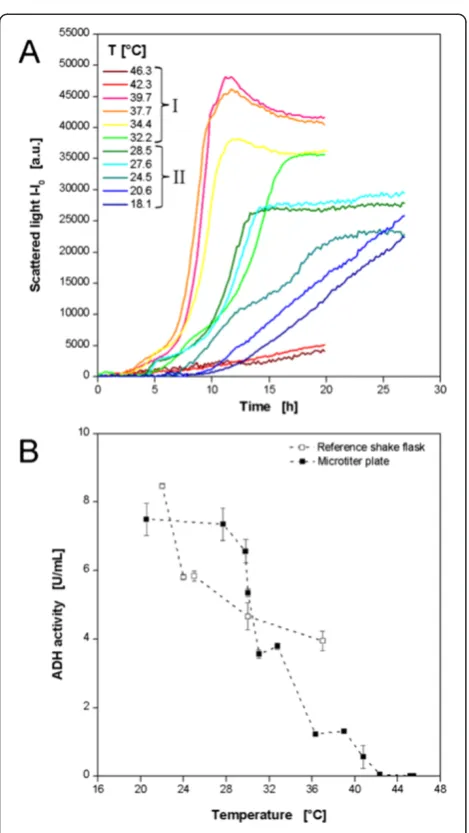
As an additional expression systemE. coliproducing a recombinant alcohol dehydrogenase A from Rhodococcus ruber(ADH-A) was investigated regarding its temperature behavior. In order to look at a broader temperature range, two experimental sets were performed applying a low and a high temperature profile according to Figure 3B and D, respectively. In this way, temperatures of 18.1-46.3°C were realized. To avoid excess evaporation at higher tempera-tures the cultivation was aborted after 20 h when all cultures had entered the stationary phase. The low temperature profile was applied for 27 h. The biomass formation was followed on-line by scattered light meas-urement (Figure 8A). As discussed before, the typical growth behavior ofE. coliin the auto-induction medium OnEx is observed at temperatures of 27.6-39.7°C. After a temperature dependentlag phase of 2–4.5 h a first ex-ponential growth is observed. The subsequent growth inhibition indicated by decreasing slopes of the scat-tered light curves after 4–7 h was caused by the meta-bolic burden of recombinant ADH-A expression. As seen for E. coli expressing FbFP this growth inhibited production phase takes longer at lower temperatures, e.g. 2 h at 39.7°C and 4 h at 27.6°C. When cells recover from that metabolic load a second exponential increase occurs before the stationary phase is reached. At tem-peratures below 27.6°C the microbial growth becomes more linear so that product formation is not the prior growth inhibitor, but the temperature. At temperatures higher than 39.7°C almost no growth is detected.
Indicator for the product formation was the volumetric ADH-A activity at the end of the cultivation (Figure 8B). An on-line signal was not available and sampling during the cul-tivation was not possible. Furthermore, the cell suspensions of three wells had to be pooled to have sufficient volume for the enzyme activity assay. Thereby, the information about
Table 3 Arrhenius model parameters in Eq. 1 for the yeastK. lactis, the bacteriumE. coliand the cellulase preparation
Celluclast
Parameter E. coli E. coli K. lactis Celluclast
(TB medium) (Wilms-MOPS) (YP medium)
Eg [kJ mol− 1
] 55 110 34.5 29
ΔGd [kJ mol− 1
] 549 548 539 579
A [h−1] 6 · 108 1.85 · 1018 1.3 · 105 1.2 · 104 B 7 · 1089 9 · 1090 9 · 1090 8 · 1090
the respective well temperature was beneficial for combining wells of similar temperature. The results of the MTP experi-ments show a clear trend of increasing volumetric enzyme activities with decreasing temperatures. Maximum values of 7.4 U mL−1were measured at 20-28°C. At the highest tem-peratures of 42.3 and 45.5°C no product activity was
detected. This correlates very well with the on-line bio-mass signal where almost no growth occurred in this temperature range (comp. Figure 8A). Taking growth and product formation results together into consider-ation, a certain trend becomes obvious. Higher temper-atures (if not too high) favor bacterial growth but reduce product formation, whereas, at low temperatures the be-havior is vice versa. The reference values from the shake flask cultivations do not completely reflect the MTP results. Nevertheless, a similar trend is present with increasing volumetric ADH-A activities at lower temperatures. The maximum activity of 8.5 U mL−1was determined at 22°C.
All these investigations of different microorganisms, expression systems and culture media show how the presented high-throughput temperature profiling helps to find optimal conditions for fermentations. The on-line monitoring feature allows a much more detailed insight to the microbial processes at varied temperature than classical end point analysis, e.g. kinetic parameters such as growth and production rates or space time yields.
Temperature dependence of cellulases
As a candidate for the optimization of enzymatic reactions the commercial cellulase cocktail Celluclast was chosen since it is often used for biomass degradation. The Celluclast cock-tail contains a mixture of several cellulases from the fungus
Trichoderma reesei[48]. In order to follow the enzyme reac-tion on-line, a substrate, namely 4-methylumbelliferyl-β -D-cellobioside (4MUC), was used. It releases the fluorescent dye 4-methylumbelliferone (4MU) when hydrolyzed by cellulases which can be easily detected with a fluores-cence spectrometer. Consequently, the 4MUC assay is commonly used for the high-throughput screening of cellulolytic enzymes [49]. Compared to the microbial sys-tems described before, a higher temperature optimum was expected for the cellulases. Consequently, a profile was chosen providing a higher temperature range of 42-65°C (comp. Figure 3E).
Twelve exemplary curves resulting from the 4MUC hydrolysis by Cellucalst are depicted in Figure 9A, whereby, the fluorescence intensity indicates the forma-tion of the product 4MU. For all condiforma-tions the typical course of enzymatic reactions is observed with a strong increase of the product concentration in the beginning which runs into saturation after a certain time when no substrate is available anymore. The reaction is strongly temperature dependent. The highest reaction rates are observed at 53.2-56.2°C. Consequently, these curves run into saturation already after approx. 3 h. Furthermore, the highest final product concentrations occur at these temperatures. In the temperature ranges above and below reduced reaction rates and extended reaction times for complete substrate conversion are observed. Pure substrate showed a constant signal close to 0 a.u., Figure 8Cultivations ofE.coliBL21 expressing the
thereby, proving that no substrate reacted in the absence of enzyme. In order to quantify the cellulolytic reaction, the 4MU fluorescence signal was calibrated assuming that each cleaving of a 4MUC molecule releases one 4MU molecule (Figure 9B). In this way reaction rates as well as final product concentrations can be calculated.
To evaluate the temperature dependent behavior, the initial reaction rate was chosen as indicator and plotted over the respective temperature (Figure 9C). A max-imum initial rate of 0.295 mmol h−1was determined at 55°C. At the lowest checked temperature of 42°C an ini-tial reaction rate of 0.19 mmol h−1 was found, close to 0.17 mmol h−1 at the highest temperature. A complete enzyme deactivation was not achieved. The optimum temperature is in good agreement with other reports about cellulases [3,50,51]. As for microbial systems, the corresponding Arrhenius plot was plotted from these re-sults (Figure 9D). By fitting the curve in MS Excel, the parameters in Eq. 1 for Celluclast were determined (Table 2). It must be considered, that Celluclast is no
single cellulase but a mixture of endoglucanases (EG), cellobiohydrolases (CBH) andβ-glucosidases (BG). In lit-erature Eg values of 20–32 KJ mol−1 for EGs [52-54], 18–45 KJ mol−1 for CBHs [3,55], and 18–59 KJ mol−1 for BGs [55,56] are reported. The here reported value of 29 KJ mol−1is within these ranges.
It can be stated that the presented high-throughput temperature profiling is a useful tool for enzyme characterization. The technique can easily be applied to other enzyme classes as long as fluorescent assays are available. If necessary, the temperature range can be shifted to either higher or lower levels. Sufficient aeration can be assured as discussed for microbial cultivations. With all these presented features the system allows the in-vestigation of a great variety of biocatalysts: psychro-, meso- or thermophilic; oxygen dependent or not.
Conclusion
systems for rapid determination of temperature dependent behavior are rare. The presented high-throughput screen-ing system for temperature optimization faces this challenge. A novel temperature control system with a customized thermostating block and two thermostats can generate individual temperature profiles in MTPs with relatively simple instrumentation. Three control-ling parameters were identified: Tset,high, Tset,low and RT. For temperature measurement a fluorescent assay with two Rhodamin dyes was established for the use in MTPs which allows the convenient determination of temperature profiles in short time. Applying the high-throughput screening system BioLector which is already commercially available, important process pa-rameters, e.g. biomass and product formation, are moni-tored on-line. The high throughput of the MTP provides sufficient data output for a detailed characterization of temperature dependent behavior. Consequently, the com-bination of the thermostating block, temperature deter-mination via fluorescence thermometry, and an optical on-line monitoring system provides extensive information about temperature dependent process behavior, e.g. con-centrations of biomass or products, growth or reaction rates, space time yields, and others. Representative investi-gations with microbial and enzymatic systems proved the system’s general applicability for various purposes. Thereby, the repetition of the temperature profiles in the MTP rows allows the investigation of several sys-tems in parallel.
During the experiments some potential for improve-ment became apparent, considering heat dissipation to the surroundings, temperature dependent pH changes, evaporation effects, and sufficient oxygen supply. All these issues can be addressed in future work to achieve most precise results.
The MBR-based high-throughput temperature profil-ing is a convenient tool for rapid characterization of temperature dependent reaction processes. It allows the fast investigation of numerous conditions, e.g. microor-ganisms, enzymes, media, and others, in a short time. The simple temperature control combined with a com-mercial on-line monitoring device makes it a user friendly system.
Abbreviations
4MU:4-methylumbellyferone; 4MUC: 4-methylumbellyferyl-cellobioside; A: Numerical constant [h-1]; ADH-A: Alcohol dehydrogenase A from Rhodococcus ruber; B: Numerical constant [-]; BG:β-glucosidase;
CBH: Cellobiohydrolase; Eg: Activation energy [kJ mol-1]; EG: Endoglucanase; FbFP: Flavinmononucleotide-based fluorescent protein; GFP: Green fluorescent protein; I: Measured signal intensity [a.u.]; I0: Initial signal intensity [a.u.]; MBR: Micro-bioreactor; MTP: Microtiter plate; OD600: Optical density at 600 nm [-]; OnEx: Overnight express Instant TB medium; OTR: Oxygen transfer rate [mol L-1h-1]; R: Ideal gas constant ~8.314 [J mol-1K-1]; RAMOS: Respiration activity monitoring system; Rh110: Rhodamin 110; RhB: Rhodamin B; RT: Room temperature [°C]; STY: Space time yield [a.u. mL-1h-1]; T: Absolute temperature [K]; Tmax: Maximum temperature within a temperature profile [°C];
Tmin: Minimum temperature within a temperature profile [°C]; Tset,high: Set point temperature of heating thermostat [°C]; Tset,low: Set point temperature of cooling thermostat [°C]; TB: Terrific broth medium; YP: Yeast peptone medium;
ΔGd: Deactivation energy change [kJ mol-1]; µ: Growth rate [h-1]; µmax: Maximum growth rate [h-1]; vmax: Maximum reaction rate [h-1].
Competing interests
The authors declare that they have no competing interests.
Authors’contributions
MK made the conceptual design of the study and the experimental setup and methods, performed experiments and prepared the manuscript. CL established the fluorescence thermometry assay in MTPs. SD performed ADH-A expression experiments. WK developed the ADH-A expression system inE. coliand provided it for this work. JB assisted with study’s conception, data interpretation and manuscript preparation. All authors read and approved the final manuscript.
Acknowledgements
This work was performed as part of the Cluster of Excellence“Tailor-Made Fuels from Biomass”, which is funded by the Excellence Initiative by the German federal and state governments to promote science and research at German universities. The authors thank Ulrich Commandeur and Thomas Schmidt from the Institute for Molecular Biotechnology of the RWTH Aachen University (Germany) as well as Thomas Drepper and Janko Potzkei from the Institute for Molecular Enzyme Technology at the Heinrich-Heine-University Düsseldorf (Germany) for providing the applied microorganisms. The students Lina Tubes and Konrad Smiglak from RWTH Aachen University and Ana Cláudia Gonçalves da Cruz from the University of Minho (Portugal) are acknowledged for experimental support.
Author details
1AVT-Chair for Biochemical Engineering, RWTH Aachen University,
Worringerweg 1, 52074 Aachen, Germany.2Department of Chemistry (Organic and Bioorganic Chemistry), University of Graz, Heinrichstraße 28/II, 8010 Graz, Austria.
Received: 11 June 2014 Accepted: 28 July 2014 Published: 4 August 2014
References
1. Shuler ML, Kargi F:Bioprocess engineering : basic concepts.2nd edition. Upper Saddle River, NJ: Prentice Hall; 2002.
2. Dragosits M, Frascotti G, Bernard-Granger L, Vazquez F, Giuliani M, Baumann K, Rodriguez-Carmona E, Tokkanen J, Parrilli E, Wiebe MG, Kunert R, Maurer M, Gasser B, Sauer M, Branduardi P, Pakula T, Saloheimo M, Penttila M, Ferrer P, Tutino ML, Villaverde A, Porro D, Mattanovich D:Influence of growth temperature on the production of antibody fab fragments in different microbes: A host comparative analysis.Biotechnol Prog2011,27:38–46. 3. Pardo AG, Forchiassin F:Influence of temperature and pH on cellulase activity
and stability in Nectria catalinensis.Rev Argent Microbiol1999,31:31–35. 4. Rachinskiy K, Schultze H, Boy M, Bornscheuer U, Büchs J:“Enzyme Test
Bench,”a high-throughput enzyme characterization technique including the long-term stability.Biotechnol Bioeng2009,103:305–322.
5. Zakhartsev MV, Portner HO, Blust R:Environmentally low-temperature kinetic and thermodynamic study of lactate dehydrogenase from Atlantic cod (G-morhua) using a 96-well microplate technique.Anal Biochem2004,
330:10–20.
6. Schäpper D, Alam MN, Szita N, Eliasson Lantz A, Gernaey KV:Application of microbioreactors in fermentation process development: a review.Anal Bioanal Chem2009,395:679–695.
7. Vervliet-Scheebaum M, Ritzenthaler R, Normann J, Wagner E:Short-term effects of benzalkonium chloride and atrazine on Elodea canadensis using a miniaturised microbioreactor system for an online monitoring of physiologic parameters.Ecotoxicol Environ Saf2008,69:254–262. 8. van Leeuwen M, Heijnen JJ, Gardeniers H, Oudshoorn A, Noorman H, Visser J,
9. Rachinskiy K, Kunze M, Graf C, Schultze H, Boy M, Büchs J:Extension and Application of the“Enzyme Test Bench”for Oxygen Consuming Enzyme Reactions.Biotechnol Bioeng2014,111:244–253.
10. Zanzotto A, Szita N, Boccazzi P, Lessard P, Sinskey AJ, Jensen KF:
Membrane-aerated microbioreactor for high-throughput bioprocessing.
Biotechnol Bioeng2004,87:243–254.
11. Zhang ZY, Grattan KTV, Palmer AW:Fiber optic thermometry based on fluorescence lifetimes of Cr-3+ doped materials.Second Int Symp Meas Technol Intelligent Instrum, Pts 1 and 21993,2101:476–482.
12. Hoogenboom R, Fijten MWM, Brandli C, Schroer J, Schubert US:Automated parallel temperature optimization and determination of activation energy for the living cationic polymerization of 2-ethyl-2-oxazoline.
Macromol Rapid Commun2003,24:98–103.
13. Krommenhoek EE, van Leeuwen M, Gardeniers H, van Gulik WM, van den Berg A, Li X, Ottens M, van der Wielen LA, Heijnen JJ:Lab-scale
fermentation tests of microchip with integrated electrochemical sensors for pH, temperature, dissolved oxygen and viable biomass
concentration.Biotechnol Bioeng2008,99:884–892.
14. Lee HLT, Boccazzi P, Ram RJ, Sinskey AJ:Microbioreactor arrays with integrated mixers and fluid injectors for high-throughput experimentation with pH and dissolved oxygen control.Lab Chip2006,
6:1229–1235.
15. Maharbiz MM, Holtz WJ, Howe RT, Keasling JD:Microbioreactor arrays with parametric control for high-throughput experimentation.Biotechnol Bioeng2004,85:376–381.
16. Li X, van der Steen G, van Dedem GWK, van der Wielen LAM, van Leeuwen M, van Gulik WM, Heijnen JJ, Krommenhoek EE, Gardeniers JGE, van den Berg A, Ottens M:Improving mixing in microbioreactors.Chem Eng Sci2008,
63:3036–3046.
17. Boccazzi P, Zhang Z, Kurosawa K, Szita N, Bhattacharya S, Jensen KF, Sinskey AJ:
Differential gene expression profiles and real-time measurements of growth parameters in Saccharomyces cerevisiae grown in microliter-scale bioreactors equipped with internal stirring.Biotechnol Prog2006,22:710–717. 18. Liu LY, Peng SL, Niu XZ, Wen WJ:Microheaters fabricated from a
conducting composite.Appl Phys Lett2006,89.
19. Yamamoto T, Nojima T, Fujii T:PDMS-glass hybrid microreactor array with embedded temperature control device. Application to cell-free protein synthesis.Lab Chip2002,2:197–202.
20. Fernicola VC, Zhang ZY, Grattan KTV:Investigation of Cr-fluorescence in olivine crystals with potential in fibre optic thermometry.Sensors and Their Applications Viii1997,:367–372.
21. Sakakibara J, Adrian RJ:Whole field measurement of temperature in water using two-color laser induced fluorescence.Exp Fluids1999,26:7–15. 22. Sun T, Zhang ZY, Grattan KTV, Palmer AW, Collins SF:Temperature
dependence of the fluorescence lifetime in Pr3+:ZBLAN glass for fiber optic thermometry.Rev Sci Instrum1997,68:3447–3451.
23. Kensy F, Zang E, Faulhammer C, Tan RK, Buchs J:Validation of a high-throughput fermentation system based on online monitoring of biomass and fluorescence in continuously shaken microtiter plates.Microb Cell Factories2009,8:31. 24. Samorski M, Müller-Newen G, Büchs J:Quasi-continuous combined
scattered light and fluorescence measurements: A novel measurement technique for shaken microtiter plates.Biotechnol Bioeng2005,92:61–68. 25. Roels JA:Energetics and kinetics in biotechnology. Amsterdam.New York:
Elsevier Biomedical Press; 1983.
26. Scheidle M, Klinger J, Buchs J:Combination of on-line pH and oxygen transfer rate measurement in shake flasks by fiber optical technique and Respiration Activity Monitoring System (RAMOS).Sensors2007,7:3472–3480. 27. Wilms B, Hauck A, Reuss M, Syldatk C, Mattes R, Siemann M, Altenbuchner J:
High-cell-density fermentation for production of L-N-carbamoylase using an expression system based on the Escherichia coli rhaBAD promoter.
Biotechnol Bioeng2001,73:95–103.
28. Hahn-Hagerdal B, Karhumaa K, Larsson CU, Gorwa-Grauslund M, Gorgens J, van Zyl WH:Role of cultivation media in the development of yeast strains for large scale industrial use.Microb Cell Factories2005,4:31. 29. Anderlei T, Büchs J:Device for sterile online measurement of the oxygen
transfer rate in shaking flasks.Biochem Eng J2001,7:157–162. 30. Anderlei T, Zang W, Papaspyrou M, Büchs J:Online respiration activity
measurement (OTR, CTR, RQ) in shake flasks.Biochem Eng J2004,17:187–194. 31. Losen M, Frolich B, Pohl M, Buchs J:Effect of oxygen limitation and
medium composition on Escherichia coli fermentation in shake-flask cultures.Biotechnol Prog2004,20:1062–1068.
32. Duetz WA, Witholt B:Effectiveness of orbital shaking for the aeration of suspended bacterial cultures in square-deepwell microtiter plates.
Biochem Eng J2001,7:113–115.
33. Kensy F, Zimmermann HF, Knabben I, Anderlei T, Trauthwein H, Dingerdissen U, Buchs J:Oxygen transfer phenomena in 48-well microtiter plates: Determination by optical monitoring of sulfite oxidation and verification by real-time measurement during microbial growth.Biotechnol Bioeng 2005,89:698–708.
34. Maier U, Losen M, Buchs J:Advances in understanding and modeling the gas–liquid mass transfer in shake flasks.Biochem Eng J2004,17:155–167. 35. Rajoka MI, Khan S, Latif F, Shahid R:Influence of carbon and nitrogen
sources and temperature on hyperproduction of a thermotolerant beta-glucosidase from synthetic medium by Kluyveromyces marxianus.
Appl Biochem Biotechnol2004,117:75–92.
36. Senez JC:Some considerations on energetics of bacterial growth.
Bacteriol Rev1962,26:95.
37. Kunze M, Huber R, Gutjahr C, Mullner S, Buchs J:Predictive tool for recombinant protein production in Escherichia coli shake-flask cultures using an on-line monitoring system.Biotechnol Prog2012,28:103–113. 38. Kunze M, Roth S, Gartz E, Buchs J:Pitfalls in optical on-line monitoring for
high-throughput screening of microbial systems.Microb Cell Fact2014,13:53. 39. Chalmers JJ, Kim E, Telford JN, Wong EY, Tacon WC, Shuler ML, Wilson DB:
Effects of temperature on Escherichia coli overproducing beta-lactamase or human epidermal growth factor.Appl Environ Microbiol1990,56:104–111. 40. Hedhammar M, Stenvall M, Lonneborg R, Nord O, Sjolin O, Brismar H, Uhlen M,
Ottosson J, Hober S:A novel flow cytometry-based method for analysis of expression levels in Escherichia coli, giving information about precipitated and soluble protein.J Biotechnol2005,119:133–146.
41. Lavergne-Mazeau F, Maftah A, Cenatiempo Y, Julien R:Linear correlation between bacterial overexpression of recombinant peptides and cell light scatter.Appl Environ Microbiol1996,62:3042–3046.
42. Herendeen SL, Vanbogelen RA, Neidhardt FC:Levels of major proteins of Escherichia coli during growth at different temperatures.J Bacteriol1979,
139:185–194.
43. Johnson FH, Lewin I:The growth rate of E. coli in relation to temperature, quinine and coenzyme.J Cell Comp Physiol1946,28:47–75.
44. Mohr PW, Krawiec S:Temperature characteristics and Arrhenius plots for nominal psychrophiles, mesophiles and thermophiles.J Gen Microbiol 1980,121:311–317.
45. Ratkowsky DA, Olley J, Mcmeekin TA, Ball A:Relationship between temperature and growth-rate of bacterial cultures.J Bacteriol1982,149:1–5.
46. Rajoka MI, Khan S, Shahid R:Kinetics and regulation studies of the production of beta-galactosidase from Kluyveromyces marxianus grown on different substrates.Food Technol Biotechnol2003,
41:315–320.
47. Toyoda T, Ohtaguchi K:Effect of temperature on D-arabitol production from lactose by Kluyveromyces lactis.J Indust Microbiol Biotechnol2011,
38:1179–1185.
48. Jäger G, Wu ZJ, Garschhammer K, Engel P, Klement T, Rinaldi R, Spiess AC, Büchs J:Practical screening of purified cellobiohydrolases and endoglucanases with alpha-cellulose and specification of hydrodynamics.
Biotech Biofuels2010,3:18.
49. Ko KC, Han Y, Cheong DE, Choi JH, Song JJ:Strategy for screening metagenomic resources for exocellulase activity using a robotic, high-throughput screening system.J Microbiol Methods2013,94:311–316. 50. Karlsson J, Siika-aho M, Tenkanen M, Tjerneld F:Enzymatic properties of
the low molecular mass endoglucanases Cel12A (EG III) and Cel45A (EG V) of Trichoderma reesei.J Biotechnol2002,99:63–78.
51. Krishna SH, Rao KCS, Babu JS, Reddy DS:Studies on the production and application of cellulase from Trichoderma reesei QM-9414.Bioprocess Eng 2000,22:467–470.
52. Busto MD, Ortega N, Perez-Mateos M:Characterization of microbial endo-beta-glucanase immobilized in alginate beads.Acta Biotechnol 1998,18:189–200.
53. Saqib AA, Farooq A, Iqbal M, Hassan JU, Hayat U, Baig S:A thermostable crude endoglucanase produced by Aspergillus fumigatus in a novel solid state fermentation process using isolated free water.Enzyme Res 2012,2012:196853.
55. Steinweg JM, Jagadamma S, Frerichs J, Mayes MA:Activation energy of extracellular enzymes in soils from different biomes.PLoS One2013,
8:e59943.
56. Siddiqui KS, Saqib AAN, Rashid MH, Rajoka MI:Carboxyl group modification significantly altered the kinetic properties of purified carboxymethylcellulase from Aspergillus niger.Enzym Microb Technol 2000,27:467–474.
doi:10.1186/1754-1611-8-22
Cite this article as:Kunzeet al.:Minireactor-based high-throughput temperature profiling for the optimization of microbial and enzymatic processes.Journal of Biological Engineering20148:22.
Submit your next manuscript to BioMed Central and take full advantage of:
• Convenient online submission • Thorough peer review
• No space constraints or color figure charges • Immediate publication on acceptance
• Inclusion in PubMed, CAS, Scopus and Google Scholar
• Research which is freely available for redistribution