www.geosci-model-dev.net/10/1321/2017/ doi:10.5194/gmd-10-1321-2017
© Author(s) 2017. CC Attribution 3.0 License.
Data-mining analysis of the global distribution of soil carbon in
observational databases and Earth system models
Shoji Hashimoto1, Kazuki Nanko1, Boris ˇTupek2, and Aleksi Lehtonen2
1Forestry and Forest Products Research Institute (FFPRI), Tsukuba, Japan 2Natural Resources Institute Finland, Latokartanonkaari 9, Helsinki, Finland
Correspondence to:Shoji Hashimoto ([email protected]) Received: 27 May 2016 – Discussion started: 30 June 2016
Revised: 8 February 2017 – Accepted: 28 February 2017 – Published: 28 March 2017
Abstract. Future climate change will dramatically change the carbon balance in the soil, and this change will affect the terrestrial carbon stock and the climate itself. Earth sys-tem models (ESMs) are used to understand the current cli-mate and to project future clicli-mate conditions, but the soil organic carbon (SOC) stock simulated by ESMs and those of observational databases are not well correlated when the two are compared at fine grid scales. However, the specific key processes and factors, as well as the relationships among these factors that govern the SOC stock, remain unclear; the inclusion of such missing information would improve the agreement between modeled and observational data. In this study, we sought to identify the influential factors that gov-ern global SOC distribution in observational databases, as well as those simulated by ESMs. We used a data-mining (machine-learning) (boosted regression trees – BRT) scheme to identify the factors affecting the SOC stock. We applied BRT scheme to three observational databases and 15 ESM outputs from the fifth phase of the Coupled Model Intercom-parison Project (CMIP5) and examined the effects of 13 vari-ables/factors categorized into five groups (climate, soil prop-erty, topography, vegetation, and land-use history). Globally, the contributions of mean annual temperature, clay content, carbon-to-nitrogen (CN) ratio, wetland ratio, and land cover were high in observational databases, whereas the contribu-tions of the mean annual temperature, land cover, and net primary productivity (NPP) were predominant in the SOC distribution in ESMs. A comparison of the influential fac-tors at a global scale revealed that the most distinct differ-ences between the SOCs from the observational databases and ESMs were the low clay content and CN ratio contribu-tions, and the high NPP contribution in the ESMs. The results
of this study will aid in identifying the causes of the current mismatches between observational SOC databases and ESM outputs and improve the modeling of terrestrial carbon dy-namics in ESMs. This study also reveals how a data-mining algorithm can be used to assess model outputs.
1 Introduction
Soil is the largest organic carbon stock in terrestrial ecosys-tems (Batjes, 1996; IPCC, 2013; Köchy et al., 2015). The soil organic carbon (SOC) stock represents a balance between carbon inputs to soil and carbon losses from soil via decom-position and dissolved organic carbon, and this influx and efflux of soil carbon is controlled directly and indirectly by environmental conditions (Carvalhais et al., 2014; Schimel et al., 1994). Future climate change will dramatically affect the global soil carbon balance (Bond-Lamberty and Thom-son, 2010; Crowther et al., 2016; Friedlingstein et al., 2006; Hashimoto et al., 2011, 2015), and this change will affect ter-restrial carbon and consequently the climate itself (Cox et al., 2000; Zaehle, 2013).
the land carbon sink in ESM simulations (Friedlingstein et al., 2014).
Observational global soil databases are often used as benchmarks to examine whether ESMs successfully describe the global distribution of soil carbon stocks (Anav et al., 2013; Hararuk et al., 2014; Todd-Brown et al., 2013; Wieder et al., 2014). Several global soil databases have been de-veloped over the past two decades, and several are un-dergoing further improvement (Scharlemann et al., 2014). Certain databases describe the global distribution of soil physiochemical properties and enable calculations of the global distribution of SOC stocks (e.g., Harmonized World Soil Database – HWSD), whereas others provide SOC stocks by default (e.g., International Geosphere Biosphere Programme’s (IGBP) Data and Information System (DIS) database). These databases incorporate observed data points with global coverage, although there are biases in the spatial distribution or density of the data points. In these databases, gridded SOC data have been generated by linking the soil properties to soil maps or by inter-extrapolating the model outputs derived from analyses of observed SOC data points. Compared with the SOC distribution derived from ESMs, SOC estimates derived from SOC observations are more data oriented; however, even the observational databases include significant uncertainty because of errors in the source data and building processes (Köchy et al., 2015; Todd-Brown et al., 2013).
A recent study (Todd-Brown et al., 2013) found that al-though ESM results are moderately consistent at the biome level, the correlation between the distribution of soil carbon stocks simulated by ESMs and observational databases is poor when the two are compared at fine scales (e.g., a 1◦
scale). Furthermore, estimates of SOC by ESMs and terres-trial biosphere models exhibit high uncertainty (Nishina et al., 2014, 2015; Tian et al., 2015). Several studies have ex-amined the cause of the inconsistency in data derived by observational databases and ESMs, and the high variation of SOC outputs from ESMs (Exbrayat et al., 2013; Todd-Brown et al., 2013; Wieder et al., 2013). Todd-Todd-Brown et al. (2013) analyzed the soil carbon outputs from 11 ESMs from the fifth phase of the Coupled Model Intercomparison Project (CMIP5) and soil carbon data from the HWSD, and found that net primary productivity (NPP) and temperature could explain the SOC spatial variations in the ESM out-put but not in the HWSD outout-put. These authors also found that the differences in SOC from the ESMs were driven by differences in the simulated NPP and the parameterization of soil heterotrophic respiration and not by differences in the soil model structure of the ESMs. The key influence of parameterizing soil heterotrophic respiration (e.g., turnover time) on SOC in the CMIP5 ESM has also been discussed by Exbrayat et al. (2013). Anav et al. (2013) examined the rela-tionships between simulated SOC and vegetation carbon and compared them with reference data obtained from observa-tional databases, and they found that although simulated
val-ues clustered around the reference valval-ues, the ratio of SOC to vegetation carbon differed among the models. This find-ing suggests that the parameterization of plant production, mortality, and decomposition vary greatly among ESMs. More realistic representations of turnover times (Koven et al., 2015) and focusing on the model treatment of the hy-drological cycle on the carbon cycle (Shao et al., 2013) are suggested as future improvements.
Despite these research results, the key processes and fac-tors that govern the SOC stock and the relationships among them remain unclear. The appropriate inclusion of these pro-cesses/factors would improve the consistency between the model results and observational data. In this study, we sought to identify the key factors that govern the global SOC dis-tribution in observational databases as well as those simu-lated by ESMs. We applied a data-mining (machine-learning) scheme (boosted regression trees – BRT) to identify the in-fluential factors and explore how they relate to SOC stocks (Elith et al., 2008). The BRT method is based on regres-sion trees and boosting. We combined the potentially in-fluential variables from many data products and SOC data from observational databases and ESMs, and examined the factors influencing the distribution of SOC and the relation-ships between these factors and SOC stocks. We assessed how closely ESMs could match the influential factors and their relationships with factors obtained from observational databases. By comparing the influential factors in the obser-vational databases with those in the ESMs, we clarified the model–data discrepancies and the areas in which ESMs can be improved.
2 Materials and methods
2.1 Observational global SOC database
60˚ S 0˚ 60˚ N
(a) HWSD
60˚ S 0˚ 60˚ N
(b) IGBP−DIS
180˚ 90˚ W 0˚ 90˚ E 180˚
60˚ S 0˚ 60˚ N
0 20 40 60 80 100
kg C m−2
(c) NCSCD
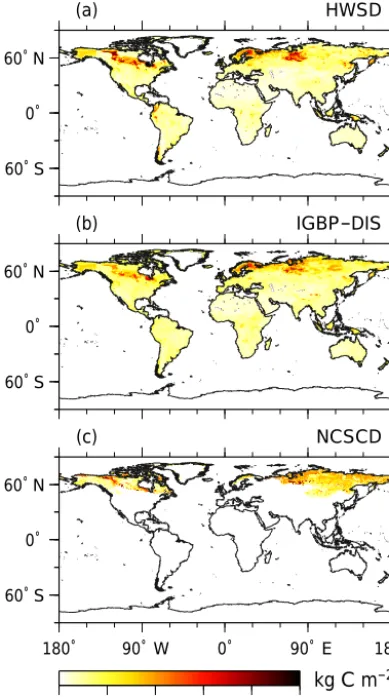
Figure 1.Soil carbon stock in the upper 100 cm (kg C m−2)from the observational databases (HWSD, IGBP-DIS, and NCSCD).
2000) (Fig. 1b), which contains gridded soil physiochemical properties. The database has been developed by the Global Soil Data Task Group of the International Geosphere Bio-sphere Programme’s (IGBP) Data and Information System (DIS), and the database was generated by linking the pedon records in the Global Pedon Database to the FAO/UNESCO digital soil map of the world. The third database was the Northern Circumpolar Soil Carbon Database, version 2 (NC-SCD) (Hugelius et al., 2013; Tarnocai et al., 2009) (Fig. 1c). This database is a spatial database of SOC stock of the north-ern circumpolar permafrost region. The soil map data were obtained from different regions/countries (USA, Canada, Russia, etc.) and were harmonized. The NCSCD were based on 1778 pedon data points.
We used the HWSD and IGBP-DIS to analyze the global distribution of SOC stocks; then, we extracted a database of northern circumpolar regions from the three above databases and analyzed the SOC stocks in the northern region. The re-lationships among the databases are shown in Fig. S1 in the
Supplement. The SOC in the upper 100 cm in each database was used.
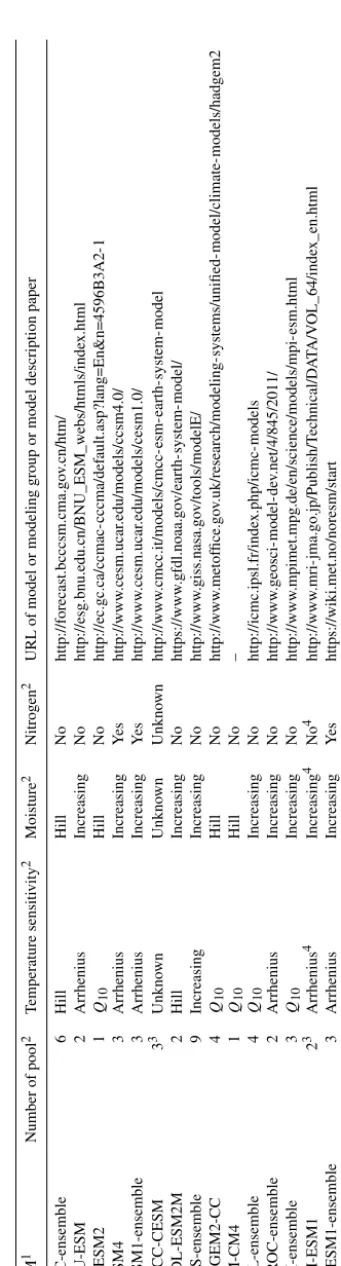
2.2 Global SOC estimated using Earth system models The global distribution of SOC stocks estimated by ESMs was obtained from CMIP5. We examined the results of 15 ESMs (Fig. 2; Table 2). When more than one result was ob-tained by the same model family (e.g., MIROC-ESM and MIROC-ESM-CHEM), we generated an ensemble average database for each family (e.g., average of MIROC-ESM and MIROC-ESM-CHEM): Todd-Brown et al. (2013) showed through a hierarchical cluster analysis that SOC distributions were very similar among ESMs from the same climate cen-ter. The mean values from 1980–2004 were calculated. The results of the historical and ensemble member r1i1p1 were used in this study. The notation “r1i1p1” is an identifier of the model simulation and is an ensemble member that is often used for analyses (Chang et al., 2012; Dirmeyer et al., 2013; Jiang et al., 2015; Kumar et al., 2014). The overviews of SOC submodels in the ESMs have been previously described (Exbrayat et al., 2014; Todd-Brown et al., 2013, 2014) and are also shown in Table 2. In general, each soil submodel consisted of one to nine pools and incorporated the effects of temperature and moisture. Some ESMs have litter carbon pools; these were excluded from this study. A comparison be-tween the mean of ESMs and global observational databases in a 1◦grid is shown in Fig. S2.
2.3 Other databases
60˚ S 0˚ 60˚ N
(a) BCC−ensemble (b) BNU−ESM (c) CanESM2
60˚ S 0˚ 60˚ N
(d) CCSM4 (e) CESM1−ensemble (f) CMCC−CESM
60˚ S 0˚ 60˚ N
(g) GFDL−ESM2M (h) GISS−ensemble (i) HadGEM2−CC
60˚ S 0˚ 60˚ N
(j) INM−CM4 (k) IPSL−ensemble (l) MIROC−ensemble
180˚ 90˚ W 0˚ 90˚ E 180˚
60˚ S 0˚ 60˚ N
(m) MPI−ensemble
180˚ 90˚ W 0˚ 90˚ E 180˚
0 20 40 60 80 100
kg C m−2
(n) MRI−ESM1
180˚ 90˚ W 0˚ 90˚ E 180˚
(o) NorESM1−ensemble
Figure 2.Soil carbon stocks (kg C m−2)from Earth system models (CMIP5). The term “ensemble” indicates the result of an ensemble of family members.
2.4 Database handling
All global databases, except for the databases with a spa-tial resolution of 1◦by default, including observational and
ESM model outputs, were regridded to a spatial resolution of 1◦for the analyses. Regridding of data in the NetCDF for-mat was performed using the Clifor-mate Data Operators (CDO) software, version 1.6.9, provided by the Max Plank Institute for Meteorology (https://code.zmaw.de/projects/cdo). A bi-linear interpolation, which is one of the most widely used algorithms, was used (remapbil in CDO).
2.5 Boosted regression trees (BRT) scheme
To identify the influential factors and their relationships with SOC stocks, BRT scheme was used in this study (Elith et al., 2008). This technique involves a data-mining (machine-learning) algorithm that combines the advantages of a regres-sion tree (deciregres-sion tree) algorithm and boosting. Regresregres-sion
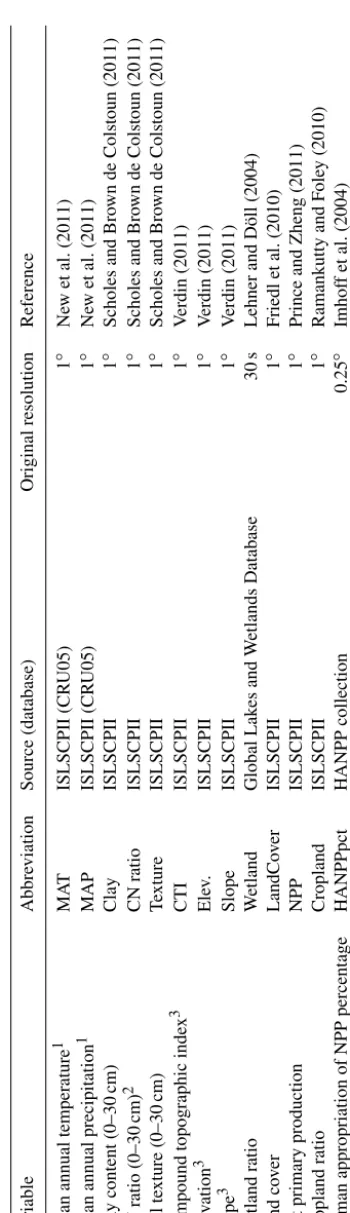
T able 1. V ariables used in the analyses and their sources. V ariable Abbre viation Source (database) Original resolution Reference Mean annual temperature 1 MA T ISLSCPII (CR U05) 1 ◦ Ne w et al. (2011) Mean annual precipitation 1 MAP ISLSCPII (CR U05) 1 ◦ Ne w et al. (2011) Clay content (0–30 cm) Clay ISLSCPII 1 ◦ Scholes and Bro wn de Colstoun (2011) CN ratio (0–30 cm) 2 CN ratio ISLSCPII 1 ◦ Scholes and Bro wn de Colstoun (2011) Soil te xture (0–30 cm) T exture ISLSCPII 1 ◦ Scholes and Bro wn de Colstoun (2011) Compound topographic inde x 3 CTI ISLSCPII 1 ◦ V erdin (2011) Ele v ation 3 Ele v. ISLSCPII 1 ◦ V erdin (2011) Slope 3 Slope ISLSCPII 1 ◦ V erdin (2011) W etland ratio W etland Global Lak es and W etlands Database 30 s Lehner and Döll (2004) Land co v er LandCo v er ISLSCPII 1 ◦ Friedl et al. (2010) Net primary production NPP ISLSCPII 1 ◦ Prince and Zheng (2011) Cropland ratio Cropland ISLSCPII 1 ◦ Ramankutty and F ole y (2010) Human appropriation of NPP percentage HANPPpct HANPP collection 0.25 ◦ Imhof f et al. (2004) 1The original database pro vides monthly data. Annual means were calculated by the authors. 2The CN ratio w as calculated by di viding the carbon density by the nitrogen density . 3The nati v e dat abase is h ydro1k, and its resolution is 1 km. The mean v alue of 1 km w as used in this study .
We used the open-source BRT package (brt.functions.R) in R software versions 3.2.1 and 3.2.2 (R Core team, 2013) developed by Elith et al. (2008). The R code for the BRT al-gorithm is available in the supplementary material of Elith et al. (2008). The gbm package was used (version 2.1.1) to run the BRT package. The calculations were performed in Mac OS X (version 10.9.5 and version 10.10.5). To do so, the “windows” function in the “brt.functions.R” needed to be replaced with the “quartz” function in R. In practice, three parameters in the BRT package – the learning rate (lr), tree complexity (tc), and bag fraction (bg) – control the BRT per-formance. Thelr determines the contribution of each tree, thetccontrols the number of splits, and thebgis the propor-tion of data selected at each step. The number of trees was determined using the cross-validation method in the R pack-age. The maximum number of trees was set to 15 000. Thetc
value was set to 5. We tested differentlr(0.001, 0.005, 0.01, 0.05, 0.1) andbgvalues (0.5, 0.6, 0.7) and used the best pa-rameter set for each database, but the changes in papa-rameter values had little effect on the model performance.
2.6 Model performance
The goodness of fit between the BRT model and data was assessed by using the linear relationship between the pre-dicted and observed values, the coefficient of determination (R2), and the root mean square error (RMSE); it is shown in Tables S2 and S3 in the Supplement. For both the obser-vational databases and ESM databases, the BRT models ex-hibited good performance, with highR2 values in most of the databases, but the performance was relatively lower for NCSCD and CMCC (northern soils).
3 Results
3.1 Observational databases 3.1.1 Global soil
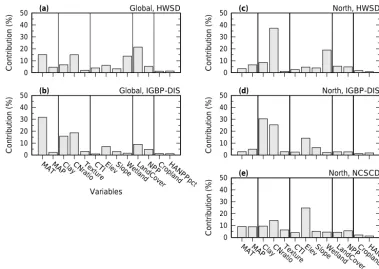
The relative contributions of variables in the BRT model of global SOC stocks to the observational databases are shown in Fig. 3a and b. In HWSD, the contributions of land cover, mean annual temperature, CN ratio, and wetland ratio were high. For IGBP-DIS, the mean annual temperature, followed by clay content, CN ratio, and land cover also highly con-tributed. In particular, the mean annual temperature was very influential. The contribution of elevation to each HWSD and IGBP-DIS was 6 and 7 %, respectively. The NPP contributed 5 % in both databases.
0 10 20 30 40
50 (a) Global, HWSD
Contribution (%)
0 10 20 30 40 50
MATMAPClayCNratioTextureCTI ElevSlopeWetlandLandCoverNPPCroplandHANPPpct
(b) Global, IGBP-DIS
Contribution (%)
Variables
0 10 20 30 40
50 (c) North, HWSD
Contribution (%)
0 10 20 30 40
50 (d) North, IGBP-DIS
Contribution (%)
0 10 20 30 40 50
MATMAPClayCNratioTextureCTI ElevSlopeWetlandLandCoverNPPCroplandHANPPp
ct
(e) North, NCSCD
Contribution (%)
Variables
Figure 3.Relative contribution (influence) of predictive variables for the model of soil carbon stocks in the global observational databases (left) and northern observational databases (right).
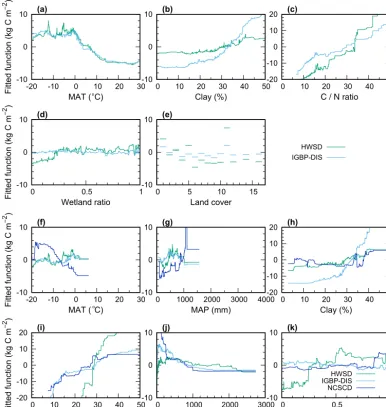
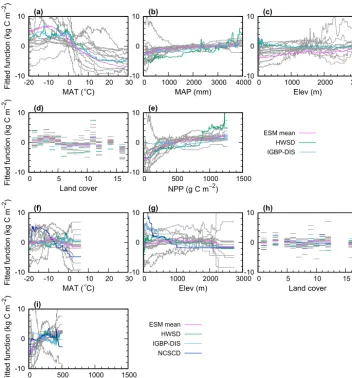
ratio (Fig. 4b and c). The SOC increased rapidly with an in-creasing CN ratio. Relationships with the mean annual tem-perature were similar (Fig. 4a). The relationship with clay was steeper in IGBP-DIS than in HWSD, but the opposite was true for the CN ratio (Fig. 4b and c). With respect to land cover, evergreen needleleaf forests and permanent wetlands had higher SOC (Fig. 4e).
3.1.2 Northern soils
In the northern region, the dominant contributors differed among northern soil databases and from those identified in the global database analyses described above (Fig. 3c–e). In HWSD, the CN ratio was the dominant contributor, followed by the wetland ratio, clay content, and mean annual precip-itation. In IGBP-DIS, clay content, CN ratio, and elevation were the most important contributors. For NCSCD, elevation contributed the most (∼25 %), but all of the variables except for the cropland ratio and HANPPpct contributed 5–15 %. The mean annual temperature was not as influential as the global databases.
The relationships between variables and SOC stock varied more among the databases for northern soils than those of global databases (Fig. 4f–k). Furthermore, because the north-ern regions were extracted, the ranges of variables were nar-rower than the global databases. In NCSCD, the SOC de-creased with increasing temperature (Fig. 4f) and inde-creased with increasing precipitation (Fig. 4g). The SOC increased
with increasing clay content and CN ratio in HWSD and IGBP-DIS (Fig. 4h and i), which was consistent with the findings obtained from the global databases. The increasing trend with increasing CN ratio was also observed in NC-SCD. The SOC decreased with increasing elevation in all databases but showed considerable variability at low eleva-tions (Fig. 4j).
3.2 Earth system models 3.2.1 Global soil
The contributions of some variables varied among ESMs, but the mean of the results of the ESMs showed that the mean annual temperature, land cover, and NPP clearly contributed to SOC distribution (Fig. 5a and b). Large inconsistencies between the observational databases and ESMs were found in the low contributions of clay content and the CN ratio and in the high contributions of NPP in ESMs (Fig. 5a and b). The contribution of NPP to ESMs was greater than in the observational databases.
-10 0 10
-20 -10 0 10 20 30 (a)
Fitted function (kg C m
−
2 )
MAT ( C)
-10 0 10
0 10 20 30 40 50
(b)
Clay (%)
-20 -10 0 10 20
0 10 20 30 40 50
(c)
C / N ratio
-10 0 10
0 0.5 1
(d)
Fitted function (kg C m
−
2 )
Wetland ratio
-10 0 10
0 5 10 15
(e)
Land cover
HWSD IGBP-DIS
-10 0 10
-20 -10 0 10 20 30 (f)
Fitted function (kg C m
−
2 )
MAT ( C)
-10 0 10
0 1000 2000 3000 4000 (g)
MAP (mm)
-20 -10 0 10 20
0 10 20 30 40 50
(h)
Clay (%)
-20 -10 0 10 20
0 10 20 30 40 50
(i)
Fitted function (kg C m
−
2 )
C / N ratio
-10 0 10
0 1000 2000 3000
(j)
Elev (m)
-10 0 10
0 0.5 1
(k)
Wetland ratio HWSD IGBP-DIS NCSCD
o
o
Figure 4.Effects of the most influential variables in the model of the soil carbon stock for each global(a–e)and northern(f–k)observational databases. The fitted functions were centered by subtracting their means. See Table A2 for land cover classifications. Because of the small number of data points, the results for “permanent snow and ice” are not shown(e). They-axis scales for clay and the CN ratio are different from those of other factors(c, h, i).
HWSD and IGBP-DIS databases of the temperature range
−5 to 15◦C (Fig. 6a). The increasing trend with increasing NPP in ESMs was consistent with that of the HWSD, par-ticularly below approximately 500 g C m−2of NPP (Fig. 6e). Although the wetland ratio did not contribute to the ESMs (Fig. 6a) with respect to land cover, permanent wetlands had higher SOC (Fig. 6d).
3.2.2 Northern soils
The mean of the ESMs showed that for northern soils, the main contributors (mean annual temperature, land cover, and NPP) were mainly the same as in the ESM global outputs (Fig. 5c and d). The contribution of the mean annual
temper-ature was lower than that of the global results of the ESMs (mean of 14 % for the northern and 29 % for the global tem-peratures). The relatively large discrepancy between the ob-servational databases and ESMs included the lower contribu-tion of clay content, CN ratio, and elevacontribu-tion, and the higher contribution of the mean annual temperature, land cover, and NPP in the ESMs.
(b)
(d)
%
% 0
10 20 30 40 50 60 70 80
MATMAPClayCNratioTextureCTI ElevSlopeWetlandLandCoverNPPCroplandHANPPpct
(a) Global
Contribution (%)
ESM mean HWSD IGBP-DIS
0 10 20 30 40 50 60 70 80
MATMAPClayCNratioTextureCTI ElevSlopeWetlandLandCoverNPPCroplandHANPPpct
(c) North
Contribution (%)
Variables
ESM mean HWSD IGBP-DIS NCSCD
Databases
NorESM1MRI−ensemble−ESM1 MPI−ensemble MIROCIPSL−−ensembleensemble INM−CM4 HadGEM2−CC GISSGFDL−ensemble−ESM2M CMCC−CESM CESM1−ensembleCCSM4 CanESM2 BNU−ESM BCCESM−ensemble−mean IGBPHWSD−DIS
MATMAPCla
y
CNr atio
Texture
CTIEleSlopev
Wetland
LandCo verNPP
CroplandHANPPpct
0 20 40 60 80 100
Variables
Databases
NorESM1MRI−ensemble−ESM1 MPI−ensemble MIROCIPSL−−ensembleensemble INM−CM4 HadGEM2−CC GISSGFDL−ensemble−ESM2M CMCC−CESM CESM1−ensembleCCSM4 CanESM2 BNU−ESM BCCESM−ensemble−mean NCSCD IGBPHWSD−DIS
MATMAPCla
y
CNr atio
TextureCTIEle
v Slope
Wetland
LandCo verNPP
CroplandHANPPpct
0 20 40 60 80 100
Figure 5.Relative contribution (influence) of predictive variables for the model of the soil carbon stock from ESMs and a comparison with those of observational databases. Box plots show the results of ESMs, and the purple, green, light blue, and blue marks indicate the mean of the ESMs and results from observational databases (a: global;c: north). Mosaic plots of detailed relative contributions for each ESM (b: global;d: north) are shown.
those of the observational database (Fig. 5c). The decreasing trend with elevation was not replicated in the ESMs (Fig. 6g).
4 Discussion and concluding remarks 4.1 Identified influential factors
Compared with previous studies, we examined the contribu-tions of a wider variety of factors to SOC distribucontribu-tions. Our analyses revealed that the most distinct differences between the observational database data and the ESM outputs were the effects of the CN ratio and clay content (Fig. 5). For both global observational databases, the CN ratio was a substantial contributor (Fig. 3a and b). The important contribution of the CN ratio was the same in the northern databases (Fig. 3c–e). The SOC in the observational databases increased with in-creases in the CN ratio (Fig. 4c), whereas the SOC values of the ESMs were insensitive to the CN ratio. Our results sup-port the imsup-portance of properly incorporating the nitrogen
(N) cycle into SOC models (e.g., control over decomposi-tion, soil fertility, nutrient availability, and plant litter quality) (Berg et al., 2001; Cotrufo et al., 2013; Fernández-Martínez et al., 2014; Liski et al., 2005; Tuomi et al., 2009; ˇTupek et al., 2016). None of the ESMs except for the CESM1 and NorESM in CMIP5 included terrestrial nitrogen processes (Todd-Brown et al., 2013); however, including this parameter has been suggested as a key improvement for the next model intercomparison (CMIP6) (Hajima et al., 2014; Zaehle et al., 2015). The results of our analysis support the importance of including the N cycle in ESM models.
-10 0 10
-20 -10 0 10 20 30
(a)
Fitted function (kg C m
−
2 )
MAT ( C)
-10 0 10
0 1000 2000 3000 4000
(b)
MAP (mm)
-10 0 10
0 1000 2000 3000
(c)
Elev (m)
-10 0 10
0 5 10 15
(d)
Fitted function (kg C m
−
2 )
Land cover
-10 0 10
0 500 1000 1500
(e)
NPP (g C m−2)
ESM mean HWSD IGBP-DIS
-10 0 10
-20 -10 0 10 20 30
(f)
Fitted function (kg C m
−
2 )
MAT ( C)
-10 0 10
0 1000 2000 3000
(g)
Elev (m)
-10 0 10
0 5 10 15
(h)
Land cover
-10 0 10
0 500 1000 1500
(i)
Fitted function (kg C m
−
2 )
NPP (g C m−2)
ESM mean HWSD IGBP-DIS NCSCD o
o
Figure 6.Effect of the most influential variables in the model for global(a–e)and northern(f–i)outputs from ESMs and a comparison with those of observational databases. Grey lines show the results of each ESM, and the purple line indicates the mean of the ESMs. The fitted functions were centered by subtracting their means. See Table A2 for land cover classifications. Because of the small number of data points, the results for “permanent snow and ice” are not shown(d, h).
clay content has been previously incorporated in site-scale process-based models (Parton et al., 1987) and may be in-corporated in certain ESMs because the soil carbon submod-els in these ESMs are based on the CENTURY model (see the soil model history reported in Todd-Brown et al., 2014). However, regardless of whether the control of decomposabil-ity by clay is incorporated, our results suggest that the influ-ence of clay on the carbon cycle is not well captured in most ESMs.
The mean annual temperature was identified as an influen-tial factor in the global databases (Fig. 3a and b) but not in the northern soil databases (Fig. 3c–e). Temperature is a main factor controlling both plant production (source of carbon in-put to soil) and soil organic matter decomposition, which are already incorporated in ESMs. Based on an analysis of the output of heterotrophic respiration, the temperature
sensitiv-ity (e.g.,Q10value) of soil organic matter decomposition in
the consistency between the ESM outputs and observational databases.
The mean annual precipitation made a moderate contri-bution to the global observational databases and ESM out-puts, which was likely because NPP and temperature were strongly correlated with moisture and the temperature sensi-tivity of decomposition is generally more dominant than the soil moisture sensitivity. Similar ESM outputs have been re-ported in Todd-Brown et al. (2013). However, precipitation does not necessarily represent the actual moisture conditions in soil, and soil moisture conditions are related to climate conditions as well as soil texture, terrain, and vegetation. In addition, aerobic/anaerobic conditions are important because the wetland ratio has been identified as one of the influential factors (described below).
In the ESMs, NPP was selected as an influential factor in analyses of the global and northern SOC (Fig. 5), whereas in the observational databases (Fig. 3), NPP was not an in-fluential factor, which is consistent with the findings of a previous study (Todd-Brown et al., 2013). Todd-Brown et al. (2013) found that one of the major causes of variations in SOC among ESMs is differences in simulated NPP, and the strong control by NPP are not observed in the HWSD out-put. This high NPP contribution in ESMs is understandable because the terrestrial carbon balance is modeled by calcu-lating the SOC stock via NPP or plant litter input to soil and soil organic matter decomposition because plant litter input is proportionate to NPP. However, our analyses suggest that the influence of NPP on soil organic matter in the observational soil databases was obscured by other factors. When ESMs in-corporate the effects of other factors, such as the N cycle, the effect of NPP may be diluted. Moreover, the large variations in the total amount of SOC from ESMs are partly caused by variations in the modeled NPP in each ESM (Todd-Brown et al., 2013). Furthermore, SOC storage occurs via organic matter accumulation over decades and even millennia. Thus, prior NPP, land fires, and land-use changes may still affect current SOC values (Carvalhais et al., 2008; Wutzler and Re-ichstein, 2007). Land cover is another important factor, and incorporating the hydrology and resulting carbon dynamics in wetlands may lead to important improvements in ESMs.
Elevation was another influential factor, particularly in the northern observational databases (Fig. 3d and e). We spec-ulate that elevation may serve as a comprehensive index of SOC in limited areas because other variables, such as tem-perature, NPP, soil texture and other factors, change with in-creases in elevation. The effect of elevation in ESMs was not as high as that in the observational databases (Fig. 5). We estimated that the effect of elevation might automatically in-crease if the other aforementioned processes are properly ad-justed/included in the ESMs.
4.2 Similarity in influential factors for ESM outputs Analyses of the ESM outputs showed large variability, al-though the influential factors were largely similar among the ESMs (Fig. 5). This similarity likely indicates that the struc-ture of the models that describe SOC dynamics in the ESMs is similar. One reason for the similarity may be that certain ESMs share a common code (Alexander and Easterbrook, 2015). Another reason may be rooted in the basic structure of the soil carbon model, wherein SOC is calculated as the balance between dead organic matter input to soil and carbon emissions from the decomposition of organic matter. These processes are influenced by temperature and water condi-tions. The SOC pool is characterized by its turnover time (decomposition constant). In general, decomposition exhibits an exponential response to temperature, which is more severe than its response to water. As a result, model results for SOC are strongly influenced by NPP (litter input), temperature, and turnover time, which have been demonstrated by previ-ous studies (Exbrayat et al., 2014; Todd-Brown et al., 2013) and were confirmed in our analyses.
As shown in Table 2, the submodels of SOCs in ESMs differ in the number of SOC pools, and temperature and moisture functions. Todd-Brown et al. (2013) reported that the ESM outputs and observational SOC database results did not produce consistent patterns for soil carbon pools, temperature, and moisture sensitivity functions. Exbrayat et al. (2014) found that the turnover times of SOC in the ESM outputs were not affected by the number of SOC pools. Our analyses also indicated that a match or mismatch of major contributing factors between the ESM outputs and observa-tional database results is not strongly related to these prop-erties of SOC submodels. Thus, the spatial pattern of SOC from ESMs are likely more strongly affected by the basic structure, driving variables (NPP and temperature), and pa-rameterizations (turnover time, and temperature and mois-ture sensitivity, which are influential) than by the number of pools and the types of temperature and moisture sensitivity functions. From a mathematical perspective, the similarity is likely fundamentally based on the description of these SOC dynamics by a series of first-order linear ordinary differen-tial equations that are not autonomous (Manzoni and Porpo-rato, 2009; Sierra and Müller, 2015). With these equations, the outputs generally do not show chaotic behaviors.
4.3 Uncertainty and other factors
T able 2. ESMs used as outputs in this study . The term “ensemble” indicates the ensemble of outputs from the same families. The number of soil pools, types temperature sensiti vity function, types of moisture sensiti vity function, and link to nitrogen cycling are sho wn. URLs of model/modeling group/model description paper are also sho wn. Model names and modeling centers are sho wn in T able S1. ESM 1 Number of pool 2 T emperature sensiti vity 2 Moisture 2 Nitrogen 2 URL of model or modeling group or model description paper BCC-ensemble 6 Hill Hill No http://forecast.bcccsm.cma.go v.cn/htm/ BNU-ESM 2 Arrhenius Increasing No http://esg.bnu.edu.cn/BNU_ESM_webs/htmls/inde x.html CanESM2 1 Q10 Hill No http://ec.gc.ca/ccmac-cccm a/def ault.asp?lang=En&n=4596B3A2-1 CCSM4 3 Arrhenius Increasing Y es http://www .cesm.ucar .edu/models/ccsm4.0/ CESM1-ensemble 3 Arrhenius Increasing Y es http://www .cesm.ucar .edu/models/cesm1.0/ CMCC-CESM 3 3 Unkno wn Unkno wn Unkno wn http://www .cmcc.it/models/cmcc- esm- earth-syst em-model GFDL-ESM2M 2 Hill Increasing No https://www .gfdl.noaa.go v/earth- system-model/ GISS-ensemble 9 Increasing Increasing No http://www .giss.nasa.go v/tools/modelE/ HadGEM2-CC 4 Q10 Hill No http://www .metof fice.go v.uk/research/modeling- systems/unified- model/climate-models/hadgem2 INM-CM4 1 Q10 Hill No – IPSL-ensemble 4 Q10 Increasing No http://icmc.ipsl.fr/inde x.php/icmc-models MIR OC-ensemble 2 Arrhenius Increasing No http://www .geosci- model-de v.net/4/845/2011/ MPI-ensemble 3 Q10 Increasing No http://www .mpimet.mpg.de/en/science/models/mpi-esm.html MRI-ESM1 2 3 Arrhenius 4 Increasing 4 No 4 http://www .mri-jma.go.jp/Publish/T echnical/D A T A/V OL_64/inde x_en.html NorESM1-ensemble 3 Arrhenius Increasing Y es https://wiki.met.no/noresm/start 1BCC-ensemble: BCC-CSM1.1 and BCC-CSM1.1(m), CESM1-ensemble: CESM1(BGC), CESM1(CAM5), CESM1(F ASTCHEM), and CESM1(W A CCM), GISS-ensemble: GISS-E2-H, GISS-E2-H-CC, GISS-E2-R, and GISS-E2-R-CC, IPSL-ensemble: IPSL-CM5A-LR, IPSL-CM5A-MR, and IPSL-CM5B-LR, MIR OC-ensemble: MIR OC-ESM and MIR OC-ESM-CHEM, MPI-ensemble: MPI-ESM-MR and MPI-ESM-LR, and NorESM1-ensemble: NorESM1-M and NorESM1-ME. 2Adopted from T odd-Bro wn et al. (2013, 2014). 3T echnical reports. 4A. O., personal communications (2016).
is high in the observational databases (Fig. 1), which was also observed in the results from our BRT analysis (Fig. 3c– e). When the estimated SOC distribution from various ap-proaches, such as data-driven and process-oriented model-ing, are consistent, then our estimations have high confi-dence.
Although we examined key factors from a wide variety of candidate properties, potentially important mechanisms that would improve the reproducibility of SOC distributions by ESMs and process-based ecosystem models may still be missing. For example, including microbial dynamics in SOC models may improve projections of global soil carbon by ESMs (Wieder et al., 2013), although models that include these dynamics are still in development (see Wang et al., 2014, 2016; Wieder et al., 2015). Reports indicate that the role of mycorrhizae in soil carbon storage is important (Aver-ill et al., 2014). Because soil carbon accumulation and de-composition are slow processes and land cover is an impor-tant factor in SOC, as shown in our study, considering the land-use history of an area may be essential for improving ESMs. Furthermore, because soil has depth and SOC and soil environments vary according to depth (Davidson and Trumbore, 1995; Hashimoto and Komatsu, 2006; Jobbágy and Jackson, 2000), vertical soil heterogeneity/processes are important (Braakhekke et al., 2013; Wieder et al., 2013). The importance of mineral reactivity has also been suggested (Doetterl et al., 2015). However, our results suggest that the performance of ESMs can be improved simply through ade-quate re-evaluation/inclusion of well-known processes. An-other approach for improving ESMs is model–data fusion (assimilation) (Hararuk et al., 2014). Although its application to a part of an ESM (e.g., ecosystem carbon cycle model) is realistic in consideration of the long running time, constrain-ing model parameters with observational databases via data assimilation, such as a Bayesian approach, would improve the performance of ESMs. Another uncertainty of this anal-ysis is the issue of scale because analyses applied at much finer resolutions, such as 1 km, might be governed by differ-ent infludiffer-ential factors. The potdiffer-ential mechanisms, parameter-ization, and other modeling issues for next-generation ESMs are not limited to those listed above and have been thor-oughly discussed elsewhere (Luo et al., 2016; Ostle et al., 2009; Wieder et al., 2015).
5 Concluding remarks
differences among the observational databases and ESMs. On a global scale, in addition to improving the parameteri-zation of temperature sensitivity and NPP, properly incorpo-rating the influence of the nitrogen cycle and clay content in ESMs was identified as a potential method of improving the ability of these models to reproduce the distribution of SOC found in observational databases. The results of this study should help to identify the causes of the current mismatches between observational SOC databases and ESM outputs and improve the terrestrial carbon dynamics modeled in ESMs. This study demonstrates that the data-mining scheme can be used to compare the results from observational databases and ESMs in detail and determine the key factors involved in the mismatches.
Code and data availability. The R code, with a tutorial, for the
Appendix A
Table A1.Classification of soil texture in ISLSCPII (see Table 1).
ID Texture
1 Sand
2 Loamy sand
3 Sandy loam
4 Silt loam
5 Silt
6 Loam
7 Sandy clay loam
8 Silt clay loam
9 Clay loam
10 Sandy clay
11 Silty clay
12 Clay
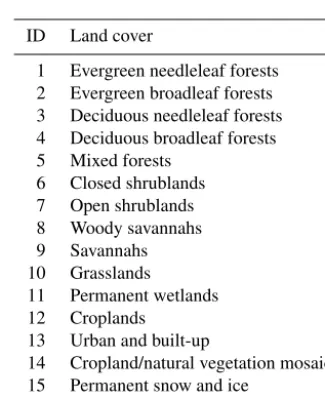
Table A2.Classification of land cover in ISLSCPII (see Table 1).
ID Land cover
1 Evergreen needleleaf forests 2 Evergreen broadleaf forests 3 Deciduous needleleaf forests
4 Deciduous broadleaf forests
5 Mixed forests
6 Closed shrublands
7 Open shrublands
8 Woody savannahs
9 Savannahs
10 Grasslands
11 Permanent wetlands
12 Croplands
13 Urban and built-up
14 Cropland/natural vegetation mosaic
15 Permanent snow and ice
The Supplement related to this article is available online at doi:10.5194/gmd-10-1321-2017-supplement.
Competing interests. The authors declare that they have no conflict
of interest.
Acknowledgements. This study was supported by JSPS KAKENHI
grant no. 24510025. We also acknowledge the Academy of Finland and mobility funding (no. 276300) for supporting this work. The constructive comments by the reviewers, Ben Bond-Lamberty and Katherine Todd-Brown, greatly improved the manuscript. We thank Dr. Tomohiro Hajima for helping to improve our understanding of the CMIP5 models, and we also thank Atsushi Obata for informa-tion about the MRI ESM model.
We acknowledge the World Climate Research Programme’s Working Group on Coupled Modeling, which is responsible for CMIP, and we thank the climate modeling groups (listed in Table 2 of this paper) for producing and making their model output available. For CMIP, the US Department of Energy’s Program for Climate Model Diagnosis and Intercomparison provided coordi-nating support and led development of software infrastructure in partnership with the Global Organization for Earth System Science Portals.
Edited by: D. Ham
Reviewed by: K. Todd-Brown and B. Bond-Lamberty
References
Aertsen, W., Kint, V., De Vos, B., Deckers, J., Van Orshoven, J., and Muys, B.: Predicting forest site productivity in tem-perate lowland from forest floor, soil and litterfall characteris-tics using boosted regression trees, Plant Soil, 354, 157–172, doi:10.1007/s11104-011-1052-z, 2011.
Alexander, K. and Easterbrook, S. M.: The software architec-ture of climate models: a graphical comparison of CMIP5 and EMICAR5 configurations, Geosci. Model Dev., 8, 1221–1232, doi:10.5194/gmd-8-1221-2015, 2015.
Anav, A., Friedlingstein, P., Kidston, M., Bopp, L., Ciais, P., Cox, P., Jones, C., Jung, M., Myneni, R. and Zhu, Z.: Evaluating the land and ocean components of the global carbon cycle in the CMIP5 earth system models, J. Climate, 26, 6801–6843, doi:10.1175/JCLI-D-12-00417.1, 2013.
Arora, V. K., Boer, G. J., Friedlingstein, P., Eby, M., Jones, C. D., Christian, J. R., Bonan, G., Bopp, L., Brovkin, V., Cad-ule, P., Hajima, T., Ilyina, T., Lindsay, K., Tjiputra, J. F., and Wu, T.: Carbon-concentration and carbon-climate feedbacks in CMIP5 earth system models, J. Climate, 26, 5289–5314, doi:10.1175/JCLI-D-12-00494.1, 2013.
Averill, C., Turner, B. L., and Finzi, A. C.: Mycorrhiza-mediated competition between plants and decomposers drives soil carbon storage, Nature, 505, 543–545, doi:10.1038/nature12901, 2014. Batjes, N. H.: Total carbon and nitrogen in the soils of the
world, Eur. J. Soil Sci., 47, 151–163, doi:10.1111/j.1365-2389.1996.tb01386.x, 1996.
Berg, B., McClaugherty, C., De Santo, A. V., and Johnson, D.: Hu-mus buildup in boreal forests: effects of litter fall and its N con-centration, Can. J. Forest Res., 31, 988–998, 2001.
Bond-Lamberty, B. and Thomson, A.: Temperature-associated in-creases in the global soil respiration record, Nature, 464, 579– 582, doi:10.1038/nature08930, 2010.
Braakhekke, M. C., Wutzler, T., Beer, C., Kattge, J., Schrumpf, M., Ahrens, B., Schöning, I., Hoosbeek, M. R., Kruijt, B., Kabat, P., and Reichstein, M.: Modeling the vertical soil organic matter profile using Bayesian parameter estimation, Biogeosciences, 10, 399–420, doi:10.5194/bg-10-399-2013, 2013.
Carvalhais, N., Reichstein, M., Seixas, J., Collatz, G. J., Pereira, J. S., Berbigier, P., Carrara, A., Granier, A., Montagnani, L., Papale, D., Rambal, S., Sanz, M. J., and Valentini, R.: Implications of the carbon cycle steady state assumption for biogeochemical mod-eling performance and inverse parameter retrieval, Global Bio-geochem. Cy., 22, GB2007, doi:10.1029/2007GB003033, 2008. Carvalhais, N., Forkel, M., Khomik, M., Bellarby, J., Jung, M., Migliavacca, M., Mu, M., Saatchi, S., Santoro, M., Thurner, M., Weber, U., Ahrens, B., Beer, C., Cescatti, A., Randerson, J. T., and Reichstein, M.: Global covariation of carbon turnover times with climate in terrestrial ecosystems, Nature, 514, 213–217, doi:10.1038/nature13731, 2014.
Chang, E. K. M., Guo, Y., and Xia, X.: CMIP5 multimodel ensem-ble projection of storm track change under global warming, J. Geophys. Res.-Atmos., 117, 1–19, doi:10.1029/2012JD018578, 2012.
Coleman, K. and Jenkinson, D. S.: ROTHC-26.3 A model for the turnover of carbon in soil: Model description and users guide, Harpenden, 1999.
Cools, N., Vesterdal, L., De Vos, B., Vanguelova, E., and Hansen, K.: Tree species is the major factor explaining C:N ratios in European forest soils, Forest Ecol. Manag., 311, 3–16, doi:10.1016/j.foreco.2013.06.047, 2014.
Cotrufo, M. F., Wallenstein, M. D., Boot, C. M., Denef, K., and Paul, E.: The Microbial Efficiency-Matrix Stabilization (MEMS) framework integrates plant litter decomposition with soil organic matter stabilization: do labile plant inputs form stable soil organic matter?, Glob. Change Biol., 19, 988–995, doi:10.1111/gcb.12113, 2013.
Cox, P. M., Betts, R. A., Jones, C. D., Spall, S. A., and Totter-dell, I. J.: Acceleration of global warming due to carbon-cycle feedbacks in a coupled climate model, Nature, 408, 184–187, doi:10.1038/35041539, 2000.
Crowther, T., Todd-Brown, K., Rowe, C., Wieder, W., Carey, J., Machmuller, M., Snoek, L., Fang, S., Zhou, G., Allison, S., Blair, J., Bridgham, S., Burton, A., Carrillo, Y., Reich, P., Clark, J., Classen, A., Dijkstra, F., Elberling, B., Emmett, B., Estiarte, M., Frey, S., Guo, J., Harte, J., Jiang, L., Johnson, B., Kröel-Dulay, G., Larsen, K., Laudon, H., Lavallee, J., Luo, Y., Lupascu, M., Ma, L., Marhan, S., Michelsen, A., Mohan, J., Niu, S., Pen-dall, E., Penuelas, J., Pfeifer-Meister, L., Poll, C., Reinsch, S., Reynolds, L., Schmidth, I., Sistla, S., Sokol, N., Templer, P., Treseder, K., Welker, J., and Bradford, M.: Quantifying global soil C losses in response to warming, Nature, 104, 104–108, doi:10.1038/nature20150, 2016.
Dirmeyer, P. A., Jin, Y., Singh, B., and Yan, X.: Trends in Land– Atmosphere Interactions from CMIP5 Simulations, J. Hydrome-teorol., 14, 829–849, doi:10.1175/JHM-D-12-0107.1, 2013. Doetterl, S., Stevens, A., Six, J., Merckx, R., Oost, K. Van, Pinto,
M. C., Casanova-katny, A., Muñoz, C., Boudin, M., Venegas, E. Z., and Boeckx, P.: Soil carbon storage controlled by interac-tions between geochemistry and climate, Nat. Geosci., 8, 780– 783, doi:10.1038/NGEO2516, 2015.
Elith, J., Leathwick, J. R., and Hastie, T.: A working guide to boosted regression trees., J. Anim. Ecol., 77, 802–813, doi:10.1111/j.1365-2656.2008.01390.x, 2008.
Exbrayat, J.-F., Pitman, A. J., Zhang, Q., Abramowitz, G., and Wang, Y.-P.: Examining soil carbon uncertainty in a global model: response of microbial decomposition to temperature, moisture and nutrient limitation, Biogeosciences, 10, 7095– 7108, doi:10.5194/bg-10-7095-2013, 2013.
Exbrayat, J.-F., Pitman, A. J., and Abramowitz, G.: Response of microbial decomposition to spin-up explains CMIP5 soil carbon range until 2100, Geosci. Model Dev., 7, 2683–2692, doi:10.5194/gmd-7-2683-2014, 2014.
FAO/IIASA/ISRIC/ISSCAS/JRC: Harmonized World Soil
Database (version 1.2), available at: http://webarchive.iiasa. ac.at/Research/LUC/External-World-soil-database/HTML/ (last access: 13 May 2015), 2012.
Fernández-Martínez, M., Vicca, S., Janssens, I. a., Sardans, J., Luyssaert, S., Campioli, M., Chapin III, F. S., Ciais, P., Malhi, Y., Obersteiner, M., Papale, D., Piao, S. L., Reichstein, M., Rodà, F., and Peñuelas, J.: Nutrient availability as the key regulator of global forest carbon balance, Nat. Clim. Change, 4, 471–476, doi:10.1038/nclimate2177, 2014.
Friedl, M. A., Strahler, A. H., and Hodges, J.: ISLSCP II MODIS (Collection 4) IGBP land cover, 2000–2001, doi:10.3334/ORNLDAAC/968, 2010.
Friedlingstein, P., Cox, P., Betts, R., Bopp, L., von Bloh, W., Brovkin, V., Cadule, P., Doney, S., Eby, M., Fung, I., Bala, G., John, J., Jones, C., Joos, F., Kato, T., Kawamiya, M., Knorr, W., Lindsay, K., Matthews, H. D., Raddatz, T., Rayner, P., Reick, C., Roeckner, E., Schnitzler, K.-G., Schnur, R., Strassmann, K., Weaver, A. J., Yoshikawa, C., and Zeng, N.: Climate–carbon cy-cle feedback analysis: results from the C4MIP model intercom-parison, J. Climate, 19, 3337–3353, doi:10.1175/JCLI3800.1, 2006.
Friedlingstein, P., Meinshausen, M., Arora, V. K., Jones, C. D., Anav, A., Liddicoat, S. K., and Knutti, R.: Uncertainties in CMIP5 Climate Projections due to Carbon Cycle Feedbacks, J. Climate, 27, 511–526, doi:10.1175/JCLI-D-12-00579.1, 2014. Global Soil Data Task Group: Global Gridded Surfaces of
Se-lected Soil Characteristics (International Geosphere-Biosphere Programme – Data and Information System), available at: http: //daac.ornl.gov/cgi-bin/dsviewer.pl?ds_id=569 (last access: 13 May 2015), doi:10.3334/ORNLDAAC/569, 2000.
Hajima, T., Kawamiya, M., Watanabe, M., Kato, E., Tachiiri, K., Sugiyama, M., Watanabe, S., Okajima, H., and Ito, A.: Modeling in Earth system science up to and beyond IPCC AR5, Prog. Earth Planet. Sci., 1, 1–25, doi:10.1186/s40645-014-0029-y, 2014. Hararuk, O., Xia, J., and Luo, Y.: Evaluation and
improve-ment of a global land model against soil carbon data using a Bayesian MCMC method, J. Geophys. Res.-Biogeo., 119, 403– 417, doi:10.1002/2013JG002535, 2014.
Hashimoto, S. and Komatsu, H.: Relationships between soil CO2 concentration and CO2production, temperature, water content, and gas diffusivity: implications for field studies through sensi-tivity analyses, J. For. Res.-Jpn., 11, 41–50, doi:10.1007/s10310-005-0185-4, 2006.
Hashimoto, S., Morishita, T., Sakata, T., and Ishizuka, S.: Increas-ing trends of soil greenhouse gas fluxes in Japanese forests from 1980 to 2009, Sci. Rep., 1, 116, doi:10.1038/srep00116, 2011. Hashimoto, S., Carvalhais, N., Ito, A., Migliavacca, M., Nishina,
K., and Reichstein, M.: Global spatiotemporal distribution of soil respiration modeled using a global database, Biogeosciences, 12, 4121–4132, doi:10.5194/bg-12-4121-2015, 2015.
Hiederer, R. and Köchy, M.: Global soil organic carbon estimates and the Harmonized World Soil Database, EUR 25225 EN, Pub-lications Office of the European Union, 2011.
Hugelius, G., Tarnocai, C., Broll, G., Canadell, J. G., Kuhry, P., and Swanson, D. K.: The Northern Circumpolar Soil Carbon Database: spatially distributed datasets of soil coverage and soil carbon storage in the northern permafrost regions, Earth Syst. Sci. Data, 5, 3–13, doi:10.5194/essd-5-3-2013, 2013.
Imhoff, M. L. and Bounoua, L.: Exploring global patterns of net primary production carbon supply and demand using satellite ob-servations and statistical data, J. Geophys. Res., 111, D22S12, doi:10.1029/2006JD007377, 2006.
Imhoff, M. L., Bounoua, L., Ricketts, T., Loucks, C., Harriss, R., and Lawrence, W. T.: HANPP Collection: Human Appropria-tion of Net Primary Productivity as a Percentage of net pri-mary productivity, available at: http://sedac.ciesin.columbia.edu/ es/hanpp.html (last access: 3 February 2016), 2004.
IPCC: Climate Change 2013 The Physical Science Basis, Cam-bridge University Press, 2013.
Jiang, L., Yan, Y., Hararuk, O., Mikle, N., Xia, J., Shi, Z., Tjipu-tra, J., Wu, T., and Luo, Y.: Scale-dependent performance of CMIP5 earth system models in simulating terrestrial vegeta-tion carbon, J. Climate, 28, 5217–5232, doi:10.1175/JCLI-D-14-00270.1, 2015.
Jobbágy, E. G. and Jackson, R. B.: The vertical distribu-tion of soil organic carbon and its reladistribu-tion to climate and vegetation, Ecol. Appl., 10, 423–436, doi:10.1890/1051-0761(2000)010[0423:TVDOSO]2.0.CO;2, 2000.
Köchy, M., Hiederer, R., and Freibauer, A.: Global distribution of soil organic carbon – Part 1: Masses and frequency distribu-tions of SOC stocks for the tropics, permafrost regions, wetlands, and the world, SOIL, 1, 351–365, doi:10.5194/soil-1-351-2015, 2015.
Koven, C. D., Chambers, J. Q., Georgiou, K., Knox, R., Negron-Juarez, R., Riley, W. J., Arora, V. K., Brovkin, V., Friedlingstein, P., and Jones, C. D.: Controls on terrestrial carbon feedbacks by productivity versus turnover in the CMIP5 Earth System Models, Biogeosciences, 12, 5211–5228, doi:10.5194/bg-12-5211-2015, 2015.
Kumar, D., Kodra, E., and Ganguly, A. R.: Regional and sea-sonal intercomparison of CMIP3 and CMIP5 climate model en-sembles for temperature and precipitation, Clim. Dynam., 1–28, doi:10.1007/s00382-014-2070-3, 2014.
Liski, J., Palosuo, T., Peltoniemi, M., and Sievänen, R.: Carbon and decomposition model Yasso for forest soils, Ecol. Model., 189, 168–182, doi:10.1016/j.ecolmodel.2005.03.005, 2005.
Luo, Y., Ahlström, A., Allison, S. D., Batjes, N. H., Brovkin, V., Carvalhais, N., Chappell, A., Ciais, P., Davidson, E. A., Finzi, A., Georgiou, K., Guenet, B., Hararuk, O., Harden, J. W., He, Y., Hopkins, F., Jiang, L., Koven, C., Jackson, R. B., Jones, C. D., Lara, M. J., Liang, J., McGuire, A. D., Parton, W., Peng, C., Randerson, J. T., Salazar, A., Sierra, C. A., Smith, M. J., Tian, H., Todd-Brown, K. E. O., Torn, M., van Groenigen, K. J., Wang, Y. P., West, T. O., Wei, Y., Wieder, W. R., Xia, J., Xu, X., Xu, X., and Zhou, T.: Toward more realistic projections of soil carbon dynamics by Earth system models, Global Biogeochem. Cy., 30, 40–56, doi:10.1002/2015GB005239, 2016.
Manzoni, S. and Porporato, A.: Soil carbon and nitrogen mineral-ization: Theory and models across scales, Soil Biol. Biochem., 41, 1355–1379, doi:10.1016/j.soilbio.2009.02.031, 2009. Martin, M. P., Wattenbach, M., Smith, P., Meersmans, J., Jolivet,
C., Boulonne, L., and Arrouays, D.: Spatial distribution of soil organic carbon stocks in France, Biogeosciences, 8, 1053–1065, doi:10.5194/bg-8-1053-2011, 2011.
New, M., Jones, P. D., and Hulme, M.: ISLSCP II
Cli-mate Research Unit CRU05 Monthly Climate Data,
doi:10.3334/ORNLDAAC/1015, 2011.
Nishina, K., Ito, A., Beerling, D. J., Cadule, P., Ciais, P., Clark, D. B., Falloon, P., Friend, A. D., Kahana, R., Kato, E., Keribin, R., Lucht, W., Lomas, M., Rademacher, T. T., Pavlick, R., Schaphoff, S., Vuichard, N., Warszawaski, L., and Yokohata, T.: Quantifying uncertainties in soil carbon responses to changes in global mean temperature and precipitation, Earth Syst. Dynam., 5, 197–209, doi:10.5194/esd-5-197-2014, 2014.
Nishina, K., Ito, A., Falloon, P., Friend, A. D., Beerling, D. J., Ciais, P., Clark, D. B., Kahana, R., Kato, E., Lucht, W., Lomas, M., Pavlick, R., Schaphoff, S., Warszawaski, L., and Yokohata, T.: Decomposing uncertainties in the future terrestrial carbon bud-get associated with emission scenarios, climate projections, and ecosystem simulations using the ISI-MIP results, Earth Syst. Dy-nam., 6, 435–445, doi:10.5194/esd-6-435-2015, 2015.
Ostle, N. J., Smith, P., Fisher, R., Woodward, F. I., Fisher, J. B., Smith, J. U., Galbraith, D., Levy, P., Meir, P., McNamara, N. P., and Bardgett, R. D.: Integrating plant-soil interactions into global carbon cycle models, J. Ecol., 97, 851–863, 2009.
Parton, W. J., Schimel, D. S., Cole, C. V., and Ojima, D. S.: Analysis of factors controlling soil organic matter levels in great plains grasslands, Soil Sci. Soc. Am. J., 51, 1173–1179, 1987. Prince, S. D. and Zheng, D. L.: ISLSCP II global
pri-mary production data initiative gridded NPP data,
doi:10.3334/ORNLDAAC/1023, 2011.
Ramankutty, N. and Foley, J. A.: ISLSCP II historical croplands cover, 1700–1992, doi:10.3334/ORNLDAAC/966, 2010. R Core team: R: A language and environment for statistical
com-puting, R Foundation for Statistical Comcom-puting, Vienna, 2013. Scharlemann, J. P., Tanner, E. V., Hiederer, R., and
Ka-pos, V.: Global soil carbon: understanding and managing the largest terrestrial carbon pool, Cabon Manag., 5, 81–91, doi:10.4155/cmt.13.77, 2014.
Schimel, D. S., Braswell, B. H., Holland, E. a., McKeown, R., Ojima, D. S., Painter, T. H., Parton, W. J., and Townsend, A. R.: Climatic, edaphic, and biotic controls over storage and
turnover of carbon in soils, Global Biogeochem. Cy., 8, 279–293, doi:10.1029/94GB00993, 1994.
Scholes, E. and Brown de Colstoun, E.: ISLSCP II global gridded soil characteristics, doi:10.3334/ORNLDAAC/1004, 2011. Shao, P., Zeng, X., Sakaguchi, K., Monson, R. K., and Zeng, X.:
Terrestrial carbon cycle: Climate relations in eight CMIP5 earth system models, J. Climate, 26, 8744–8764, doi:10.1175/JCLI-D-12-00831.1, 2013.
Sierra, C. A. and Müller, M.: A general mathematical framework for representing soil organic matter dynamics, Ecol. Monogr., 85, 505–524, doi:10.1890/15-0361.1, 2015.
Sierra, C. A., Trumbore, S. E., Davidson, E. A., Vicca, S., and Janssens, I.: Sensitivity of decomposition rates of soil or-ganic matter with respect to simultaneous changes in temper-ature and moisture, J. Adv. Model. Earth Syst., 7, 335–356, doi:10.1002/2014MS000358, 2015.
Tarnocai, C., Canadell, J. G., Schuur, E. A. G., Kuhry, P., Mazhi-tova, G. and Zimov, S.: Soil organic carbon pools in the north-ern circumpolar permafrost region, Global Biogeochem. Cy., 23, GB2023, doi:10.1029/2008GB003327, 2009.
Tian, H., Lu, C., Yang, J., Banger, K., Huntzinger, D. N., Schwalm, C. R., Michalak, A. M., Cook, R., Ciais, P., Hayes, D., Huang, M., Ito, A., Jain, A. K., Lei, H., Mao, J., Pan, S., Post, W. M., Peng, S., Poulter, B., Ren, W., Ricciuto, D., Schaefer, K., Shi, X., Tao, B., Wang, W., Wei, Y., Yang, Q., Zhang, B., and Zeng, N.: Global patterns and controls of soil organic carbon dynamics as simulated by multiple terrestrial biosphere models: Current status and future directions, Global Biogeochem. Cy., 29, 775– 792, doi:10.1002/2014GB005021, 2015.
Todd-Brown, K. E. O., Randerson, J. T., Hopkins, F., Arora, V., Ha-jima, T., Jones, C., Shevliakova, E., Tjiputra, J., Volodin, E., Wu, T., Zhang, Q., and Allison, S. D.: Changes in soil organic carbon storage predicted by Earth system models during the 21st cen-tury, Biogeosciences, 11, 2341–2356, doi:10.5194/bg-11-2341-2014, 2014.
Todd-Brown, K. E. O., Randerson, J. T., Post, W. M., Hoffman, F. M., Tarnocai, C., Schuur, E. A. G., and Allison, S. D.: Causes of variation in soil carbon simulations from CMIP5 Earth system models and comparison with observations, Biogeosciences, 10, 1717–1736, doi:10.5194/bg-10-1717-2013, 2013.
Tuomi, M., Thum, T., Järvinen, H., Fronzek, S., Berg, B., Harmon, M., Trofymow, J. A., Sevanto, S., and Liski, J.: Leaf litter decomposition – Estimates of global variability based on Yasso07 model, Ecol. Model., 220, 3362–3371, doi:10.1016/j.ecolmodel.2009.05.016, 2009.
ˇ
Tupek, B., Ortiz, C. A., Hashimoto, S., Stendahl, J., Dahlgren, J., Karltun, E., and Lehtonen, A.: Underestimation of boreal soil carbon stocks by mathematical soil carbon models linked to soil nutrient status, Biogeosciences, 13, 4439–4459, doi:10.5194/bg-13-4439-2016, 2016.
Verdin, K. L.: ISLSCP II HYDRO1k Elevation-derived Products, doi:10.3334/ORNLDAAC/1007, 2011.
Wang, Y. P., Chen, B. C., Wieder, W. R., Leite, M., Medlyn, B. E., Rasmussen, M., Smith, M. J., Agusto, F. B., Hoffman, F., and Luo, Y. Q.: Oscillatory behavior of two nonlinear microbial models of soil carbon decomposition, Biogeosciences, 11, 1817– 1831, doi:10.5194/bg-11-1817-2014, 2014.
Wang, Y., Xu, X., and Luo, Y. Q.: Responses of two nonlinear microbial models to warming and increased carbon input, Bio-geosciences, 13, 887–902, doi:10.5194/bg-13-887-2016, 2016. Wieder, W. R., Allison, S. D., Davidson, E. A., Georgiou,
K., Hararuk, O., He, Y., Hopkins, F., Luo, Y., Smith, M. J., Sulman, B., Todd-Brown, K., Wang, Y.-P., Xia, J., and Xu, X.: Explicitly representing soil microbial processes in Earth system models, Global Biogeochem. Cy., 29, 1782–1800, doi:10.1002/2015GB005188, 2015.
Wieder, W. R., Bonan, G. B., and Allison, S. D.: Global soil carbon projections are improved by modelling microbial processes, Nat. Clim. Change, 3, 909–912, doi:10.1038/nclimate1951, 2013. Wieder, W. R., Boehnert, J., and Bonan, G. B.: Evaluating
soil biogeochemistry parameterizations in Earth system mod-els with observations, Global Biogeochem. Cy., 28, 211–222, doi:10.1002/2013GB004665, 2014.
Wutzler, T. and Reichstein, M.: Soils apart from equilibrium – con-sequences for soil carbon balance modelling, Biogeosciences, 4, 125–136, doi:10.5194/bg-4-125-2007, 2007.
Zaehle, S.: Terrestrial nitrogen-carbon cycle interactions at the global scale, Philos. T. Roy. Soc. B, 368, 20130125, doi:10.1098/rstb.2013.0125, 2013.