Vol. 1, No. 1, pp. 19-26, June (2018)
Optimal Planning of Energy Storage Systems using Symbiotic Organisms
Search Algorithm
Reza Safipoura)andMahmoud Oukati Sadeghb)
Energy storage systems, along with many capabilities in the grid, are costly technologies. Therefore, their economic issues should be also considered while they are used in the grid. In this paper, a method has been proposed that can be used to determine the location, power, and capacity of the energy storage systems with consideration of the technical and economic aspects, simultaneously. Technical goals of this method are improvement of voltage profile and loss reduction, while economic objectives are including reduction of investment cost, operation and maintenance cost of the energy storage system. The problem of optimization is solved with the symbiotic organisms search algorithm. The main advantage of this algorithm is the absence of specific regulatory parameters compared to other meta-heuristic algorithms. The proposed plan has been implemented safely. Safe performance is achieved by enforcing security constraints such as voltage and power balancing and constraints for the energy storage system, such as capacity of energy and power constraints, and amount of energy stored. The distributed generation used in this plan is wind power plant. The output of each turbine is determined by a linear model reliant on wind speed. The proposed method has been implemented on the IEEE 33 bus grid. The results demonstrate the efficiency and capability of the proposed method.
A B S T R A C T
ARTICLE INFO
Keywords:
Energy Storage Systems Improvement of Voltage Profile Loss Reduction
Symbiotic Organisms Search Algorithm Wind Power Plant
Article history:
Received February. 10, 2018 Accepted Aprill. 11, 2018
I. INTRODUCTION
Nowadays, the penetration of distributed generation resources has increased dramatically. Advantages of us-ing these resources include loss reduction, voltage regu-lation, improvement of reliability and reduction of green-house gases and environmental impacts1. In addition to these benefits, the use of distributed generation resources faces many problems. One of the major issues is the power quality reduction due to the fluctuating nature of these resources2. The variable power output of dis-tributed generation resources causes oscillations in the voltage and frequency of the power grid. The use of en-ergy storage systems is one of the solutions to solve this problem3.
a)Department of Electrical and Electronic Engineering, University
of Sistan and Baluchestan, Zahedan, Iran
b)Corresponding Author: [email protected], Tel:
+98-54-33447908, Fax: +98-54-+98-54-33447908, Department of Electrical and Electronic Engineering, University of Sistan and Baluchestan, Za-hedan, Iran
http://dx.doi.org/10.22111/ieco.2018.23950.1004
The first challenge in designing energy storage systems is to determine the optimal size and installation location of these systems in order to maximize their capabilities4. Reference5, try to find the optimal location and capity of energy storage systems in a grid, taking into ac-count the grid-connected and islanding modes of opera-tion, simultaneously. Reference6 provides a method for determining the optimum energy storage capacity at a minimum cost to control the frequency in the grid in the islanding mode of operation. In7, the problem of optimal battery design involves determining its location, capacity, and power to minimize the amount of objective function according to the technical consideration constraints. In8, a method is proposed to allocate optimal site and size of the storage system in order to improve reliability in distribution grids. The goal is to optimize the energy storage systems in order to reduce the cost of energy not supplied, the investment cost and the operation cost of energy storage systems, simultaneously. In9, a compari-son is carried out based on the optimal design of different batteries in order to find the best choice for applications in the distribution grid. A method based on genetic al-gorithm is proposed to determine the capacity of stor-age systems in a grid in10. The main objective of this method is to find the power and energy capacity of the energy storage systems to minimize the operating cost of the grid. In this paper, an energy management method based on a fuzzy system is used to control the power output of the storage system.
op-eration using battery energy diagram. Optimal decision making minimizes the expected costs during utilization years. The method presented in two steps is solved with the linear programming problem. The optimum values of battery energy and power is determined in the first stage and the optimal battery installation year is determined in the second stage.
Energy storage systems are divided into five categories including chemical, electrochemical, electrical, mechani-cal and thermal. Batteries are in the category of electro-chemical storage systems. These systems convert chem-ical energy into electrchem-ical energy. The batteries are di-vided into two categories, primary battery and secondary batteries. In the first group, battery is un-rechargeable and in the secondary group, the battery is rechargeable13. One example of a rechargeable battery is vanadium tery, which is used in grid-scale applications. In this bat-tery, unlike conventional batteries, that store energy in the electrodes, electrolytic solutions are responsible for storing of energy. This action will determine the power and energy capacity, separately. Although the battery has a relatively high investment cost and low energy den-sity, the flexible battery discharge time, power, energy, along with long lifespan, encourage the usage of this type of battery14.
The symbiotic organisms search (SOS) algorithm is a novel meta-heuristic algorithm for engineering design and numerical optimization. This algorithm simulates behavioral methods of coexistence between members of an ecosystem that uses these behaviors to survive. The main advantage of this algorithm is the absence of specific regulatory parameters compared to other meta-heuristic algorithms15.
In this paper, the location, capacity of energy and power of the energy storage system are determined with the aim of improving the voltage profile and reducing loss in the presence of distributed generation resources. Due to the high investment cost of storage systems, the eco-nomic aspects of using these systems, such as investment costs, annual operation and maintenance cost during the design process, are considered in addition to technical as-pects. The energy storage system used in this design is a vanadium battery. To solve the optimization problem, the symbiotic organisms search algorithm is used. The results obtained by using this algorithm are compared with the results obtained from the genetic and PSO al-gorithms to determine the efficiency of the above algo-rithm. The resource of the distributed generation used in this paper is a wind power plant consisting of sev-eral wind turbines. The output power of each turbine is determined by a linear model dependent on wind speed. Later, SectionIIexplains the wind turbine model. In Sec-tionIII, problem formulation, objective functions and the specified constraints are introduced. SectionIVexplains the SOS algorithm. SectionVpresents the results of the simulations carried out. Finally, SectionVIis allocated to the conclusion.
II. WIND TURBINE MODEL
The wind turbine output power depends on wind speed and turbine characteristics. Therefore, the wind turbine output powerPW T can be modeled using (1)16.
PW T =
0, v < vc or v > vf
αv2+βv+γ, v
c≤v≤vr
Pr, vr< v≤vf
(1)
In this model, v is wind speed and Pr is the nominal
turbine output. Also, vr is the average amount of wind
speed in which wind turbine production is equivalent to nominal power. vc is the minimum wind speed, after
which the turbine begins to generate power, and vf is
the maximum wind speed which then stops to maintain the turbine’s health and prevent its overturning.
III. PROBLEM FORMULATION
A. The Objective Function
The optimization goals in this article are summarized as follows:
1. Improvement the voltage profile.
2. Reduction of losses.
3. Reduction of costs that are added to the grid due to the installation of the battery.
Consequently, the objective function consists of three parts as (2).
objective function = min[F1+F2+F3] (2)
In this regardF1,F2,F3are the objective functions that are used to improve the voltage profile, reduction of loss and reduction of costs, respectively.
1. Voltage
The objective function is calculated to improve the voltage profile with (3). In (3), a desired voltage level, Vlevel, is considered, which is usually 1puThen the
volt-age of each bus is lowered from this desired level to indi-cate the voltage deviation.
F1= 24
X
j=1 33
X
i=1
|Vlevel−Vij| (3)
2. Power loss
The active power loss in each branch are obtained by (4):
Ploss=real[(Vi−Vj)×In∗] (4)
In this case,Viis the voltage of busiandInis the current
of the branchn. Then, using (5), the total amount of loss is calculated in all branches.
F2= 24
X
j=1 37
X
i=1
(Piloss)j (5)
3. The cost of the energy storage system
A review over costs of energy storage systems, certifies that the cost of these systems is a function of their nom-inal power and energy. In order to verify the economical aspect of installation of energy storage systems, this pa-per takes into account the costs of investment, opa-peration and maintenance6.
The investment cost (IC) of an energy storage system is expressed in (6):
IC=P C×Pbatt+EC×Cbatt (6)
In this case, Pbatt (kW) is power and Cbatt (kW h) is
energy capacity andP C ($/kW) is power coefficient and EC ($/kW h) is energy coefficient of battery.
Costs related to the operation and maintenance (OC) of an energy storage system can be expressed as follows:
OC =CC×Pbatt+V C×Ed (7)
In Eq. (7), CC ($/kW/year) is the constant coefficient andV C ($/kW h/year) shows the variable coefficient for the cost of operation and maintenance. Ed (kW h/year)
is the annual discharged energy of the energy storage system.
The total cost of the battery (CT) in the grid is the
total cost of investment and the cost of operation and maintenance.
F3=CT =IC+OC (8)
Since, the unit ofF1 andF2functions are pu and unit of functionF3 is dollar, in order to equalize the units, the functionF3 is multiplied by a weighting factor.
B. Considered Constraints
1. Battery constraints
Cbattmin≤Cbatt≤Cbattmax (9)
Pbattmin≤Pbatt≤Pbattmax (10)
In Eq. (9),Cbattis the energy capacity of the battery in
kWh. Also,Cmin
batt is the minimum nominal energy
capac-ity, andCbattmax is the maximum nominal energy capacity which are equal to 1500 and 2000, respectively.
In Eq. (10), Pbatt is the power of the battery in kW.
Also,Pmin
batt is the minimum nominal power and Pbattmax is
the maximum nominal power that will be 300 and 500, respectively.
In each hour, the battery state of charge (SOC) should be update. For this purpose, (11) and (12), which are respectively used in charging and discharging modes, are utilized17.
SOCt=SOCt−1+P
t
batt×∆T×ηc
Cbatt
(11)
SOCt=SOCt−1−P
t batt×
∆T ηd
Cbatt
(12)
In equations (11) and (12),ηc is charging efficiency and
ηd is discharging efficiency which both are 70%. Also,
the stored energy in the battery should be limited.
0≤Et≤E¯ (13)
In Eq. (13), ¯E is the capacity of battery energy.
2. Grid constraints
Vmin≤Vb,t ≤Vmax, b= 1,2,· · ·,33 (14)
In the Eq. (14),Vmin is the minimum voltage and Vmax
is the maximum voltage of each bus with values of 0.9 and 1.1 pu, respectively.
PW Tt +PGridt =Pbattt +PLoadt +Plosst (15)
In the Eq. (15), PW Tt , the power of the wind turbine, PGridt , grid power,PLoadt , the load power andPlosst indi-cate the power loss per hour. The power of the battery will be negative during charging time, and positive at discharging time.
IV. SYMBIOTIC ORGANISMS SEARCH ALGORITHM
between the two species is that one species benefits from other while this has no effect on the other species. This is known as commensalism. Another symbiotic relation-ship is parasitism which occurs between two species of which one species is beneficial and the other species are harmed.
The SOS algorithm, similar to all population-based al-gorithms, uses a number of candidate solutions to find the optimal solution. This algorithm begins with an initial population called the ecosystem. In the initial ecosystem, some members are randomly generated in search space. Each member presents a candidate’s solution to the prob-lem, which is related to the degree of compatibility, and indicates the degree of compliance with the target.
In this algorithm, three phases are used to generate new solution in the next iteration. These three phases are mutualism, commensalism and parasitism.
A. Mutualism Phase
Xi is the i-th member ecosystem and Xj is another
member that is randomly chosen to interact with Xi.
Both members are used in a mutualism relationship with the goal of increasing survival in an ecosystem. The new candidate’s solutions for Xi and Xj are calculated
based on the mutualism relationship between the mem-bers, (16) and (17) are modeled.
Xinew=Xi+rand(0,1)×(Xbest
−M U T U AL V ECT OR×BF1) (16)
Xjnew =Xj+rand(0,1)×(Xbest
−M U T U AL V ECT OR×BF2) (17)
M U T U AL V ECT OR=Xi+Xj
2 (18)
In equations (16) and (17), rand (0,1) is the vector of random numbers, andXbest is the member that has the
highest degree of compliance with the ecosystem. Benefit factors (BF1andBF2) randomly selected 1 or 2 indicate the benefit level of each member from the relationship. Finally, if the new compatibility value of members is more than the amount of compatibility in previous iterations, members will be updated.
B. Commensalism Phase
Similar to the mutualism phase, member Xj is
ran-domly selected from the ecosystem for interacting with Xi. In this situation, the memberXitries to benefit from
the relationship. However, the memberXj will not
ben-efit from this relationship and will not also be harmed. The answer to the new candidateXi, which is calculated
on the basis of the commensalism relation between the membersXiandXj, is modeled in (19). The memberXj
will be updated if the new compatibility value is greater than the compatibility level in previous iterations.
Xinew=Xi+rand(−1,1)×(Xbest−Xj) (19)
C. Parasitism Phase
In this phase, the member Xi creates a parasitic-like
parasite by creating an artificial parasite called the par-asitic vector. Then the memberXj is randomly selected
from the ecosystem and feeds the parasite vector as the host. Parasite vector attempts to replace the memberXj
in the ecosystem. The compatibility degree of both mem-bers are calculated. If the parasite vector has a better compatibility degree, the memberXj will be destroyed
and replaced by the ecosystem. If the Xj compatibility
degree is better,Xj is no longer a parasite, and the
par-asite vector will not be able to survive in this ecosystem any more.
V. SIMULATION AND RESULTS
To investigate the proposed method, it is implemented on the standard IEEE 33 buses grid. This is performed as the study system. Fig. 1 shows this grid.
Information about this grid is presented in18. The grid includes a wind power plant with 180 turbines, which is considered as DG and connected to the bus 9. The rated power of each turbine is 20kW and the rated ca-pacity of the power plant is 3.6 M W. Wind turbine power is dependent on wind speed, Fig. 2shows the wind speed at any hour of a day. The value of the parameters used in Eq. (1) including α, β and γ are respectively 0.144 kW s2/m2,−1.152 kW s/mand 2.268 kW.
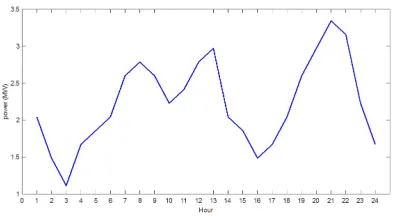
By using (1) and the wind speed values shown in Fig. 2, the output of each wind turbine can be obtained. Fig. 3 shows the output power of the wind power plant over a period of 24 hours. Also, Fig. 4 shows the daily load curve connected to the grid.
The battery used in this grid is a vanadium and the characteristics of which are given in TableI. The goal is to find the optimal location for installation and besides determine the optimal capacity of the battery in the tar-get grid in such a way that the objective function is op-timized. In this paper, the symbiotic organisms search algorithm is used to obtain optimal solutions. Finally, the results are compared with well-known and successful algorithms, i.e., Genetic and PSO. The simulation is then carried out in four scenarios:
1. In the grid, only wind power plant (without storage system) is used.
2. In the grid, both wind power plant and optimized storage(optimizes with GA algorithm) are used.
TABLE I. Charactristics of vanadium battery6
Parameter Efficiency VC CC EC PC
(%) ($/kW/year) ($/kW/year) ($/kW h) ($/kW)
value 70 0 9 100 426
FIG. 1. IEEE standard 33 buses grid.
FIG. 2. Wind speed at each hour of a day.
4. In the grid, both wind power plant and optimized storage(optimizes with SOS algorithm) are used
First, simulation is performed to achieve the first two objectives, improvement of the voltage profile and reduc-tion the loss. This is carried out without considering the economic considerations (the constraints of power and energy of battery are not considered). The results are presented in TableII.
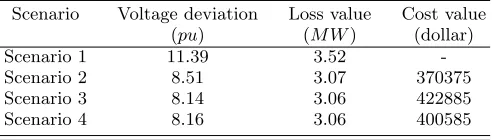
The values of voltage deviation, loss, and cost are shown TableIII.
Using the obtained values, it is shown that optimiza-tion of the voltage profile and loss is achieved to an ac-ceptable level. But without considering the economic considerations, the capacity for the battery is not opti-mal and due to the high cost of buying and operating, a large cost is imposed to the grid. Therefore, third objec-tive needs to be considered, namely as the reduction of costs in the objective function.
In the following, simulation is carried out by taking into account economic considerations and in order to op-timize the three objective functions introduced in Section III. TableIVshows the location of installation, power ca-pacity and energy caca-pacity of battery.
FIG. 3. Output power of the wind power plant.
FIG. 4. Daily load curve connected to the grid.
Also, the value of the regulatory parameters related to each of the algorithms is given in TableV. The number of iterations for all algorithms is 200.
Table VIshows the values of voltage deviations in all buses and loss in the four scenarios in a day and the total cost of the energy storage system in one year. Accord-ing to the results, the SOS algorithm generally provides better responses.
The grid loss are broken down every hour during the day for the mentioned scenarios in Fig. 5. The values of loss in each hour on the graph of scenario 1 differ from other graphs, it is due to the use of the battery. During the hours which the battery is being charged, the loss is reduced and during hours which the battery is discharged, the loss is increased. Also, the differences in values on the graphs of scenarios 2, 3, and 4 are due to alterations in the location, energy, and power provided for the battery in each algorithm.
TABLE II. Information of location and battery size
Algorithm Location of Power Energy
used installation capacity capacity
(number of bus) (kW) (kW h)
SOS 15 511 1783
PSO 16 511 2006
GA 15 445 1786
TABLE III. Voltage deviation, loss and cost values in all sce-narios
Scenario Voltage deviation Loss value Cost value
(pu) (M W) (dollar)
Scenario 1 11.39 3.52
-Scenario 2 8.51 3.07 370375
Scenario 3 8.14 3.06 422885
Scenario 4 8.16 3.06 400585
power, battery power, and wind turbine output power, respectively.
Fig. 7, shows the grid bus voltage at the peak hour when the battery is in its discharge state. In this figure, four graphs are presented for each of the scenarios. The results show the efficiency of the energy storage system in improving the voltage profile.
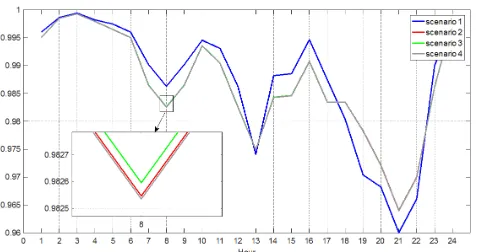
The minimum value of voltage at all hours of the day for different scenarios is shown in Fig. 8. According to this figure, at moments in which the battery is in charge, this amount is less than the amount that is obtained when battery is not used. But at moments when the battery is in a discharge state, this amount is greater than the amount that is obtained when battery is not used.
VI. CONCLUSIONS
In this paper, the utilization of energy storage systems in the grid with the aim of improving the voltage profile and reducing loss in the presence of distributed generation resource with variable generation power is investigated. Since energy storage systems have a high investment, operating and maintenance cost, the economic aspects of their application are considered alongside technical aspects. Using the proposed method, optimal installation location, the optimal power and energy capacity of battery are determined. The SOS
TABLE IV. Information of location and battery size
Algorithm Location of Power Energy
used installation capacity capacity
(number of bus) (kW) (kW h)
SOS 18 304 1536
PSO 15 304 1568
GA 15 304 1551
TABLE V. Regulatory parameters related to each of the al-gorithms
Algorithm used Parameter Value
SOS population 50
population 50
GA crossover 0.2
mutation 0.6
population 50
PSO W 0.8
C1 1.5
C2 1.5
TABLE VI. Voltage deviation, loss and cost values in all sce-narios
Scenario Voltage deviation Loss value Cost value
(pu) (M W) (dollar)
Scenario 1 11.39 3.52
-Scenario 2 9.26 3.18 287340
Scenario 3 9.26 3.18 289040
Scenario 4 9.17 3.21 285840
algorithm is used to optimize the objective function and forward-backward method is applied to calculate the load flow. The results show that the proposed method of optimal use of energy storage systems in compliance with the practical grid constraints, provides two technical and economic benefits. In the end, the results of the SOS algorithm are compared with the results of genetic and PSO algorithms and the advantages of each are discussed.
REFERENCES
1E. Naderi, H. Seifi and M. S. Sepasian, “A dynamic approach
for distribution system planning considering distributed genera-tion,”IEEE Transaction on Sustainable Energy, Vol. 27, No. 3, pp. 1313-1322, 2012.
2B. K. kang, S. T. kim, B. C. sung and J. W. park, “A Study on
Optimal Sizing of Superconducting Magnetic Energy Storage in Distribution Power System,”IEEE Transaction on Applied Su-peronductivity, Vol. 22, No. 3, pp. 5701004-5701004, 2012.
3A. A. Akhil, G. Huff, A. B. Currier, B. C. Kaun, D. M. Rastler,
S. B. Chen, A. L. Cotter, D. T. Bradshaw and W. D. Gauntlett,
DOE/EPRI 2013 Electricity storage handbook in collaboration with NRECA, USA, 2013.
4J. Lei and Q. Gong, “Operating strategy and optimal
alloca-tion of large-scale VRB energy storage system in active distribu-tion networks for solar/wind power applicadistribu-tions,”IET Genera-tion, Transmission&Distribution, Vol. 11, No. 9, pp. 2403-2411, 2017.
5A. Beiranvand, M. Mahdavi, L. Li, S. Zhu and J. Zheng,
“Find-ing the optimal place and size of an energy storage system for the daily operation of microgrids considering both opera-tion modes simultaneously,”in IEEE International Conference on Power System Technology (POWERCON), pp. 1-6, 2016.
6T. Kerdphol, K. Fuji, Y. Mitani, M. Watanabe and Y. Qudaih,
“Optimization of a battery energy storage system using particle swarm optimization for stand-alone microgrids,”Electrical Power and Energy Systems, Vol. 81, pp. 32-39, 2016.
7M. Sedghi, A. Ahmadian and M. Aliakbar-Golkar, “Optimal
uncer-FIG. 5. Loss in each hour of day in all scenarios.
FIG. 6. Contribution of each resource in feeding the load.
FIG. 7. Voltage of each bus at peak time in all scenarios.
tainty of wind power distributed generation,”IEEE Transaction on Power Systems, Vol. 31, No. 1, pp. 304-316, 2016.
8H. Saboori, R. Hemmati and M. Ahmadi Jirdehi, “Reliability
improvement in radial electrical distribution network by optimal planning of energy storage systems,”Energy, Vol. 93, pp. 2299-2312, 2015.
9M. Daghi, M. Sedghi, A. Ahmadian and M. Aliakbar-Golkar,
“Factor analysis based optimal storage planning in active distribution network considering different battery technolo-gies,”Applied Energy, Vol. 183, pp. 456-469, 2016.
10J. P. Fossati, A. Galarza, A. Martin-Villate and L. Fontan, “A
method for optimal sizing energy storage systems for micro-grids,”Renewable Energy, Vol. 77, pp. 539-549, 2015.
11P. Xiong and C. Singh, “Optimal planning of storage in power
systems integrated with wind power generation,”IEEE Transac-tion on Sustainable Energy, Vol. 7, No. 1, pp. 232-240, 2016.
12H. Alharbi and K. Bhattacharya, “Stochastic optimal planning
of battery energy storage systems for isolated microgrids,”IEEE Transaction on Sustainable Energy, Vol. 9, No. 1, pp. 211-227, 2018.
13M. S. Guney and Y. Tepe, “Classification and assessment of
energy storage systems,”Renewable and Sustainable Energy Re-views, Vol. 75, pp. 1187-1197, 2017.
14Haisheng Chen , Thang Ngoc Cong, Wei Yang , Chunqing Tan ,
Yongliang Li , Yulong Ding, “Progress in electrical energy storage system: Acritical review,”Progress in Natural Science, Vol. 19, No. 3, pp. 291-312, 2009.
15M. Y. Cheng and D. Prayogo, “Symbiotic organisms search:
A new metaheuristic optimization algorithm,”Computers and StructuresVol. 139, pp. 98-112, 2014.
16Powell WR, “An analytical expression for the average output
power of a wind machine,”in Sol EnergyVol. 6, No. 1, pp. 77-80, 1981.
17A. Gabash and P. Li, “Active-reactive optimal power flow in
dis-tribution networks with embedded generation and battery stor-age,”IEEE Transaction on Power Systems, Vol. 27, No. 4, pp. 2026-2035, 2012.
18D. Wang, S. Ge, H. Jia and C. Wang, “A demand response and
battery storage coordination algorithm for providing microgrid tie-line smoothing services,”IEEE Transaction on Sustainable
Energy, Vol. 5, No. 2, pp. 476-486, 2014.
Reza Safipourwas born in Baft, Iran. He received his B.S. degree in Power Engi-neering from Shahid Bahonar University, Kerman, Iran, in 2015, and his M.S. degree in Power System Engineering from Sistan and Baluchestan University, Zahedan, Iran, in 2018. His current research interests include Renewable Energy Resources and En-ergy Storage Systems.