145 International Journal of Transportation Engineering, Vol.6/ No.2/ Autumn 2018
Analysis of the Impact of users’ Violations on the
Saturation Flow Rate at Signalized Intersections
Peiman Mohseni Melerdi1, Amin Mirza Boroujerdian 2
Received: 26.10.2016 Accepted: 21. 02.2018
Abstract
Accurate estimation of saturation flow rate is a prerequisite for accurate estimation of level of service and delays of signalized intersections. Saturation flow rate of intersections depends on many factors, including traffic behavior and culture. One of the important problems of traffic behavior in Iran is the violation of law at the physical region of intersections. The main purpose of this paper is to study the effects of violations such as pedestrians and motorcyclists ignoring the red light and vehicles changing their lanes at the physical region of intersections on the saturation flow rate.
Data were gathered through monitoring from 100 cycles of traffic light at Valiasr-Taleghani intersection in city of Tehran during evening peak hours and recording about 3000 headways. The study is based on the use of linear and nonlinear regression models. The results show that users’violations affect saturation flow rate; one unit increase in the traffic light violations by motorcyclists (per hour) leads to 0.66 unit decrease in the saturation flow rate, and one unit increase in the violations by pedestrians passing the crosswalk near the intersection entrance reduced the saturation flow rate by 0.43. The non-linear regression model was used to estimate the coefficients for each of the violations and to adjust the base saturation flow rate values suggested by the highway capacity manual of United State.
Keywords:Saturation flow rate, intersection capacity, traffic behavior, traffic law violation .
Corresponding author E-mail:boroujerdian @modares.ac.ir
1.M.Sc., Department of Civil and Environmental Engineering, Tarbiat Modares University, Tehran, Iran
Analysis of the Impact of users’ Violations on the Saturation Flow Rate at Signalized Intersections
International Journal of Transportation Engineering, 146 Vol.6/ No.2/ Autumn 2018
1.
Introduction
Intersections are the points of convergence of multiple traffic flows, and therefore, play an important role in the quality of urban transportation network. Most of the delays and travel time of a given transportation network can somehow be traced back to its intersections. At the majority of signalized intersections, the presence of conflict between users, the time lost at the onset of green phase, and other such issues cause the capacity of these intersections to be far less than that of approaches connected to them. Therefore, intersections are commonly considered as the bottlenecks of transportation networks [Lu, Shi and Masato, 2006].
Estimation of saturation flow rate is an important step of any analysis on the performance of urban signalized intersections. In fact, accurate estimation of saturation flow rate is a prerequisite for proper estimation of delays and level of service at a signalized intersection [Shang, Zhang, and Fan, 2014]. Imprecise estimation of saturation flow rate and thus the capacity of the intersection injects an error in all stages of timing, delay calculation, and the resulting level of service. Consequently, function of intersection will be different from what it has been designed for, and the result will be congestion, delays, long queues and poor level of service. To improve the performance of a system, the influencing factors need to be identified and the existing problems have to be studied. In the systems wherein human behavior plays a significant role, this study becomes much more important [Khabiri, 2018]. Intersections are among those systems whose performance are directly dependent on the behavior of users. Saturation flow rate is a major factor in determination of capacity of signalized intersections, and depends on various factors such as geometric characteristics, flow characteristics, type of movement and traffic behavior. Identification of influencing factors and the extent to which they impact the saturation flow rate has always been a challenge. One of the major problematic traffic behaviors in Iran is the violations which occur at physical region of
intersection by users. One example of these violations is the motorcyclists and pedestrians crossing the red traffic light, which lead to not only decreased safety and increased traffic accidents, but also reduced flow rate and capacity and increased delay. The main purpose of this study is to investigate and analyze the impact of violation at physical region of the intersection by users on the saturation flow rate of through movement.
This paper consists of six sections; after the introduction presented in the first section, sections 2, 3, and 4 present, respectively, a review of previous studies, methodology and analysis of sample data. Sections 5 describes the modeling and interpret the results, and sections 6 concludes the paper.
2.
Literature Review
Peiman Mohseni Melerdi,Amin Mirza Boroujerdian
147 International Journal of Transportation Engineering, Vol.6/ No.2/ Autumn 2018 probabilistic model for estimating the capacity
and delay in actuated signalized intersections. Validation of the model showed better results than the Highway Capacity Manual of United States [HCM], and it was also shown that the process of HCM has many errors in low volumes of pedestrians. Chen et al. assessed the capacity reliability of signalized intersection through the assessment of saturation flow rate in mixed traffic conditions (presence of motorized vehicles, pedestrians and bicycles) and found that the capacity reliability is sensitive to the average volume of pedestrians and bicyclers conflicting with the motorized flow and this sensitivity is much greater in high volumes of vehicles [X. Chen, Shao, and Dong, 2009]. Shaw et al. in a study conducted in China found that base saturation flow rate and its adjustment coefficients mentioned in the HCM were not appropriate for China due to differences in culture and traffic behavior [Shao, Rong, and Liu, 2011]. They suggested that 1800 vehicles per hour in lane (pc / h / ln) is appropriate for the base saturation flow rate at signalized intersections of China. Jie et al. studied the capacity of signalized intersection through assessment of saturation flow rate in China and the Netherlands and observed that the performance of intersections in China is 20 to 30 percent weaker than in the Netherlands [Jie, van Zuylen, and Lu, 2012]. These researchers attributed this issue to difference in traffic culture and behavior such as long start lag due to excessive conflict of vehicles with pedestrians at the start of green phase, irregular behavior and sudden lane changing of drivers and limited use of space in China. Jiang assessed the impact of conflict between the pedestrians and vehicles on reduction of saturation flow rate and delay of turning vehicles in Sweden [Jiang, 2014]. The results of this study showed that the impact of conflict on saturation flow rate and delay depends on the volume of pedestrians and vehicles. They reported that a 500 unit increase in the number of pedestrians leads to 100 units decrease in the saturation flow rate of turning vehicles. It was also reported that during
peak hours, pedestrians increase the travel time by 100 percent.
Hunter et al. surveyed 975 recorded events in the US between vehicles and pedestrians during the survey days to determine drivers' performance models at pedestrian crossings [Hunter et al., 2015]. The results of logistic regression analysis show that the probability of drivers' ability to perform performance increased by observing pedestrians due to the effect of factors such as vehicle distance to the crosswalk, low speed of vehicles, presence of pedestrian on the crosswalk edge, and performance of vehicles in the opposite direction of passage. Chen et al. assessed the effect of pedestrians violating the traffic laws on reduction of saturation flow rate of protected left turn lanes in Beijing, China. These researchers divided the pedestrians to 4 levels and reported that violating pedestrians can reduce saturation flow rate by up to 15.7 percent[Chen, He, and Sun, 2015]. They observed that the amount of reduction in saturation flow rate also depends on the distance between the pedestrian and the vehicle, as a distance of less than 4 meters showed more impact on the reduction of saturation flow rate.
As already observed most studies have assessed the reduction of saturation flow rate and capacity of turning vehicles facing the pedestrian in the green phase. But the important difference in Iran is the phenomenon of pedestrians and motorcyclists violating of law by crossing the red light in conflict with the incoming flow. This phenomenon is a problem concerning with traffic behavior and can be seen in many intersections and streets in Iran. This study seeks to assess the impact of this type of violations on the saturation flow rate.
3.
Research Methodology
Analysis of the Impact of users’ Violations on the Saturation Flow Rate at Signalized Intersections
International Journal of Transportation Engineering, 148 Vol.6/ No.2/ Autumn 2018
3.1
Estimation of Saturation Flow
Rate
Saturation flow rate is a qualitative measurement of intersection performance and represents the intersection capacity during operation [falaki, 2009]. When the light turns green, vehicles attempt to cross the intersection. The headway of vehicles in this case can be described as the elapsed time between the passage of rear axle of two consecutive vehicles over the stop line. In HCM method, the effect of drivers’ reaction towards green light and start of acceleration has been assumed for only the first four vehicles in the queue. In this method, time saturation headway is calculated by average of time headways of the fifth vehicle to last one in the queue before the light turns red. If the flow does not get saturated during the whole cycle, the saturation headway must be calculated for at least 10 vehicles in the queue. Saturation flow rate is defined as the amount of flow that would cross a line of intersection during a one-hour long green light [HCM, 2010].
Saturation headway can be calculated through equation (1) and saturation flow rate can be obtained from equation (2).
ℎ =∑𝑛𝑖=5ℎ𝑖
𝑛−4 (1)
𝑆 =3600ℎ (2) In the above equation:
ℎ𝑖: is the headway of vehicle i,
ℎ: is the saturation headway and
S: is the saturation flow rate (vehicle per hour per line).
3.2
Regression Model
Many studies have shown that the saturation flow rate has a normal distribution. Therefore, regression model can be used to estimate saturation flow rate. According to equation (3), linear regression model links the observed saturation flow rate in each phase of the green light to a set of explanatory variables.
𝑌𝑖= 𝛽0+ 𝛽1𝑋1𝑖+ 𝛽2𝑋2𝑖+ ⋯ 𝛽𝑘𝑋𝐾𝑖+ Ɛ𝑖 (3)
In the above equation: k is the index of explanatory variables, Yi is the i-th observed
saturation flow rate, Xki is the value of
explanatory variable k for observation i, βk is the estimated coefficients corresponding to Xki , and β0 is the model constant, which here is equal to
base saturation flow rate (saturation flow rate in ideal conditions). It is assumed that error term Ɛi has a normal distribution with a mean of zero and variance of σ2. Non-linear regression has
different forms such as second order, third order and exponential polynomial and power models. This study uses the power non-linear regression model shown in equation (4), which is a common method for the modeling of saturation flow rate.
(5)
log 𝑦𝑖= log 𝐶0+ 𝐶1log 𝑋1𝑖+ ⋯ 𝐶𝑘log 𝑋𝐾𝑖
After obtaining the coefficients of independent variables, equation (4) can be rewritten as equation (5):
(6)
𝑌𝑖= 𝐶0𝑋1𝑖𝐶1𝑋2𝑖𝐶2… 𝑋𝑘𝑖𝐶𝐾
where cvalues are the constant coefficients (similar to β in linear regression), 𝑋𝑘𝑖 are the explanatory variables, and 𝐶0 equals the base
saturation flow rate.
4.
Sample Data
Peiman Mohseni Melerdi,Amin Mirza Boroujerdian
149 International Journal of Transportation Engineering, Vol.6/ No.2/ Autumn 2018 Figure 1. a view of Valiasr-Taleghani
intersection Figure 2. an image of MAGIX software environment
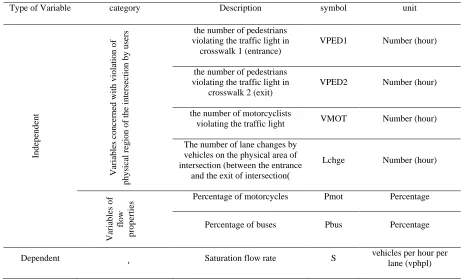
. Table 1. Variables used in modeling
Type of Variable category Description symbol unit
Inde
pende
n
t
Vari
ables c
on
ce
rned
with
violat
io
n
of
physica
l
reg
ion
of
the i
nt
erse
cti
o
n
by
users
the number of pedestrians violating the traffic light in
crosswalk 1 (entrance)
VPED1 Number (hour)
the number of pedestrians violating the traffic light in
crosswalk 2 (exit)
VPED2 Number (hour)
the number of motorcyclists
violating the traffic light VMOT Number (hour)
The number of lane changes by vehicles on the physical area of intersection (between the entrance
and the exit of intersection)
Lchge Number (hour)
Vari
ables of flow
prope
rties
Percentage of motorcycles Pmot Percentage
Percentage of buses Pbus Percentage
Dependent - Saturation flow rate S vehicles per hour per
Analysis of the Impact of users’ Violations on the Saturation Flow Rate at Signalized Intersections
International Journal of Transportation Engineering, 150 Vol.6/ No.2/ Autumn 2018
. Table 2. Statistical description of data
Min Max Mean standard deviation
S 1260 2160 1648 226.20
H 1.67 2.86 2.225 0.301
Pmot 0 33.33 18.489 7.052
Pbus 0 10.53 2.85 3.017
VPED1 0 7 2.2 1.528
VPED2 0 11 2.6 2.29
VMOT 0 4 1.2 1.041
Lchge
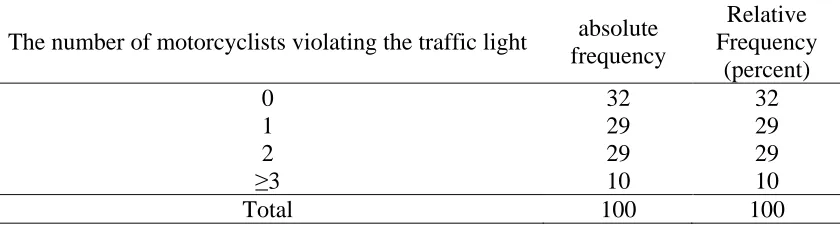
0 7 2.65 1.77Table 3.Frequency distribution of the number of motorcyclists violating the traffic light
The number of motorcyclists violating the traffic light
absolute
frequency
Relative
Frequency
(percent)
0
32
32
1
29
29
2
29
29
3
≤
10
10
Total
100
100
At this intersection, lanes width are almost standard (3.6 meters), and there are no parking lanes near the entrances. In this study, the slope of intersection is assumed to be zero, and the effect of presence of bus stations in the intersection area on the flow rate is assumed to be negligible. Moreover, heavy vehicles in the area inside Tehran do not have the right to drive, and saturation flow rate is evaluated for through movement and the impact of CBD area was ignored. Variables concerned with violation of physical region of the intersection by users. The presence of motorcycles and buses in the traffic flow can have substantial effects on the variations of headway and saturation flow rate. Therefore, in addition to variables related to violations, two additional variables, including percentage of motorcycles and buses to all vehicles were also considered as independent variables.
Table 1 shows the variables used in modeling. Table 2 shows the description of variables, all
defined for a period of 30 seconds after the passage of first four vehicles in each green phase. According to Table 2, the average value of saturation flow rate is estimated to be 1648 vehicles per hour per lane (hereafter abbreviated as vphpl), and the average headway of vehicles is 2.22 seconds. The vehicles flow through entrance and exit lanes is faced with approximately 5 violations by pedestrians.
About 60 percent of pedestrians violating the traffic light are men and the remaining 40 percent are women, which may be due men’s greater inclination to take risks or their less patience for waiting for the traffic lights. The average number of motorcyclists violating the traffic lights is 2.1 per green phase.
The average presence of motorcycles in the traffic flow is 18.5%, but it sometimes reaches up to more than 30%; while for buses these values are 3% and 10% respectively.
Peiman Mohseni Melerdi,Amin Mirza Boroujerdian
151 International Journal of Transportation Engineering, Vol.6/ No.2/ Autumn 2018 have been 2 or more of these violations, which
indicate the fundamental problems in traffic behavior of motorcyclists in Iran. Table 3 also shows the frequency of violations by motorcyclists in each phase of green light for 100 cycles. The high number of violations by pedestrians and motorcyclists can lead to a significant decrease in the saturation flow rate and increase the delay value, and serious problems in term of safety issues may arise. This shows the need to imposing strict laws and making efforts to reform the traffic culture. Since the saturation flow rate is estimated in hours, the independent variables used in the modeling procedure are also in hours.
5.
Results Of Analysis and
Modeling
This section presents the results obtained by estimating the coefficients of linear regression model by the use of STATA software and through ordinary least squares (OLS) method. To fit the regression model in many research and reference books, at least a ratio of 10 data per 1 independent variable is proposed in the model [Harrell, 2013] In this research, the independent variables entered in each regression analysis were maximum 7. As shown in the results of the analysis, the maximum number of coefficients of variables in the model is 5. Accordingly, the minimum observation volume required is 50 to 70. Therefore, the adequacy of the sample number for constructing the regression model is in the current research. To initiate the process of modeling, different types of variables and their logical combination were assessed, and, ultimately, the model with the greatest improvement in the explanatory value (R2) and the best fit (F test) was selected. The results of this part of work are presented in Table 4. The following results are obtained from Table 4:
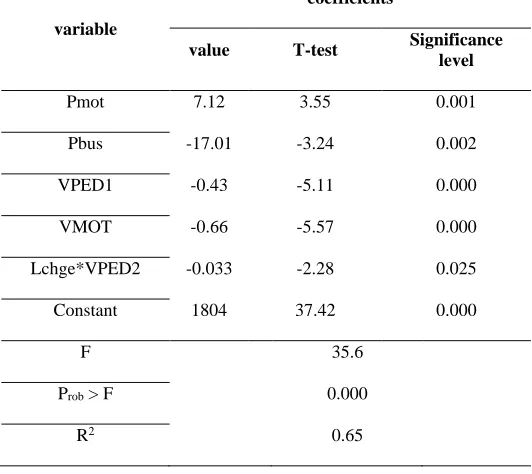
The variable representing the percentage of motorcycle in the traffic flow is statistically significant (t-statistic=3.55) and has an increasing effect on the saturation flow rate. The positive impact
of this variable is due to lower headway of motorcycle compared with other vehicles and the significant presence of motorcyclists in the traffic flow. The coefficient of variable representing the percentage of buses is -17, which shows the significant negative impact of this variable on the saturation flow rate. Naturally, this negative effect can be attributed to slow acceleration and large size of buses.
Analysis of the Impact of users’ Violations on the Saturation Flow Rate at Signalized Intersections
International Journal of Transportation Engineering, 152 Vol.6/ No.2/ Autumn 2018
reduce acceleration and speed when observing motorcycles.
Since the saturation headway is measured on the start line (stop line), according to Table 5, the impact of violating pedestrians at the crosswalk closer to the start line (entrance) is far greater than the impact of those at the farther crosswalk (exit).
The combination (product) of variables representing the number of lane changes and the one representing the number of pedestrians violating the traffic light at crosswalk 2 (exit) showed a statistical significance. As can be observed in the presented images, this result can be attributed to the fact that many of the lane changes occur at the end of physical region near the exit crosswalk. Some of these lane changes is from central lanes toward the side lane (right) for picking up or discharging passengers at the intersection area. On the other hand, these stops lead to congestion and low speed at the side lane and encourage
many drivers to change their lanes toward the center so as to avoid this traffic. The increased number of lane changes in combination with violations of pedestrians near the exit of intersection creates a traffic block causing an extremely slower flow rate and those effect at time headway are transferred toward start line.
The constant obtained from the model is equal to base saturation flow rate (ideal conditions, the absence of explanatory variables). This value is estimated to 1804 passenger cars per hour per lane (pcphpl).
Table 4 shows that all variables in the model are statistically significant at the 95% confidence level, and the R2 of the model is about 0.65, which means that 65% of the variations in saturation flow rate can be explained by the five independent variables used in the model. Meanwhile, the value of F-test is 6.35, and its significance level is zero, which indicates that the combination of independent variables is important in explaining the saturation flow rate.
Table 4. Results obtained by the linear regression model
variable
coefficients
value T-test Significance level
Pmot 7.12 3.55 0.001
Pbus -17.01 -3.24 0.002
VPED1 -0.43 -5.11 0.000
VMOT -0.66 -5.57 0.000
Lchge*VPED2 -0.033 -2.28 0.025
Constant 1804 37.42 0.000
F 35.6
Prob > F 0.000
Peiman Mohseni Melerdi,Amin Mirza Boroujerdian
153 International Journal of Transportation Engineering, Vol.6/ No.2/ Autumn 2018 One of the assumptions of the classical
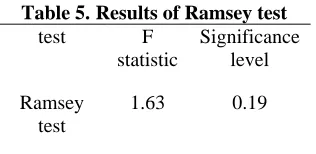
regression model is that the functional form of model has been chosen properly, but this assumption can be wrong and the model may be in another form. The validity of the estimated functional form of the model was checked with the Ramsey test. The null hypothesis of Ramsey test represents correct estimation of functional form or absence of omitted variable in the model. Table 5 shows the values obtained from Ramsey test.
Table 5. Results of Ramsey test
Significance level F
statistic test
0.19 1.63
Ramsey test
According to Table 5, the F statistic is equal to 1.63 and its significance level is 0.19, so the null hypothesis (correctness of estimated functional form) cannot be rejected.
Another assumption of classical linear regression model is the homoscedasticity of error terms. In case of heteroscedasticity of error terms, OLS will be the best estimator for the task, and the values of F and T statistics will not be reliable. In this paper, the heteroscedasticity of error terms was checked with the White test.
Table 6. Results of White test Significance level
χ2 statistic test
0.54 18.62
White test
The null hypothesis of White test is the homoscedasticity of error terms. Table 6 shows the results of White test. According to Table 6, the χ2 test is equal to 18.62 and its significance level is 0.54, which indicates that, at 95%
confidence level, the null hypothesis (homoscedasticity of error terms) cannot be rejected.
According to Table 7, there is a 7 unit increase in the saturation flow rate per unit increase in the percentage of motorcyclists in the traffic flow, while the counterpart value for the buses is -17.
Table 7. Marginal effects of the independent variables
Variable marginal
effect
Pmot 7.12
Pbus -17.01
VPED1 -0.431
VMOT -0.66
Lchge* VPED2 -0.034
Also, a unit increase in the number of pedestrians and motorcyclists violating the traffic light per hour leads to, respectively, 0.43 and 0.66 unit decrease in the saturation flow rate. Table 7 shows the marginal effect of each independent variable on saturation flow rate.
HCM suggests that saturation flow rate should be calculated using the base saturation flow rate and then applying a number of adjustment factors (equation 7). Using equation (7) and assuming a standard lane width and a slope of zero, the coefficients of each independent variable for the HCM base saturation flow rate of S0=1900 were estimated through logarithmic regression model. The base saturation flow rate
Analysis of the Impact of users’ Violations on the Saturation Flow Rate at Signalized Intersections
International Journal of Transportation Engineering, 154 Vol.6/ No.2/ Autumn 2018
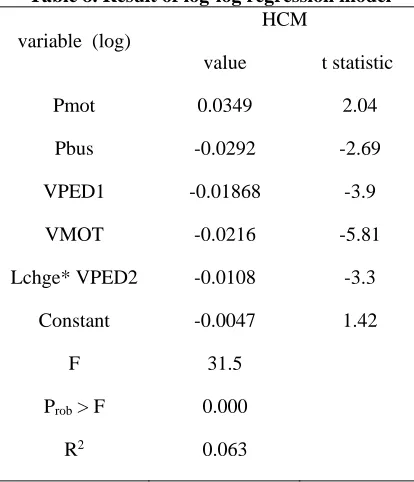
Table 8. Result of log-log regression model
Table 8, shows the results of calibration of logarithmic regression model, all independent variables are statistically significant at the 95% confidence level, The F-test is equal to 31.5 and its significance level is zero, which shows that the null hypothesis stating the lack of effect of independent variables cannot be confirmed. Here, the value of R2 is 0.63, which means that 63% of the variations in saturation flow rate can be explained by the independent variables. Table 9 shows the results of White and Ramsey tests for this model. According to Table 9, the results of Ramsey tests indicates that at 95% confidence level, the null hypothesis stating the correctness of selected functional form and the absence of any omitted variable cannot be rejected. The results of White test also show the absence of heteroscedasticity in the error terms.
In the log-log regression, the slope of each independent variable shows the partial elasticity of its dependent variable with the assumption of other variables being fixed. According to Table 8, one unit increase in the number of motorcyclists
violating the traffic light –when other variables are hold constant- leads to -0.0216 reduction in the ratio of observed saturation flow rate to its theoretical value; the value of counterpart parameter for the pedestrians is -0.01868. According to equation (7), when the base saturation flow rate (S0) is left uninitialized, the constant of the model is equal to logarithm of base saturation flow rate (logS0), and the base saturation flow rate can be estimated from there. After estimating the model coefficients, the value of constant was estimated to be 3.28, and the value of base saturation flow rate was estimated to be 1905 passenger cars per hour per lane (pcphpl), which is very close to the value suggested by the HCM.
Table 9. Results of White and Ramsey test
Significance level F
statistic Test
0.41 0.96
Ramsey test
0.12 27.47
White test variable (log)
HCM
value t statistic Pmot 0.0349 2.04
Pbus -0.0292 -2.69 VPED1 -0.01868 -3.9 VMOT -0.0216 -5.81 Lchge* VPED2 -0.0108 -3.3
Constant -0.0047 1.42 F 31.5
Prob > F 0.000
Peiman Mohseni Melerdi,Amin Mirza Boroujerdian
155 International Journal of Transportation Engineering, Vol.6/ No.2/ Autumn 2018
6.
Conclusion and
Recommendations
Saturation flow rate depends on many factors, including traffic behavior and culture. One of the important problems of traffic culture in Iran is the violation of law at physical region of intersections. In this study, using linear and non-linear regression model, the effect of each of the factors, including violations occurred by pedestrians and motorcyclists while passing traffic light, and drivers’ lane change on saturation flow rate and the capacity of intersection were assessd. The results showed the significant effect of users’ violations on the saturation flow rate, and the effect of each of the variables was evaluated by the use of proposed models. The results also showed the greater effect of the number of violations by motorcyclists - comparted with pedestrians- on the saturation flow rate, which indicates that motorcyclists make a greater disturbance in the traffic flow. A nonlinear (power) regression model was used to estimate the coefficients of each of the explanatory variables based on the value of base saturation flow rate suggested by the Highway Capacity Manual of United States (HCM). These values can therefore be used as adjustment factors. The results of the work can be summarized as follows:
On average, one unit increase in the traffic light violations by pedestrians (per hour per lane) leads to 0.43 decrease in the saturation flow rate.
One unit increase in the traffic light violations by motorcyclists (per hour) leads to 0.66 average decrease in the saturation flow rate.
On average, one unit increase in the percentage of motorcyclists in the traffic flow leads to 7 unit increase in the saturation flow rate; while the value of this parameter for the buses is -17. The linear regression model estimated
the base saturation flow rate to be 1804 passenger cars per hour per lane.
The nonlinear regression model estimated the base saturation flow rate to be 1905 passenger cars per hour per lane, which is close to the value suggested by the HCM.
7.
References
-Chen, X., Shao, C., Li, D. and Dong, C. (2009) "Capacity reliability of signalized intersections with mixed traffic conditions ", Tsinghua Science and Technology, Vol. 14, No. 3, pp. 333-340.
-Chen, Y., He, Y. and Sun, X. (2015) "Impact of pedestrian traffic on saturation rate of protected left-turn at urban intersections ", Open Journal of Applied Sciences, Vol. 5, Ni. 1, 22. Vol. 5, No. 1, pp. 22.
-Coeymans A, J. and Herrera M. J. (2003) "Estimating values for traffic parameters in turning lanes", Transportation Research Record: Journal of the Transportation Research Board, No. 1852, pp. 47–54.
-Falaki, H. (2009) "Saturation flow rate of signalized intersections in Tehran", Dissertation for master’s degree in civil engineering- roads and transportation, Faculty of Engineering, Tehran University.
-Harrell, F. E. (2013) "Regression modeling strategies: with applications to linear models, logistic regression, and survival analysis", Springer Science and Business Media.
-Hunter, E. E., Salamati, K., Elefteriadou, L., Sisiopiku, V. P., Rouphail, N. M., Phillips, B. N. and Schroeder, B. J. (2015) "Driver yielding at unsignalized midblock crossings", In Transportation Research Board 94th Annual Meeting.
-Jiang, D. (2014) "The analysis of the impact between motor vehicles and pedestrians at signalized intersection",
Analysis of the Impact of users’ Violations on the Saturation Flow Rate at Signalized Intersections
International Journal of Transportation Engineering, 156 Vol.6/ No.2/ Autumn 2018
IET Intelligent Transport Systems, Vol. 6 No. (3), pp. 318–327.
-Jin, X., Zhang, Y., Wang, F., Li, L., Yao, D., Su, Y. and Wei, Z. (2009) "Departure headways at signalized intersections: A log-normal distribution model approach", Transportation Research Part C: Emerging Technologies, Vol. 17, No. (3), pp. 318–327.
-Khabiri, M. (2018) "Assessing behavioral patterns of motorcyclists based on traffic control device at city intersections by classification tree algorithm", International Journal of Transportation Engineering, Vol. 5, No. 4, pp. 415–501.
-Lu, H., Shi, Q. and Masato, I. (2006) "A study on traffic characteristics at signalized Intersections in Beijing and Tokyo", In Proc., 2nd Conference of the Eastern Asia Society for Transportation Studies.
-Manual, H. C. (2010) "HCM2010 ", Transportation Research Board, National Research Council, Washington, DC.
Shang, H., Zhang, Y. and Fan, L. (2014) "Heterogeneous lanes’ saturation flow rates at signalized intersections", Procedia-Social and Behavioral Sciences, No.138, pp. 3–10.
-Shao, C., Rong, J. and Liu, X. (2011) "Study on the saturation flow rate and its influence factors at signalized intersections in China", Procedia-Social and Behavioral Sciences, Vol. 16, pp. 504–514.
-Tian, Z. and Xu, F. (2006) "Modeling the effects of pedestrians on intersection capacity and delay with actuated signal control", In Proc., 5th International Symposium on Highway Capacity. Citeseer.
-Viney, N. D. and Pretty, R. L. (1982) "Saturation flow of a movement subject to a pedestrian stream at traffic signals ", Transportation Research Record, No. 1091, pp. 62–67.