Linkage analysis of microsatellite markers on chromosome 5 in an F2
population of Japanese quail to identify quantitative trait loci
affecting carcass traits
M. Ahmadi
1*, A. K. Esmailizadeh
1, A. Ayatollahi Mehrgardi
1and E. Nasirifar
21 Department of Animal Science, Faculty of Agriculture, Shahid Bahonar University of Kerman, Kerman, Iran. 2 Department of Animal Science, Science and Research Branch, Islamic Azad University, Tehran, Iran.
* Corresponding author, E-mail address: ahmadimarjan2000@gmail.com
Abstract An F2 Japanese quail population was developed by crossing two strains (wild and white) to map quantitative trait loci (QTL) for performance and carcass traits. A total of 472 F2 birds were reared and slaughtered at 42 days of age. Performance and carcass traits were measured on all of the F2 individuals. Parental (P0), F1 and F2 individuals were genotyped with 3 microsatellites from quail chromosome 5. Based on five quantitative genetic models analyzed, QTL affecting carcass effi-ciency, breast percentage, femur percentage, back weight and back percentage, head weight, gizzard weight, uropygial weight, liver weight and liver percentage and neck percentage were mapped. The results provided an important framework for further genetic mapping and the identification of quan-titative trait loci controlling performance carcass traits in the Japanese quail
Keywords: carcass trait, microsatellite markers, quantitative trait loci
Received: 1 Jul. 2014, accepted: 14 Oct. 2014, published online: 12 Nov. 2014
Introduction
The recent developments in molecular biology and sta-tistics have increased the possibility of identifying and using genomic variation and major genes for the genetic improvement of livestock. The characteristics for which the application of marker assisted selection can be more effective are those that are expressed late in the life of the animal, or controlled by a few pairs of genes. The first example corresponds to the longevity and carcass characteristics in meat producing animals, the second, to the resistance to certain diseases or defects of simple inheritance. During the last five decades, the application of methods based on population genetics and statistics has allowed the development of animals with high pro-ductive efficiency. Their efficiency decreases when traits are difficult to measure or have a low heritability. Additionally, selection has been generally limited to those characteristics that can more accurately be meas-ured in a large number of animals. Several characteris-tics such as the rate of survival that are expressed very late in the life may serve as useful criteria of selection. Also, the traditional selection within populations is not very efficient when selection objectives involve several characteristics with unfavorable genetic correlation (Carlborg et al., 2001). The impetus to reveal the under-lying mechanisms of complex traits has led to detection
33 tandem repeats of mono-, di-, tri-, tetra-, penta- and hexa-nucleotides (Tautz et al., 1994). SSRs are widely distributed throughout genomes and have been found in all prokaryotic and eukaryotic genomes analyzed to date (Katti et al., 2001, Toth et al., 2000). Microsatellite markers are powerful genetic markers, due to their ge-netic co-dominance, abundance, dispersal throughout the genome, multi-allelic variation, high reproducibil-ity, and high level of polymorphism. This high level of polymorphism is due to mutations affecting the number of repeat units (Chris et al., 2009).
In recent years, genetic linkage maps based on microsat-ellite markers have been constructed for a number of livestock including the Japanese quail (Coturnix japon-ica) (Kayang et al., 2002). This bird belongs to the Pha-sianidae family (Crawford, 1990).The Japanese quail is now a well established animal model in biology and ge-netics (Minvielle, 2004). Japanese quail is phylogenet-ically closely related to the chicken (Stock and Bunch., 1982).Until recently, marker information in quail was very scanty and only three classical linkage groups based on plumage color and blood protein markers (Ito et al., 1988a, Ito et al., 1988b, Shibata and Abe., 1996, Minvielle et al., 2000) were available. But the situation began to change with the development of original mi-crosatellite markers for quail (Kayang et al., 2000, Kayang et al., 2002) and the recent publication of the first ever quail genetic map was based completely on DNA markers (Haley et al., 1994). Taking advantage of the available genetic map of the SSR markers in Japa-nese quail, this study aimed at mapping QTL for perfor-mance and carcass traits.
Material and Methods
Japanese quail resource population
and phenotypic data
An F2 population was derived from a cross between two strains of Japanese quail (meat and layer types). The pa-rental generation (P0)consisted of 8 dams and 8 sires originating from the wild (W) and white (S) strains which were reciprocally crossed to produce the F1
off-spring. F1 birds were generated from S ♂ × W ♀ and
W♂ × S ♀ mating. All of the F1 individuals including 34 birds (9 males and 25 females) were intercrossed to produce 422 F2 offspring (246 males and 176 females) in five consecutive hatches. Thus, 472 quails (16 F0, 34 F1 and 422 F2) constituted the mapping population. All birds were slaughtered at 42 days of age and carcass components, and hot and cold carcasses were evaluated.
DNA extraction and genotyping
Blood samples were collected at slaughter in tubes cont-
aining EDTA and stored at -20ºC. Genomic DNA was purified from each sample (100 μL) using the salting-out extraction method. Microsatellite markers (GuJ0059, GuJ0049 and GuJ0100) on Japanese quail chromosome 5 (CJA05) were chosen from the genetic consensus map based on their location on this chromo-some (0, 12 and 21 cM) according to the literature (Kayang et al., 2002).
Analyses of microsatellite markers
Polymerase chain reaction (PCR) amplifications of each marker for 472 birds were carried out on a Thermal Cy-cler (Eppendorf, UK) in 25 μL reaction mixtures con-taining 2 μL of the DNA template, 1μL of forward and reverse primers, 0.5 μL of dNTP mix, 1μL MgCl2, 2.5
μL PCR buffer and 0.5μL AmpliTaq and 16.5 μL sterile water. The PCR conditions were as follow: 94°C for 4 min, followed by 30 cycles of 94°C for 30 s, annealing for 45 s at 50–55°C depending on the optimized anneal-ing temperature of the primer used, and a final extension at 72°C for 4 min. The PCR products were electro-phoresed at 200 V on an 8.0% polyacrylamide gel and visualized by staining with silver nitrate method. All birds were genotyped for the markers by diversity size of the amplified fragments.
QTL analysis
A genetic model, line-cross (Roussot et al., 2003), was applied for QTL interval mapping analyses using the re-gression method in the QTL Express software (Seaton et al., 2006). The probability of an F2 offspring being each of the four QTL genotypes (QQ, Qq, qQ, and qq) was calculated conditionally upon the marker genotype at each position in the genome at 1cM intervals. In the line-cross analysis, the fixed effects of hatch and sex were included in the model for QTL mapping. The line-cross analysis was initiated with an additive genetic model followed by the models including joint effects of additive, dominance and imprinting. The QTL by sex interaction was assessed to determine whether the effect did differ between the two sexes. The additive QTL ef-fect by hatch interaction was also analyzed.
Chromosome-wide significant thresholds for the pres-ence of a QTL were determined empirically by permut-ing marker data, as described by Churchil and Doerge (1994). Thresholds were obtained from 10,000 permu-tations and are presented as F0.05 and F0.01 for signif-icance at α = 0.05 and α = 0.01 levels, respectively. Con-fidence intervals for QTL location were calculated from 10,000 bootstrap samples (Lander and Kruglyak, 1995). Percentage of the trait variance among the F2 birds
34
Fig. 1. The useful information content (the PIC values) across chromosome 3 of Japanese quail for the additive, dominance, and imprinting effects
RMS
FMS
RMS
V
QTL
100
/
where RMS is the residual mean squares from the re-duced model, omitting desired effect of QTL and FMS is the residual mean squares from the full model, includ-ing desired effect of QTL.
Results and discussion
The information content (IC) shows the useful infor-mation provided by a marker on the genome. In this study, the three markers tested on chromosome 5, were polymorphic.The IC values vary among the markers, where some markers are fully informative and others have an IC <0.5. The useful information contents of the markers used in this study in different parts of the chro-mosome 5 of Japanese quail are presented in Fig. 1. The QTL, with suggestive and significant linkages ob-tained from each model, are summarized in Tables 1-5. The QTL regions were identified for eleven carcass traitsonchromosome 5; the QTL effects rangedfrom
0.2 to 5% of the phenotypic variation. The first QTL was located at 0 cM and associated with the uropygial weight. This QTL interacted with the sex of the birds. The second region was located at 9 cM containing QTL associated with the carcass efficiency. Close to this re-gion, significant QTL were found that were related to percentage of gizzard.
The QTL for liver percentage, back weight and percent-age of back were identified at 12 cM on chromosome 5. Additional QTL were mapped at 13 cM for head weight, at 14 cM for liver weight, at 17 cM for back weight, at 18 cM for percentage of neck and back weight, at 20 cM for breast percentage. At the end of chromosome (21 cM) significant QTL were located for percentage of fe-mur and breast.
One of the most important traits in poultry industry is carcass efficiency. For this trait, a significant (p<0.05) QTL was located at 9 cM of the centromere on 5 chro-mosome with additive effect (Table 1). This QTL ex-plained 1.15% of the phenotypic variance. Interaction of
Table 1. Summary of quantitative trail loci (QTL) obtained from modeling additive QTL effects Trait Position
(cM) F-value
QTL Effect1 (S.E.)
VQTL2 Closest marker Carcass efficiency 9 5.64* 0.21 (0.08) 1.15 GUJ0049 breast percentage 21 7.56* -0.24 (0.08) 1.55 GUJ0100 1The additive QTL effect, 2 QTL variance (the reduction in residual variance of the F2 population obtained by inclusion of a QTL at the given position), * P < 0.05.
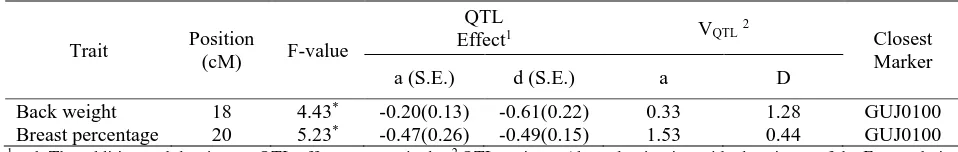
Table 2. Summary of quantitative trail loci (QTL) obtained from joint modeling of the additive and dominance QTL effects
Trait Position
(cM) F-value
QTL
Effect1 VQTL2
Closest Marker a (S.E.) d (S.E.) a D
35
Table 3. Summary of quantitative trait loci (QTL) results obtained from modeling of additive, dominance and imprinting QTL effects
Trait Position
(cM) F-value
QTL Effect1 VQTL2
Closest Marker a (S.E.) d (S.E.) I(S.E.) a d i
Back weight 17 3.58* -0.21(0.13) 0.66(0.22) -0.18(-0.12) 0.33 1.28 0.20 GUJ0100 1 a, d, i: The additive, dominance and imprinting QTL effects, respectively; 2 QTL variance (the reduction in residual variance of the F2 popu-lation obtained by inclusion of a QTL at the given position), * P < 0.05.
QTL by hatch for carcass efficiency was significant (p<0.01) in two hatches (Table 4).
Breast muscle is the most economically valuable part in poultry. Two suggestive linkages were found for per-centage of breast (20, 21 cM). The additive effects of this QTL were negative (Table 1). A QTL by sex inter-action was detected for breast percentage at this region that was significant only in female quails (Table 5). More generally, a QTL by sex interaction can be sidered as a genotype by environment interaction, con-sidering sex as an organismal environment for gene ex-pression. The same phenotypic measurement could then be considered as different traits in the sexes. Significant QTL by sex interactions were also found for back weight and percentage of back weight, uropygial weight and head weight (Table 5).
When analyzing a three-generation QTL design, using a cross between divergent lines (same as the meat type wild and layer type white strains studied herein), the line-cross model can provide the best fit to the data. Such a design fitted well into our current objective of QTL coarse mapping. A genome scan involves fitting a statistical model at multiple locations in the genomic grid with the objective of finding the location(s) in the genome with significant statistical support for a QTL or multiple QTL. We used a genetic-map-based grid with a genetic distance of 1 cM between the nodes. We used five different genetic models and successfully identified the QTL evaluated among all the possible combinations of QTL that exist.
In chicken, there are several QTL studies carried out for anumber of growth(Li etal., 2003,Zhu et al., 2003),
body weight (Van Kaam et al., 1999, Tatsuda and Fu-jinaka., 2001, Sewalem et al., 2002, De Koning et al., 2003) and fat (Ikeobi et al., 2002) traits. The first genetic map for quail was produced exclusively with AFLP markers and was used for mapping QTL responsible for behavioral traits (Roussot et al., 2003). However, in the context of the QTL localization in Japanese quail, Minvielle et al. (2005), using the first microsatellite linkage map, reported QTL for growth traits, feed in-take, weight and total number of eggs, tonic immobility and rectal temperature. In addition, Esmailizadeh et al. (2012) and Sohrabi et al. (2012) reported QTL for growth traits on chromosome 1 while Moradian et al. (2014) found QTL for carcass trait on chromosome 1. Jabbari et al. (2013) identified QTL for growth traits on chromosome 3 in Japanese quail. Our finding is the first report of QTL on chromosome 5 affecting carcass traits in Japanese quail.
In this study, QTL affecting different traits were mapped to similar chromosomal regions. These repre-sent evidence for the basis of genetic correlations among traits, and for correlated response to selection, if they are indeed controlled by the same pleiotropic QTL or by closely linked QTL that are in linkage disequilib-rium (LD). However, higher resolution analysis is re-quired to distinguish LD from pleiotropy.
In conclusion, the current study identified informative QTL regions that would form a useful resource as a part of our initiative to develop DNA tests for carcass quality in Japanese quail. However, it should be emphasized that to identify candidate genes and informative markers that are in linkage disequilibrium with QTL affecting
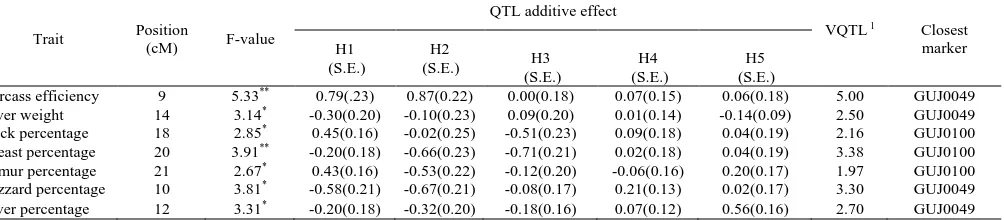
Table 4. Summary of quantitative trait loci (QTL) results obtained from modeling QTL by hatch interaction
Trait Position (cM) F-value
QTL additive effect
VQTL 1 Closest
marker H1
(S.E.)
H2
(S.E.) H3 (S.E.)
H4 (S.E.)
H5 (S.E.)
Carcass efficiency 9 5.33** 0.79(.23) 0.87(0.22) 0.00(0.18) 0.07(0.15) 0.06(0.18) 5.00 GUJ0049
Liver weight 14 3.14* -0.30(0.20) -0.10(0.23) 0.09(0.20) 0.01(0.14) -0.14(0.09) 2.50 GUJ0049
Neck percentage 18 2.85* 0.45(0.16) -0.02(0.25) -0.51(0.23) 0.09(0.18) 0.04(0.19) 2.16 GUJ0100
Breast percentage 20 3.91** -0.20(0.18) -0.66(0.23) -0.71(0.21) 0.02(0.18) 0.04(0.19) 3.38 GUJ0100
Femur percentage 21 2.67* 0.43(0.16) -0.53(0.22) -0.12(0.20) -0.06(0.16) 0.20(0.17) 1.97 GUJ0100
Gizzard percentage 10 3.81* -0.58(0.21) -0.67(0.21) -0.08(0.17) 0.21(0.13) 0.02(0.17) 3.30 GUJ0049
Liver percentage 12 3.31* -0.20(0.18) -0.32(0.20) -0.18(0.16) 0.07(0.12) 0.56(0.16) 2.70 GUJ0049
36
Table 5. Summary of quantitative trait loci (QTL) results obtained from modeling QTL by sex interaction
Trait Position (cM) F value
QTL additive effect
VQTL1 Closest marker Male
(.S.E.)
Female (.S.E.)
uropygial weight 0 4.57** 0.14(0.00) 0.28(0.00) 1.92 GUJ0059 Back weight 12 6.58* -0.60(0.16) 0.14(0.14) 2.73 GUJ0049 Head weight 13 4.79* -0.58(0.20) 0.13(0.17) 1.76 GUJ0049 Breast percentage 20 4.91* -0.08(0.14) -0.37(0.12) 1.85 GUJ0100 Back percentage 12 3.83* -0.31(0.11) -0.03(0.10) 1.34 GUJ0049 1 QTL variance (the reduction in residual variance of the F2 population obtained by inclusion of a QTL at the given position).
carcass traits, association studies using SNPs markers might be needed for the significant QTL regions de-tected in this study.
References
Anderson, L., Haly, C.S., Ellegren, H., Knott, S.A., Johans-son, M., AnderJohans-son, K., Eklund, L., Edfors-Lilja, I., Fredholm, M., Hansson, I., Hakansson, J., Lundstrom, K., 1994. Genetic mapping of quantitative trait loci for growth and fatness in pigs. Science 2631771-1774.
Carlborg, O., Andersson-Eklund, L., Andersson, L., 2001. Parallel computing in interval mapping of quantitative trait loci. Journal of Heredity 92, 449–451.
Chase, K., Adler, F.R., Lark, K.G., 1997. Epistat: a computer program for identifying and testing interactions between pairs of quantitative trait loci. Theoretical and Applied Ge-netics 94, 724–730.
Chris, D., Nikki, A., David, E., Batley, J., 2009. Molecular Genetic Markers: Discovery, Applications, Data Storage andVisualisation, Current Bioinformatics. 4, 16-27. Churchill, G.A., Doerge, R.W., 1994. Empirical threshold
values for quantitative trait mapping. Genetics 138, 963– 971.
Crawford, R.D., 1990. Origin and history of poultry species. In: Crawford, R.D. (Ed.), Poultry breeding and genetics. Elsevier, Amsterdam, pp. 1– 41.
Darvasi, A., Soller, M., 1997. A simple method to calculate resolving power and confidence interval of QTL map loca-tions. Genetics 27,125-132.
De Koning, D.J, Windsor, D., Hocking, P.M., Burt, D.W., Law, A., Haley, C.S., Morris, A., Vincent, J., Griffin, H., 2003. Quantitative trait locus detection in commercial broiler lines using candidate regions. Animal Science 81, 1158-1165.
Esmailizadeh A.K., Baghizadeh, A., Ahmadizadeh, M., 2012. Genetic mapping of quantitative trait loci affecting body-weight on chromosome 1 in a commercial strain of Japanese quail. Animal Production Science 52, 64–66.
Georges, M., Nielsen, D., MacKinnin, M., Mishra, A., Okimoto, R., Pasquito, A.T, Sargeant, L.S., Sorensen, A., Steele,M.R,Zhao, X.,Womack,J.E.,Hoeschele,1. 1994.
Using a complete microsatellite map and the granddaughter design to locate polygenes controlling milk production. Pro-ceedings of the 5th World Congress on Genetics Applied to Livestock Production 21, 81-85.
Haley, C., Knott, S., Elsen, J., 1994. Mapping quantitative trait loci in crosses between outbred lines using least squares. Genetics 136, 1195–1207.
Ikeobi, C.O., Woolliams, J.A., Morrice, D.R. et al. 2002. Quantitative trait loci affecting fatness in the chicken. Ani-mal Genetics 33, 428–35.
Ito, S., Kimura, M., Isogai, I., 1988a. A sex difference in re-combination values between extended brown and phos-phoglucoseisomerase loci in Japanese quail. Japanese Jour-nal of Zootechnical Technical Science 59, 801–5.
Ito, S., Kimura, M., Isogai, I., 1988b. Linkage between panda plumage and albumin loci in Japanese quail. Japanese Jour-nal of Zootechnical Science 59, 822–4.
Jabbari Ori, R., Esmailizadeh, A. K., Charati, H., Moham-madabadi, M.R., Sohrabi, S.S., 2013. Identification of QTL for live weight and growth rate using DNA markers on chro-mosome 3 in an F2 population of Japanese quail. Molecular Biology Reports 41, 1049–1057.
Katti, M.V., Ranjekar, P.K., Gupta, V.S., 2001. Differential distribution of simple sequence repeats in eukaryotic ge-nome sequences. Molecular Biology and Evolution 18, 1161-1167.
Kayang, B., Inoue-Murayama, M., Hoshi, T., Matsuo, K., Takahashi, H., Minezawa, M., Mizutani, M., Ito, S. 2002. Microsatellite loci in Japanese quail and cross-species am-plification in chicken and guinea fowl. Genetics Selection Evolution 34, 233–253.
Kayang, B., Inoue-Murayama, M., Nomura, A., Kimura, K., Takahashi, H., Mizutani, M., Ito, S., 2000. Fifty microsatel-lite markers for Japanese quail. The Journal of Heredity 91, 502–5.
Lander, E., Kruglyak, L., 1995. Genetic dissection of com-plex traitsguidelines for interpreting and reporting linkage results. Nature Genetics 11, 241–7.
37
growth factor-beta genes, Poultry Science 82, 347–356. Minvielle, F., 2004. The future of Japanese quail for research
and production. World's Poultry Science 60:500-507. Minvielle, F., Ito, S., Inoue-Murayama, M., Mizutani, M.,
Wakasugi, N., 2000. Genetic analyses of plumage color mu-tations on the Z chromosome of Japanese quail. The Journal of Heredity 91, 499–501.
Minvielle, F., Kayang, B.B, Inoue-Murayama, M., Miwa, M., Vignal, A., Gourichon, D., Neau, A., Monvoisin, J.L., Ito, S., 2005. Microsatellite mapping of QTL affecting growth, feed consumption, egg production, tonic immobility and body temperature of Japanese quail. BMC Genomics 6:87. Moradian, H., Esmailizadeh, A.K., Sohrabi, S.S., Nasirifar,
E., Askari, N., Mohammadabadi, M.R., Baghizadeh, A., 2014. Genetic analysis of an F2 intercross between two strains of Japanese quail provided evidence for quantitative trait loci affecting carcass composition and internal organs.
Molecular Biology Reports 41:4455–4462.
Roussot, O., Feve, K., Plisson-Petit, F., Pitel, F., Faure, J.M., Beaumont, C., Vignal, A., 2003. AFLP linkage map of the Japanese quail Coturnix japonica. Genetics Selection Evo-lution 35, 559–72.
Seaton, G., Hernandez, J., Grunchec, J.A., White, I., Allen, J., De Koning, D.J., Wei, W., Berry, D., Haley, C., Knott, S., 2006. A grid portal for qtl mapping of compute intensive datasets. 8th World Congress on Genetics Applied to Live-stock Production, August 13-18 Belo Horizonte, MG, Bra-sil.
Sewalem, A., Morrice, D.M., Law, A., Windsor, D., Ikeobi, C.O.N., Burt, D.W., Hocking, P.M., 2002. Mapping of quantitative trait loci for body weight at three, six, and nine weeks of age in a broiler layer cross. Poultry Science 81, 1775-1781.
Shibata, T., Abe, T., 1996. Linkage between the loci for se-rum albumin and vitamin D binding protein (GC) in the Jap-anese quail. Animal Genetics 27, 195–7.
Sohrabi, S.S, Esmailizadeh, A.K, Baghizadeh, A., Moradian, H., Mohammadabadi, M.R., Askari, N., Nasirifar, E., 2012. Quantitativetrait loci underlying hatching weight and growth traits in an F2 intercross between two strains of Jap-anese quail. Animal Production Science 52, 1012–1018. Stock, A.D., Bunch, T.D., 1982. The evolutionary
implica-tions of chromosome banding pattern homologies in the bird order Galliformes. Cytogenetics and Cell Genetics 34, 136– 48.
Tatsuda, K., Fujinaka, K., 2001. Genetic mapping of the QTL affecting abdominal fat deposition in chickens. Poultry Sci-ence 38, 266–74.
Tautz, D., Schlotterer, C., 1994. Concerted evolution, molec-ular drive and natural selection-reply. Current Biology 4, 1166-1166.
Toth, G., Gaspari, Z., Jurka, J., 2000. Microsatellites in dif-ferent eukaryotic genomes: Survey and analysis. Genome Research 10, 967-981.
Van Kaam, J.B., Groenen, M.A., Bovenhuis, H. et al., 1999. Whole genome scan in chickens for quantitative trait loci affecting carcass traits. Poultry Science 78, 1091–9. Zhu, J. J., H. S. Lillehoj, P. C., Allen, C. P., Van Tassell, T.
S.,Sonstegard, H. H., Cheng, D., Pollock, M., Sadjadi, W.,. Emara, M. G., 2003. Mapping quantitative trait loci associ-ated with resistance to coccidiosis and growth. Poultry
Sci-ence 82, 9–16.
38
یژاکنیل زیلانآ
هرامش موزومورک یور رب تیلاتاسورکیم یاهرکرام
5
تیعمج کی رد
F2
نیچردلب زا
هشلا تافص رب رثوم یمک تافص هاگیاج ییاسانش یارب ینپاژ
.م
یدمحا
*
،
ع
.
یلیعمسا
هداز
هیئوکشک
،ا ،
ا و یدرجرهم یهلا تیآ
.
رف یریصن
:کینورتکلا تسپ ،لوئسم هدنسیون
ahmadimarjan2000@gmail.com
هدیکچ تیعمج کی
F2
یمی کادا صاهیاج یبای یهش نایب بدیدس و یویشو ییوس ود یقلات اب ینپاژ نیچردلب زا
(QTL)
یمش عدیب صدوو داشیا ایش دیآلمر و وو ه کادووا نایب 274
صدشیپ
F2
نووس رد و صداد شرویپ 24
یگزور
دایفا مه نور ایش دیآلمر و ه کادا عدشد راتیی
F2
ادشا نیدلاو عد نییگ صز
(P0)
،
F1
لسش ناگدشیپ و
F2
اب
زا صدادتوسا 3
موزی ویی زا تیلاتاسویآی ییرا 5
ساسا یب زیلاش عدشدیب صد یبای پیتیشژ نیچردلب 5
یمی کیتشژ لد
ی دو ماششا
QTL
نزو ،ناد نیچ نزو ،یس نزو ،تیپ دارد و نزو ،نار دارد ، نیوس دوارد ، و ه ییارای یب یثی
و یثی یآیتشژ یبای یهش نایب بی میچرایچ کی ییاتش عد یبای یهش ندیگ دوارد و ددی دوارد و نزو ،لایشیپوریی