Please cite this article in press as: Mohammadpour RA, Golalizadeh M, Moharrami L. A bias-variance trade-off in the
Original Article
A bias-variance trade-off in the prediction error estimation behavior in bootstrap methods for microarray leukemia classification
Reza Ali Mohammadpour1*, Mousa Golalizadeh2, Leila Moharrami1
1 Biostatistics Department, Faculty of Health, Mazandaran University of Medical Sciences, Sari, Iran 2 Statistics Department, Faculty of Mathematical Sciences, Tarbiat Modarres University, Teheran, Iran
ARTICLE INFO ABSTRACT
Received 22.12.2017 Revised 03.01.2018 Accepted 16.03.2018
Background & Aim: The bootstrap is a method that resample from the original data set. There are the wide ranges of bootstrap application for estimating the prediction error rate. We compare some bootstrap methods for estimating prediction error in classification and choose the best method for the microarray leukemia classification.
Methods & Materials: The sample consist of n=38 patients with acute lymphoblastic leukemia (ALL) and acute myeloid leukemia (AML) with p=4120 genes that n<<p from an existing database. We carried out following steps. (1) Resample from the original sample. (2) Divide the sample to two sets, learning set and test set by 3-fold cross validation. (3) Train 1NN, CART and DLDA classifiers and compute its misclassification error by comparing the predicted class of the remaining samples with the true class. (4) Average the errors on B bootstrap samples.
Results: Standard deviation, bias and MSE for comparing four bootstrap methods by three classifiers were computed. For choosing the best method, we assess a bias-variance trade-off in the behavior of prediction error estimates. The 0.632+ BT is approximately un-bias and has small variability. However, the LOOBT procedure has big variability and is biased. Also we provide a table and some figures in the section 4.
Conclusion: The bias and variance of the prediction error rates have high variability in various bootstrap methods. Although the 0.632+ BT is approximately un-bias and has small variability, other resampling methods maybe are useful for the microarray classification in the different situations.
Key words: Bootstrap;
Classification algorithms; Cross-validation; Microarray; Prediction accuracy
Introduction
DNA microarray technology is now commonly used in cancer research and provides gene-expression microarray data for classification and prediction patient disease outcome (1, 2). Predictive power is related to classification methods, learn or test data set and resampling techniques and it needs to assess. Estimating the accuracy of a classifier is important not only to predict its future prediction accuracy, but also to choose a classifier from a given set (3). An accurate prediction rule helps to improve the rates of correct diagnosis and proper treatment assignments for cancer patients
(1). An ina ccurate prediction may lead to false findings unless appropriate statistical methods are utilized (4). For estimating the final accuracy of a classifier, we would like an estimation method with low bias and low variance but statistically it’s impossible and there is a bias-variance trade-off in the behavior of prediction error estimates (3). In the literature there are many studies for estimating prediction error with different methods with contradictory results in bias, variation and accuracy rates. A microarray experiment can monitor expression patterns of thousands of genes simultaneously. But due to their cost and complexity, such experiments are often restricted to a small number of specimens (1). Microarray analysis presents a unique challenge in statistics which is characterized by a small sample size n and a large number p of features, often with n<<p (4, 5). Estimation of misclassification error has received increasing attention in clinical diagnosis and bioinformatics
_____________________________________________________
J Biostat Epidemiol. 2018; 4(3): 167-172
studies, especially in small sample studies with microarray data. Current error estimation methods are not satisfactory because they either have large variability or large bias. While accurate and easy-to-implement error estimation methods for small samples are desirable and will be beneficial (6). Complexity of high-dimensional microarray data, difficulty of model selection, small sample restricted are caused that error estimation to be critical to classification reported by some studies in the literature. Underestimation or overestimation the true prediction error was reported in Ordinary BT, bootstrap cross validation (BTCV), leave-one-out bootstrap (LOOBT) and other bootstrap methods (7-10). Comparison of bootstrap methods maybe useful to finding sources of biasness or variability in usual error estimators on microarray data.
There are two major acute leukemia classes, acute myeloid leukemia (AML) and acute lymphoblastic leukemia (ALL). Acute leukemia progress quickly, and can lead to death of a patient within months when not treated. Medical treatment of patients will vary depending on the leukemia class. Thus, knowledge of the leukemia class is very important information for doctors to predict cancer type and correctly treat patients (11, 12).
In this study was implemented some existing methods for estimating the prediction error in classifying microarray leukemia patients data where the number of genes greatly exceeds the number of specimens.
Methods
In a microarray classification, we observe x_i=(t_i,y_i) , i=1,…,n , on n independent subjects, where t_i is a p-dimensional vector containing the gene expression measurements and yi is the response for subject i. The observations can be viewed as realizations of an underlying random variable X= (T, Y). With dichotomous outcome, the response variable Y takes 0 or 1 values distinguishing the two classes. A classification model is developed based on the information in the learning set for predicting of future item class, misclassification may occur. The true prediction error (e_n = E ( I {Y ≠ r(T, x)}) ) is the probability that the prediction model built on the observed data x=(x_1,…,x_n) misclassifies a future item following the same random mechanism as X (1).
When the prediction rule is built for the small observed data, in microarray experiments, there are numerous methods for estimating prediction errors rely on partitioning or resampling the observed data to construct the learning and test sets (1, 7-9). Developing a class predictor in high dimensional data, contain two key steps: the feature selection and the class prediction step. The first step is determining which genes to include in the predictor. This is generally called ‘feature selection’ or, in the context of microarray prediction, gene selection. The most commonly used approach to feature selection is to identify the genes that are differentially expressed among the classes when considered individually. A t-test or a Mann-Whitney test for each gene (4) and selection procedures based on the use of criteria such as an F ratio (10) often used. The genes that are significantly differentially expressed at a specified significance level are selected for inclusion in the class predictor (4) and were computed in the R software in this study. For the second step, many algorithms have been used effectively with DNA microarray data for class prediction (13). The algorithms compared included one nearest neighbor classification (1NN) and several variants of classification and regression trees (CART) and diagonal linear discriminant analysis for the reason of continuous variables.
Bootstrap resampling Methods
These methods draw bootstrap samples of size n repeatedly from the original data x by simple random sampling with replacement. Four commonly used methods were compared in this study.
Ordinary bootstrap: In this method, a prediction rule is built on a bootstrap sample and tested on the original sample. Averaging the misclassification rates across all bootstrap replication gives the ordinary bootstrap prediction error estimate. This method has the problem that the learning and test sets overlap (14).
Leave-one-out bootstrap: This procedure (5) generates a total of B bootstrap samples of size n. Each observed specimen is predicted repeatedly using the bootstrap sample in which the particular observation does not appear. In this way, the method avoids testing a prediction model on the specimens used for constructing the model. The leave-one-out bootstrap estimate is given by
̂ =1 | |1 { ≠ , ∗, }
Where C_i is the collection of bootstrap samples not containing observation i and |C_i | is the number of such bootstrap samples.
0.632+ Bootstrap: The 0.632+ bootstrap is proposed by Efron and Tibshirani (15) in order to reduce the upward bias of the leave-one-out bootstrap. The estimate has the form
̂ . = ̂ + (1 − ) ̂
Where the weight w is between 0 and 1 and e ̂_n^RSB is the resubstitution estimate. Taking w=0.632 gives the 0.632 bootstrap originally proposed by Efron (5). When the re-substitution error is zero, the 0.632 bootstrap estimates become 0.632 e ̂_n^LOOBT .
Methodology
This study is a comparative study on existing data which was approved by ethics committee of Mazandaran University of Medical Sciences in Iran. The initial samples consist of n=38 patients with acute lymphoblastic leukemia (ALL, 27 cases) and acute myeloid leukemia (AML, 11 cases) with p= 4120 genes that n<<p from an existing data set (2, 11). The leukemia dataset and all details with respect to the methods used to collect the data are described in the paper of Golub et al (11) and the dataset, available at http://www.genome.wi.mit.edu/MPR (11).
We carried out following steps. (1) Resample from the original sample. We draw bootstrap samples with replacement B=100 times from original sample. Running 50 to 100 bootstrap replications is often considered more than adequate (14, 16). A bootstrap sample of size n consist roughly 0.632n distinct observations from the original sample (1). (2) Divide the sample into two sets, learning set and test set.
Cross-validation is a statistical method of evaluating and comparing learning algorithms by dividing data into two segments: one used to learn or train a model and the other used to validate the model by 3-fold cross validation (17). (3) Train 1NN, CART and DLDA classifiers and compute it’s misclassification error by comparing the predicted class of the remaining samples with the true class. For class discrimination, we consider the diagonal linear discriminant analysis (DLDA), the one nearest neighbor with Euclidean distance (1NN) and the classification and regression tree (CART). These algorithms are available through built-in functions in the statistical package R (18). Details of these R functions are described in Molinaro et al. (8). (4) Average the errors on B bootstrap samples. For each method, we report the average estimate (Est.) and the standard deviation (STD) as well as the averaged bias (Bias) and mean-squared error (MSE) with respect to the ‘true’ prediction error e ̃_n. The ‘true’ prediction error e ̃_n is the misclassification rate when a prediction rule built on the sample is tested on those n=38 patients not selected in the sample. For choose the best method there is a bias-variance trade-off in the behavior of prediction error estimates (1) on an existing gene database (11).
Results
In Table 1, we report the methods in groups with downward bias, large variability and large upward bias and cells with these unfavorable feature are highlighted in boldface.
In figure1 has shown the standard deviation (STD), averaged bias (Bias) and mean-squared error (MSE) for CART classifier. We first look at the outcome when the CART classifier is used. Both LOOBT and 0.632+ BT estimates suffer from downward bias. Also LOOBT and Ordinary BT estimation suffer from large variability.
J Biostat Epidemiol. 2018; 4(3): 167-172
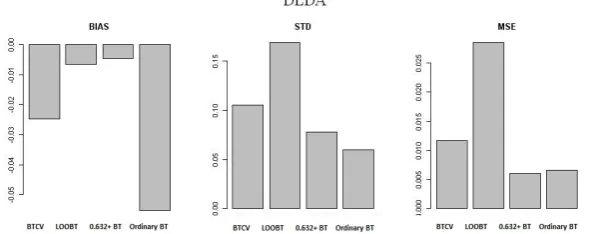
In classification with DLDA, all estimates have downward bias. BTCV and LOOBT estimates have biggest variability (Figure 3).
With respect to bias-variance trade-off in the behavior of prediction error estimates 0.632+ BT performs well.
Table 1. The average estimate (Est.) standard deviation (STD), averaged bias (Bias) and mean-squared error (MSE) for classifiers
Classifier Prediction error
estimation methods Est. STD Bias MSE
CART BTCV 0.291 0.073 0.028 0.006
LOOBT 0.220 0.103 -0.042 0.012
0.632+ BT 0.180 0.077 -0.082 0.012
Ordinary BT 0.299 0.101 0.155 0.034
DLDA BTCV 0.293 0.105 -0.024 0.011
LOOBT 0.311 0.168 -0.006 0.028
0.632+ BT 0.313 0.077 -0.004 0.006
Ordinary BT 0.263 0.059 -0.055 0.006
1NN BTCV 0.403 0.122 0.113 0.027
LOOBT 0.292 0.146 -0.082 0.028
0.632+ BT 0.335 0.116 -0.039 0.014
Ordinary BT 0.413 0.141 0.152 0.043
Figure 1. The standard deviation (STD), averaged bias (Bias), and mean square error (MSE) for CART classifier
Figure 2. The standard deviation (STD), averaged bias (Bias), and mean square error (MSE) for 1NN classifier
Discussion
This study results show that LOOBT has large variability in all classifiers. Large variability of Ordinary BT error estimators in CART and 1NN classifiers is observed. Also BTCV has large variability in DLDA and 0.632+ BT often has small variability in all classifiers. The results given in the present study are showed that the comparison between bootstrap methods for estimating of prediction error in various algorithms is not straightforward. Complexity of high-dimensional microarray data, difficulty of model selection, small sample restricted are caused that error estimation to be critical to classification. These are consistent with some studies in the literature (13-15). Large variability may affect to underestimation or overestimation the true prediction error in Ordinary BT, BTCV and LOOBT. Overlap between the resampled learning and test sets cause serious underestimation of the prediction error. Such overlaps occur, for instance, in the ordinary bootstrap procedure and the bootstrap cross-validation (10). Also for the reason of small sample size, the leave-one-out bootstrap estimate tends to overestimate the true prediction error (1, 20).
For microarray data with n<p, the over fitting problem always exists and the re-substitution error estimate is often close to zero. The 0.632+ bootstrap tends to put too much weight on the leave-one-out bootstrap estimate in this situation (1). Our study shows that in all classifiers, 0.632+BT estimate is approximately un-bias and has small variability. The 0.632+ BT performs well with respect to other methods. These results in this study are consistent with the more recent 0.632+ bootstrap error estimator attempts to set the weight adaptively vs a fixed 0.632 weight (16). For instance Vu T et al (19) showed that required weight for unbiasedness can deviate significantly from the constant 0.632 weight, depending on the sample size and Bayes error for the finite sample problem in the case of linear discriminant analysis under Gaussian populations. Dougherty ER et al reported the generally these error estimators have poor performance and much greater effort needs to be focus on error estimators (20). In this leukemia data set the diagonal quadratic discriminant analysis as a non-linear model may improves the system performance in classification with small number of genes (21). A lot of studies have
reported gene selection methods and statistical methods for interpreting pattern and classifying of leukemia disease (12). The optimistic bias induced by optimal gene selection and optimal selection of the classification method was quantified in a study (22) and showed that some classifier such as KNN should be combined with variable selection, but DLDA can technically be applied to data with n<<p, usually perform better on a reduced subset of relevant genes.
The focus in this article was on the error estimate rates by four bootstrap methods in the three selected classifier methods. For the avoiding of complexity in high-dimensional microarray data and difficulty of model selection, real well-known data were used. With respect to presence of bias and variability differences for estimating the prediction error in a well-known leukemia data, we conclude that the behavior of 0.632+BT is much greater balance than other methods in a bias-variance trade-off.
Conclusion
In all classifiers, LOOBT estimate has biggest variability and 0.632+BT estimate is approximately un-bias and has small variability. The 0.632+ BT performs well with respect to other methods.
Ethics approval and consent to participate This study was performed on existing data after approving in ethical committee of Mazandaran University of medical sciences, and included existing patient data bank.
Availability of data and materials
All data analysed during this study are included in this published article (available at http://www.genome.wi.mit.edu/MPR).
Conflict of interest: The authors declare that they have no competing interests.
Acknowledgements
J Biostat Epidemiol. 2018; 4(3): 167-172
Conflicts of interests
The authors declare that there is no conflict of interest regarding the publication of this article.
References
1. Jiang W, Simon R. A Comparison of Bootstrap Methods and Adjusted Bootstrap Approach for Estimating the Prediction Error in Microarray Classification. Statist Med. 2007; 26:5320–34. 2. Lusa L, Radmacher M, McShane LM, Shih JH,
Wright GW, Simon R. Appropriateness of some resampling-based inference procedures for assessing performance of prognostic classifiers derived from microarray data. Statist Med. 2007; 26:1102-13.
3. Kohavi R. A Study of Cross-Validation and Bootstrap for Accuracy Estimation and Model Selection. IJCAI, 1995. 1137–45 [Online]. http://citeseerx.ist.psu.edu/viewdoc/summary?doi =10.1.1.48.529
4. Simon R. Diagnostic and Prognostic Prediction using Gene Expression Profiles in High-Dimensional Microarray Data. Br J Cancer. 2003;89:1599-604.
5. Efron B. Estimating the error rate of a prediction rule: Improvement on cross-validation. J Am Stat Assoc. 1983;78(382):316-31.
6. Fu WJ, Carroll RJ, Wang S. Estimating misclassification error with small samples via Bootstrap Cross-Validation. Bioinformatics. 2005;21:1979-86.
7. Duda RO, Hart PE, Stork DG. Pattern classification. John Wiley and Sons Inc. 2001, Ch. 9:483-86.
8. Molinaro AM, Simon R, Pfeiffer RM. Prediction Error Estimation: A Comparison of Resampling Methods. Bioinformatics. 2005; 21:3301-07. 9. Varma S, Simon R. Bias in Error Estimation
When Using Cross-Validation for Model Selection. BMC Bioinformatics. 2006;7:91. 10.Chernick, MichaeL R. Bootstrap Methods: A
Guide for Practitioners and Researchers. Wiley Series in Probability and Statistics, 2nd Ed. 2008. 11. Golub TR, Slonim DK, Tamayo P, Huard C, Gaasenbeek M, Mesirov JP, et al. Molecular
Classification of Cancer: Class Discovery and Class Prediction by Gene Expression Monitoring. Science. 1999;286(5439):531-37.
12. Yoo CK, Lee IB, Vanrolleghem PA. Interpreting pattern and analysis of acute leukemia gene expression data by multivariate fuzzy statistical analysis. Comput Chem Engine. 2005;29:1345-56.
13.Dudoit S, Fridlyand J, Speed T. Comparison of discrimination methods for the classification of tumors using gene expression data. J Am Stat Assoc. 2002;97:77-87.
14.Efron B, Tibshirani R. An Introduction to the bootstrap. Chapmam & Hall: London, 1998. 15.Dudoit S, Fridlyand J. Classification in
microarray experiments. Statistical Analysis of Gene Expression Microarray Data. Chapman & Hall: London; (2003) 93-158.
16.Efron B, Tibshirani RJ. Improvement on cross-validation: the 0.632+ bootstrap method. J Am Stat Assoc. 1997;92:548–60.
17.Refaeilzadeh P, Tang L and Liu H. Cross-Validation. In AAAI-07 Workshop on Evaluation Methods in Machine Learning II. Vancouver, Canada.2007;1-6.
18.Ihaka R, Gentleman R. R: a language for data analysis and graphics. J Comput Graph Stat. 1996; 5:299-314.
19.Vu T, Sima C, M Braga-Neto UM and Dougherty ER. Unbiased bootstrap error estimation for linear discriminant analysis. EURASIP J Bioinform Syst Biol. 2014; 2014:15. http://bsb.eurasipjournals.com/content/2014/1/15, 20.Dougherty ER, Sima C, Hua J, Hanczar B and Braga-Neto UM. Performance of Error Estimators for Classification. Curr Bioinform. 2010;5:53-67
21.Huang LT. An integrated method for cancer classification and rule extraction from microarray data. J Biomed Sci. 2009;16:25