Development of Application for Pests and Diseases of Corn Android Based System
Author’s Details:
(1)
Mohamad Lihawa (2)Zulzain Ilahude (3)Salmawaty Tansa
Department Of Agrotechnology Faculty Of Agriculture Universitas Negeri Gorontalo
(1)(2)
Lecturer of the Department of Agrotechnology, Faculty of Agriculture, Gorontalo State University
(3)Lecturer in the Department of Electrical Engineering, Faculty of Engineering, State University of Gorontalo
Received Date: 14-Nov-2019 Accepted Date: 30-Nov-2019 Published Date: 31-Dec-2019 _________________________________________________________________________________________
Abstract
The research objective is to produce an Android-based expert system software that is capable of detecting pests and diseases in corn plants and is useful in providing information about symptoms and its control through image processing. This expert system program is processed through digital signal processing which consists of four (4) main parts, namely preprocessing, color feature extraction, texture feature extraction, and classification. The color feature extraction method used is The Color Moment as color feature extraction and GLCM (Gray-Level CooOccurrence Matrix) as a texture feature extraction. The classification method in this system uses K-Means clustering by dividing images into 4 clusters based on the color and texture of image objects. Training data using Multi SVM (Support Vector Machine) method. The result of this software program is named Corn Expert System (CES) which is installed on the desktop and the Android Cellphone (HP). This CES system application begins with taking pictures of corn leaves that are attacked by pests and diseases using Android phones by farmers in cornfields and sent to the desktop that is operated by the operator at the Agricultural Extension Office. Data from the desktop processing is sent back to the farmer via an android phone. The results of the detection of this CES program for pests, leaf scrapers and rust disease, leaf spot, leaf blight, and froth blight, have an accuracy level of up to 90%.
Keywords: Corn Expert System (CES), Diseases of Corn Plants
_______________________________________________________________________________________
Introduction
Corn as a strategic commodity after the rice has always been cultivated by farmers in Gorontalo. This is also supported by the agropolitan program, as a form of accelerating regional growth and overcoming food crises (Lihawa, et al., 2010; Witjaksono, et al., 2011; Ilahude, Z., 2014). One of the factors that can affect the production of corn is Aphis (aphids), leaf slicer and rust disease, leaf spot, leaf blight and fronds (Semangun, H., 1991; Surtikanti, 2009; Soenartiningsih, et al., 2013; Tenteyali , et al., 2017; Talib, A., et al., 2018; Lihawa, et al., 2018; 2018). To anticipate pest and disease attacks on corn, many efforts have been taken to keep corn production stable, including planting corn varieties that are resistant to pests and diseases, regulating cropping patterns, regulating planting time, introducing natural enemies, be it predators, parasitoids, entomopathogens and antagonistic microorganisms.
Every pest and disease attack on a plant, before reaching a more severe and widespread stage, begins with symptoms of a mild attack and the spread rate is still low. Agriculture experts can have the ability to analyze the symptoms of pests and plant diseases, but to overcome all the problems faced by farmers, agricultural experts are still constrained by time and distance, considering the many farmers who have problems with their crops. Besides the limited information and the lack of available sources of information about pests and diseases in the field and the equipment used to capture the information is still conventional, resulting in late handling of pests and diseases in the field when an explosion of pest populations and the severity of the disease, which causes crop failure.
damage. This pest and disease detection system are named Corn Expert System (CES), which is digital image processing based on desktop and android. The application of the CES program was developed to be able to recognize the symptoms and diseases of corn plants which are expected to replace the role of an expert or extension agent in dealing with pest and disease problems and provide an explanation of the symptoms and solutions for their handling.
How to use the CES program that is, users only take photos of corn leaves that are attacked by pests and diseases through the Android version of the CES program and then send them to the desktop version of CES that can identify pests and diseases using artificial intelligence technology or Artificial Intelligence (AI) through image processing (Qur'ania, A., et al., 2012). Image processing through color feature extraction using the Color Moment method and texture feature extraction using the GLCM (Gray-Level Co-Occurrence Matrix) method (Sanyal, P., et al., 2007; Permata Sari, I., et al., 2016). For pattern recognition using K-Means clustering where images are divided into 4 clusters based on color and texture of image objects and training of image data using the Multi SVM (Support Vector Machine) method. The program produced in the CES system can able to detect the symptoms of pests and diseases using the mobile android phone on time (Syarifudin, A. et al., 2018). So that more speed up decision making action control of Pests and Corn Diseases by farmers or other users.
Method
The CES (Corn Expert System) program is a combination of android and desktop versions of the program. The Android version of the CES program is installed on the cellphone via the website http://deksijagung.000webhostapp.com/index.phpm. Using the waterfall method, the desktop version of the CES program is installed on a computer-based on the Matlab program using an image processing detection system.
a. Waterfall Method
The waterfall method is a sequential software development process, which goes through the planning, modeling, implementation and testing phases. The main data needed is data on the types of pests and diseases, causes and methods of prevention, image / photos of types of diseases and pests on corn plants. These data will be processed and used as a basis for image detection. The stages of the waterfall method are as follows:
- System Requirements Analysis
The analysis phase begins with a description of a preliminary study and data collection of pests and diseases of corn plants in the Gorontalo area. After that, an analysis of the system requirements is required and needed by the user. Data for the analysis were obtained in 3 ways, namely, interviews, observation, and document analysis. Based on the results of the analysis of the current system, the new system proposal is described using a context diagram tool in describing the scope of a new system.
- Design / System Design
This stage will be carried out system design consisting of database design, software architecture, and interface design using UML tools. This stage translates software requirements from the needs analysis stage to the design representation so that it can be implemented into a program at a later stage (Ladjamudin, and Al-Bahra, 2006; Rosa and Saladin, 2011).
- Coding
This stage changes the design of the system into a software program using the concept of OOP (Object Oriented Programming) by using the MVC (Model, View, Controller) software architecture (Naista David, 2016).
- Testing
been tested. This is done to minimize errors (errors) and produce the resulting output as desired. In this study, system testing is carried out using black-box testing. Black-box testing focuses on the functional requirements of the software.
b. Image Processing
Digital image processing (Digital Image Processing) is the use of computer algorithms to perform image processing on digital images (Jayamala, K. et al., 2011). Pre-processing is one of the initial stages in this study, which consists of saturation, grayscaling and thresholding processes. The purpose of this process is that the data used is easy to interpret and analyze. Also, so that the data used is following the application being built so that the results are optimal.
- Color Moment Method
Color Moments is a dense representation of color features in characterizing image colors. Some of the color distribution information is arranged in 3-moment sequences (Permata Sari, I. et al., 2016).
a. Mean :
(1)
where µ is the moment, c is the color component, is the pixel value (i, j) on the color component c, M is
the height of the image, and N is the width of the image.
b. Standard Deviation :
(2)
where
σ
is the standard deviation, c is the color component, is the pixel value (i, j) on the color component c, M is the image height, N is the image width, and c m is the mean value on the color component.c. Skewness :
(3)
where is skewness, c is the color component, is the pixel value (i, j) on the color component c, M is the
height of the image, N is the width of the image, and c m is the mean value on the color component c.
- Gray Level Co-Occurrence Matrix (GLCM)
In the statistical analysis of textures, texture features are calculated based on the distribution of combinations of pixel intensities at specific positions, each combination distinguished by first-order, second-order and higher-order statistics. GLCM is a way to extract second-order statistical texture features. The following is a formula for seeking entropy, contrast, homogeneity, correlation, and energy (Tansa, S., 2010; Permata Sari, I., et al., 2016) :
1. Contrast
(4)
The contrast feature measures the difference in intensity between pixels. Where M is the maximum value for the gray level in the first row, N is the maximum gray level value for the jth column, i = gray level value for the first row, j is the gray level value for the jth column, P (i, j) is opportunity value for gray level in the ith row and jth column.
2. Correlation
(5)
is the mean value of the ith row, is the mean value of the jth column,
is the standard deviation value.
3. Energy
(6)
The energy feature counts the same number of pixel pairs (concentration of pixel intensity pairs). Where M = maximum gray level value of ith row, N = maximum gray level value of jth column, i = gray level value of ith row j = gray level value of jth column, P (i, j) = opportunity gray level values in the i row and jth column.
4. Homogeneity
(7)
The homogeneity feature is the opposite of contrast measuring the homogeneity (similarity) of pixel intensity. Where M = maximum gray level value of ith row, N = maximum gray level value of jth column, i = gray level value of ith row j = gray level value of jth column, P (i, j) = opportunity gray level values in the i row and jth column.
Results and Discussion
Corn Pests and Diseases
Pests and diseases on corn plants that were detected were symptoms of aphis pests, leaf scrapers and rust disease, leaf spot, leaf blight, and midrib blight.
Figure 1. Photograph of disease symptoms in corn plants, a) aphis pest, b) leaf scrapers, c) rust, d) leaf spot, e) leaf blight, and f) frond blight (Research results, Lihawa, M., et al. , 2019)
d
a b
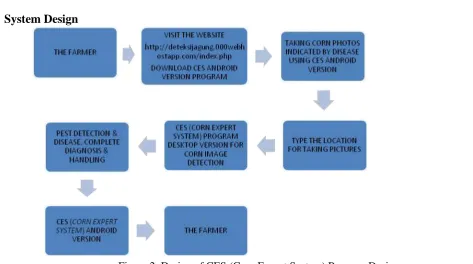
System Design
Figure 2. Design of CES (Corn Expert System) Program Design
At the design stage, there are 2 stages: stage 1, the design of the Android version of the CES program uses a system design consisting of database design, software architecture, and interface design using UML tools, then coding (coding) using the concept of OOP (object-oriented programming) by using the MVC software architecture (Model, View, Controller) (Naista David, 2016).
The design of the desktop version of the CES program uses image processing analysis using the Matlab program by using the Color Moment and Gray Level Co-Occurrence Matrix (GLCM) feature extraction.
Stages of Designing the Android version of the CES (Corn Expert System) Program
- Application architecture
In the development of database applications, this corn plant is used. For appearance, use HTML5 and Bootstrap 3 for mobile responsiveness. This MVC architecture separates data (model), interface view (view) and how to call both using the Controller (Naista David, 2016). When a user requests to the system, routing identifies the controller and what method is used to handle the request. Then the controller calls the appropriate data from the database. Data that has been taken from the database is displayed by the controller to the view to be seen by the user (Kamil, 2017). The architecture of this application can be seen as in Figure 2 below :
Figure 2. Application architecture 5. The View
displays the requested data on the
user page 3. the model
interacts with the database Controller
View Model
1. The user makes a request
2. The Controller requests query to the model
- Database Design
Database design starts with structuring the database based on the entity used and its relationship with other entities. The entity and its relationship are described in an ERD that represents the data model in the system. The tables consist of three tables that have relations with each other. The database in this application is named db_cornexpertsystem.sql, which consists of a user table, a disease table, and a detail_gambar table. For more details, can be seen in Figure 3.
Figure 3. CES (Corn Expert System) database design
- Coding
Web service on this system is made using the PHP programming language Version 5.6.15. The web server uses Apache Version 2.4.17. Web server is used to run the PHP programming language in the browser. For data storage, MySQL Database Version 5.0 is used. Web applications that are built can be accessed by users using a web browser. The URL address can be accessed by entering the address http://deksijagung.000webhostapp.com. This page is used as a web service for sending disease data on android applications. In addition to the android application can be downloaded on this website as well. Furthermore, to be able to run the Corn Expert System (CES) android application which is the first time you have to register on the application (Figure 4).
Figure 4. List of Users
Figure 5. Success Login
If there is an image or image that we want to process, then click the + (ADD) menu to take pictures directly from the camera or from the HP gallery. After that, enter the complete address in the form (Figure 6).
Figure 6. Add Image Location Data
Then just waiting for the process of image detection by the desktop version of the CES (Corn Expert System) program application for analysis of diseases in corn plants using the image processing method of Artificial Intelligence (AI). Then click the picture menu that has been sent previously to see the disease, its causes and how to overcome it (Figure 7).
Figure 7. Image Detection Results Testing System
At this stage, testing is done on the Android and desktop versions of the CES (Corn Expert System) program application.
1.Testing the Desktop Version of the CES Program
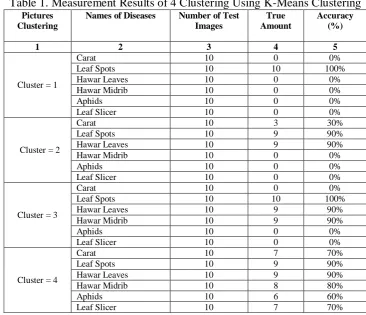
The system testing process is also carried out by changing the k value parameter with the K Means Clustering method used in the classification process. For each training, image testing is done for clusters 1, 2, 3 and 4. For image training, 10 image data are used for each disease.
Table 1. Measurement Results of 4 Clustering Using K-Means Clustering Pictures
Clustering
Names of Diseases Number of Test
Images
True Amount
Accuracy (%)
1 2 3 4 5
Cluster = 1
Carat 10 0 0%
Leaf Spots 10 10 100%
Hawar Leaves 10 0 0%
Hawar Midrib 10 0 0%
Aphids 10 0 0%
Leaf Slicer 10 0 0%
Cluster = 2
Carat 10 3 30%
Leaf Spots 10 9 90%
Hawar Leaves 10 9 90%
Hawar Midrib 10 0 0%
Aphids 10 0 0%
Leaf Slicer 10 0 0%
Cluster = 3
Carat 10 0 0%
Leaf Spots 10 10 100%
Hawar Leaves 10 9 90%
Hawar Midrib 10 9 90%
Aphids 10 0 0%
Leaf Slicer 10 0 0%
Cluster = 4
Carat 10 7 70%
Leaf Spots 10 9 90%
Hawar Leaves 10 9 90%
Hawar Midrib 10 8 80%
Aphids 10 6 60%
Leaf Slicer 10 7 70%
(a) (b)
(c ) (d)
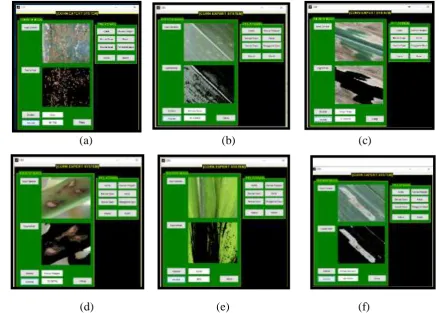
Figure 8. Testing 4 image clustering a) cluster 1, b) cluster 2, c) cluster 3, and d) cluster 4
(a) (b) (c)
(d) (e) (f)
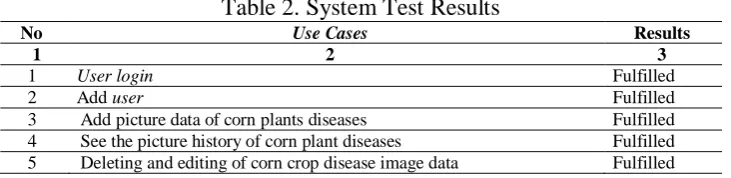
2. Testing the Android Version of the CES Program
Android version testing is done by using the black box testing method, which is a testing method that focuses on checking the availability of functionalities that have been designed on the application. Table 2 shows the results of functional testing. All functionalities that have been defined at the analysis stage are tested using the same method. The test results show the system has been made under the requirements specified at the analysis stage.
Table 2. System Test Results
No Use Cases Results
1 2 3
1 User login Fulfilled
2 Add user Fulfilled
3 Add picture data of corn plants diseases Fulfilled
4 See the picture history of corn plant diseases Fulfilled
5 Deleting and editing of corn crop disease image data Fulfilled Conclusions
a. The CES (Corn Expert System) application program is a unity of the android and desktop versions that can detect pests, leaf scrapers and rust disease, leaf spot, leaf blight and fronds blight on corn plants.
b. The Android version of the CES (Corn Expert System) program was built as a medium to be forwarded to the desktop version of the CES (Corn Expert System) program to detect pests and diseases through image processing.
Suggestion
To develop this application, a chatbox method can be added so that it can communicate with users.
References
i. Ilahude, Z., 2014. Spatial Study on Corn Agropolitan Development in Pohuwato Regency, Gorontalo Province. Dissertation of the Postgraduate Program in the Faculty of Geography, Gadjah Mada University, Yogyakarta. 353 pages.
ii. Jayamala, K., Patil, and R. Kumar. 2011. Advances in Image Processing for Detection of Plant Diseases. Journal of Advanced Bioformatcs Application and Research. Vol.2 No. 2: 135-141pp.
iii. Kamil, Husnil, 2017. "Design and Build of Information Systems for the realization of web and mobile-based activities in the West Sumatra Province Dishubkominfo," Teknosi Vol 03, No.01, April 2017.
iv. Kiran, R., MS., Gavhale, and Prof. Ujwalla Gawande, 2014. An Overview of the Research on Plant Leaves Disease detection using Image Processing Techniques. IOSR Journal of Computer Engineering (IOSR-JCE). e-ISSN: 2278-0661, p- ISSN: 2278-8727. Volume 16, Issue 1, Ver. V (Jan. 2014), 10-16pp.
v. Ladjamuddin. B, Al-Bahra, Software Engineering, 2nd edition. Yogyakarta, Indonesia: Graha Ilmu, 2006, p.170
vi. Lihawa, M., Witjaksono., N. S. Putra. 2010. Survey of Corn Stem Borer And Its Natural Enemy Complex In Gorontalo Province. Indonesian Plant Protection Journal. Vol. 16, No. 2: 82-87.
vii. Lihawa, M., Tupamahu, F., Ilahude, Z., Tayeb, R., 2018. Early Detection of Pests and Diseases of Corn Plants (Agricultural Technology Perspective). Ideas Publishing Publisher, October 2018. Gorontalo Email: [email protected] IKAPI member, No. 0001 / IKAPI / Gorontalo / II / 17. 139 pages.
viii. ---., 2018. Blueprint of Early Detection System for Pests and Corn Disease (Desktop Version. Ideas Publishing Publisher, October 2018. Gorontalo E-mail: [email protected] IKAPI member, No. 0001 / ikapi / gtlo / II / 17. 65 Pg.
ix. Naista, David, 2016. Create your own PHP Framework with OOP and MVC techniques, Jakarta, Indonesia: Lokomedia, 2016.
National Seminar on Innovation and Application of Technology in Industry (Seniati) 2016. 215-220pp. xi. Rosa, U.S., and Saladin, M, 2011. Software Engineering Learning Module (Structured and
Object-Oriented), Bandung: Modula, 2011.
xii. Salmawaty Tansa, 2010. Detection of Brain Tumors and Hemorrhagic Stroke in Ct Scan Imagery with Texture AnalysisGray Level Co-Occurrence Matrix (GLCM). Thesis Postgraduate Program Faculty of Engineering, Gadjah Mada University, Yogyakarta. 96 things.
xiii. Sanyal, P., U.Bhattacharya, S.K .Update, S.K.Bandyopadhyay, S.Patel. 2007. Color Texture Analysis of Rice Leaves to Diagnose Deficiency in the Balance of Mineral Level Towards Improvement of Crop Productivity. 10th International Conference on Information Technology. 85-90pp.
xiv. Syarifudin A, Nurul Hidayat, and Lutfi Fanani, 2018. Expert System for Diagnosis of Corn Diseases Using Android-Based Naive Bayes Method. Journal of Information Technology and Computer Science Development. Vol. 2, No. 7. 2738-2744pp.
xv. Semangun, H. 1991. Food Crop Diseases in Indonesia. Gajah Mada University. 449 pages.
xvi. Soenartiningsih, Fatmawati and A.M. Adnan 2013. Identification of Some Major Diseases in Sorghum and Corn Plants in Central Sulawesi. Proceedings of the National Cereals Seminar, Maros Cereals Research Institute.
xvii. Surtikanti, 2009. Disease of Hawar Leaves Helminthosporium sp. On Corn Crops in South Sulawesi and Its Control. Proceedings of the National Seminar on Cereals. Cereals Research Center. xviii. Talib, A, Hendra, Rida Iswati, Mohamad Lihawa, 2018. Loss of Yield Disease in Corn (Zea mays
L.) in Tolite Jaya Village, Tolinggula District, North Gorontalo Regency. Journal of Agrotechnotropics, Vol. 7, No. 3. 374-383pp.
xix. Tenteyali, M.S., Rida Iswati, Mohamad Lihawa, 2017. Types of Disease and Potential Loss of Yield in Corn Plants Due to Disease In Trirukun Village, Wonosari District, Boalemo Regency. Journal of Agrotechnotropics, Vol. 6, No. 3. 307-314pp.
xx. Qur'ania A., Lita Karlitasar, Sufiatul Maryana, 2012. Texture Analysis and Color Feature Extraction for Image-Based Apple Classification. Computing Workshop in Nuclear Science and Technology, 10 October 2012. 296-304pp.