Mathematical models for optimization of group work in harvesting operation
9
0
0
Full text
(2) @. ZE^I] and J. MAREN^E. Mathematical models for optimization of group work in harvesting (29–37). unit is 17.28 m/ha. On-site investigations were carried out in the compartments 55 and 56 at an altitude ranging between 550 m and 750 m. Air temperatures have a considerable impact on the workers activity. During the on-site research, morning and daily temperatures were recorded and an average air temperature of 16 oC was calculated. The soil was wet on average. Longitudinal slope of skid trail was 14 % on average. Relative air moisture was mainly high – 81 % on average. There are 892 trees per hectare. The volume of an average stand tree is 0.502 m3. The growing stock is 216 m3/ha, and the annual cut is 40 m3/ha. Utilization depends on the method of felling and processing. Out of the total (gross) volume, 92.0 % of wood assortments were processed. The average distance of the marked trees is 10.1 m. Tractors move partly on strip roads and partly off-road to get to the cut trees. On-site investigations were carried out by use of work and time studies, i.e. by use of snap-back chronometry method recommended by REFA (1976). Checklists were adapted to the work organization of cutters, tractors and cutters-inspectors. The recorded times were analysed according to teamwork time distribution used by the Forest Harvesting Institute of the Faculty of Forestry Zagreb. Individual analysis was conducted of recorded times for each member of the team, i.e. for the means of work. Fix and variable times were analysed separately. Effective time in tree felling and processing was analysed by multiple regression analysis, taking into consideration the dependence of effective time consumption in relation to the breast-height diameter and the height. In timber skidding, part of effective time is analysed as fix time, and part of it as variable time. Fix times do not depend on skidding distance or distance of pulling the chocker or winching, and in this event they refer to the effective time of the felling site work (loading) and roadside landing work (unloading). Arithmetic mean, dispersion rate, percentage error of the arithmetic mean and number of required records were calculated for fix times. Variable times were processed by multiple regression analyses using the software package – Statistica 6. Four variables were taken into consideration for the calculation of the loaded tractor travel: skidding distance, load volume, number of load pieces and road slope. The travel distance and road slope were taken into account for calculating the time of unloaded tractor travel. Multiple regression analysis was also used for determining the time consumed by the cutter-in-. 30. spector in final processing, measuring and inspecting at the roadside landing. Attention was focused on the dependence of effective time consumption on the processed volume and number of pieces. In the process of wood felling, processing and skidding performed by teamwork, time distribution differs from the standard ones because the cutter is also present in specific operations and at specific places (felling site, skidding trail and roadside landing). Effective time of felling and processing is divided into tree time and assortment time. The time consumed by the cutter for load hooking, is analysed as part of the tractor’s effective time consumed working at the felling site. The effective time of the tractor cycle is divided into fix and variable times. Delay times involve the times of all breaks, production delays and preparation time. After filling in the data of all team members into the PC (database), statistical analysis of data was carried out by use of software packages Microsoft Excel and Statistica 6. The required statistical values were calculated for each operation, depending on the type of time. Variabile times were processed by the software package Statistika 6. The so-called descriptive statistics was used for the description of the basic characteristics of the researched group of data (survey of data regarding the structure at a specific workplace, and work times of machines and men); mean values of variables were expressed by arithmetic means, and their variability by range, variance and standard error. On the basis of the measured data (d – breastheight diameter, h – tree height), the total volume of felled trees was calculated, Shummacher – Hall – by use of this equation: V = b 0 × d b 1 × h b 2 × fK (m3), where: V – is the tree volume (m3), bo, b1, b2 – are the parameters of the equation, f – is Mayer’s correction factor. The processed volume of each tree, i.e. of wood assortments, was calculated by use of Huber’s formula: V = d 2 × p 4000 × l, (m3), where: V – is the. [(. ). ]. volume of wood assortment (m3), d – is the mean diameter (cm), l – is the length of assortment (m).. 3. Teamwork characteristics – Zna~ajke skupnoga rada A work team is a synchronized group of workers formed so as to carry out a work order as an independent unit with the necessary means of work. The Croatian Journal of Forest Engineering 26(2005)1.
(3) Mathematical models for optimization of group work in harvesting (29–37). @. ZE^I] and J. MAREN^E. Figure 1 Cutter and tractor driver’s work related to load hooking Slika 1. Sjeka~ i traktorista pri vezanju tovara. for 42.93 % of total time consumption, and delay times for 57.07 %. The effective time of the cutter S2 is 35.95 %, and delay time 64.05 %. The cutter S1 requires 986.71 minutes or 1.59 minute per tree, i.e. 43.17 % of effective time for preparing the load, and the cutter S2 681.89 minutes or 1.35 minute per tree, i.e. 35.72 % of effective time. For felling and processing 165.39 m3 of wood, the cutter S1 consumed 13.82 min/m3 of effective time, 18.38 min/m3 of delay times or in total 32.21 min/m3. For felling and processing 140.76 m3 of wood, the cutter S2 consumed 13.56 min/m3 of effective time, 24.16 min/m3 of delay times or in total 37.72 min/m3. Records of the tractor E were being taken for 6,295.08 minutes, and of the tractor T for 6,008.75 minutes. The effective time of the tractor E is 51.46 %, and of the tractor T 59.00 %, being therefore higher by 7.54 %. Delay times are 48.54.% and 41.00%, respectively. The effective time of the tractor E per unit is 21.64 min/m3, and of the tractor T 20.67 min/m3, which is by 4.5 % lower than the tractor E. Total time consumption per unit of the tractor E is 42.05 min/m3, and of the tractor T 35.04 minutes and hence by 7.01 min/m3 lower. The average daily efficiency of the tractor E is 9.98 m3/day, and of the tractor T it is 11.43 m3/day. The tractor T skidded on average 1.45 m3/ day more than the tractor E, which is by 12.7 % more.. In teamwork, more than a few workers take part in carrying out the work order. Work technology is adapted to the factors of the workplace. The workers distribute evenly their efficiency and their income subject to days spent at work in the accounting period. Joint responsibility is established in the team for meeting the requirements specified in the work order. All members of the team go to work together and they also go back to their place of residence together. In the team with two cutters, costs for fuels and lubricants are evenly distributed in accordance with the achieved efficiency. Tractor fuel and lubricants are distributed in the same way. Each team has a leader whose presence is required at the workplace every day. The team efficiency is measured by the volume of daily efficiency of two tractors.. Figure 2 Cutter engaged in felling and processing Slika 2. Sjeka~ pri sje~i i izradbi stabla. task of the work team is to achieve better connection and performance of all operations, starting with the preparation work and ending with the delivery of the forest assortments to the buyer. The basic characteristics of teamwork is a single work order determined on the basis of individual daily standard efficiencies of each member of the team. The daily standard efficiency is calculated and showed averagely per member of the team. The workers carry out the work at the same workplace with the same means and object of work (Fig. 1).. 4. Teamwork factors – ^imbenici skupnoga rada 4.1 Time analysis – Analiza vremena Records were being made of the cutter S1 for 5,324.70 minutes, and of the cutter S2 for 5,309.67 minutes. The effective time of the cutter S1 accounts Croatian Journal of Forest Engineering 26(2005)1. During 13 days, the cutter-inspector consumed a total of 4,521.55 minutes, i.e. 347.81 min/day on average for final processing and inspecting. The effective time accounts for 20.69 % and delay times for 79.31 % of total time. The effective time for 2,012 pieces, i.e. 273.19 m3 of inspected wood assortments, is 3.43 min/m3, delay times 13.13 min/m3 and the total time 16.55 min/m3 on average.. 31.
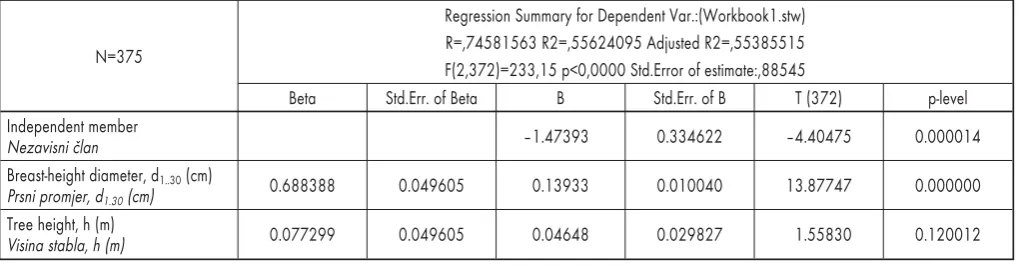
(4) @. ZE^I] and J. MAREN^E. Mathematical models for optimization of group work in harvesting (29–37). 4.1.1 Allowance time – Dodatno vrijeme Allowance time is made of parts of delay times necessary for executing the work order. Allowance time is determined in order to establish standard times and standard efficiencies, and it is added to the effective time in the form of the allowance time coefficient or in the form of an absolute value. Allowance time is modelled by the analysis of work delays. Allowance time factor of the cutter S1 is 1.55, of the cutter S2 it is 1.70, of the tractor E it is 1.29, of the tractor T 1.24, and of the cutter-inspector (CI), engaged in inspecting wood assortments at the landing, it is 1.67. High percentage of allowance time is the effect of low consumption of effective time, i.e. insufficient utilization of prescribed work time of 480 minutes. The team worked at the workplace 78.37 % of the prescribed work time.. 4.2 Effective time of cutters engaged in felling and processing of wood – Efektivno vrijeme sjeka~a pri sje~i i izradbi stabala Statistical analysis was carried out on the basis of total time records related to the cutter S1. The effec-. tive time of felling and processing was sorted out and its variability was investigated. Multiple linear regression was applied, and the values of breast-height diameter, tree height and the pertaining effective time were taken as independent variables for each tree. Based on distribution of the number of trees and value of the descriptive statistics, the software package selected the most favourable form for calculating mathematically the effective time of felling and processing performed by the cutter S1. Table 2 shows the indicators of regression and the parameters of the regression equation of effective time of the cutter S1. The calculated effective time of the cutters S1 and S2; The equation: YS1 = –1.47393 + 0.13933 × 20.5 + 0.04648 × 15.0 = = 2.08 (min), R = 0.74581563 (1) YS2 = –0.603243 + 0.132254 × 20.2 + 0.004016 × 15.2 = = 2.13 (min), R = 0.73573390 (2), of effective time per tree.. Table 1 Descriptive statistics of basic distributions: breast-height diameter, tree height and effective time of felling and processing, cutter S1 Tablica 1. Opisna statistika temeljnih raspodjela: prsnog promjera, visine stabla te efektivnog vremena sje~e i izradbe, sjeka~ S1 Variables Varijable Breast-height diametar, d1.30 (cm) Prsni promjer, d1.30 (cm) Tree height, h (m) Visina stabla, h (m) Effective time, (min) Efektivno vrijeme, (min). N. of trees, N Broj stabala,. Descriptive Statistics (Spreadsheet2 in Workbook1.stw) Opisna statistika Mean value Minimum Maximum Srednja vrijednost Minimum Maksimum. Std. dev. Standardna devijacija. 375. 20.533. 9.000. 42.000. 6.549. 375. 14.978. 9.000. 20.000. 2.204. 375. 2.083. 0.240. 7.900. 1.325. Table 2 Indicators of regression and parameters of regression equation of effective time of the cutter S1 Tablica 2. Pokazatelji regresije i parametri regresijske jednad`be efektivnog vremena sjeka~a S1. N=375 Beta Independent member Nezavisni ~lan Breast-height diameter, d1..30 (cm) Prsni promjer, d1.30 (cm) Tree height, h (m) Visina stabla, h (m). 32. Regression Summary for Dependent Var.:(Workbook1.stw) R=,74581563 R2=,55624095 Adjusted R2=,55385515 F(2,372)=233,15 p<0,0000 Std.Error of estimate:,88545 Std.Err. of Beta B Std.Err. of B T (372). p-level. –1.47393. 0.334622. –4.40475. 0.000014. 0.688388. 0.049605. 0.13933. 0.010040. 13.87747. 0.000000. 0.077299. 0.049605. 0.04648. 0.029827. 1.55830. 0.120012. Croatian Journal of Forest Engineering 26(2005)1.
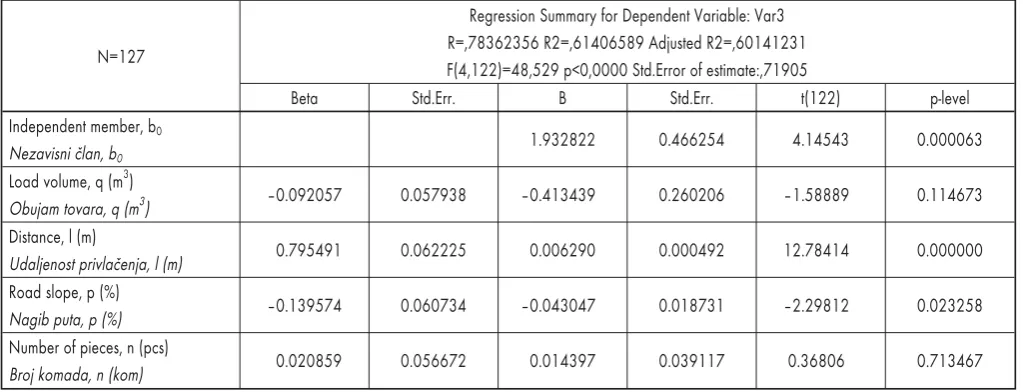
(5) Mathematical models for optimization of group work in harvesting (29–37). 4.3 Effective time of tractor cycle – Efektivno vrijeme turnusa traktora Tractor cycle is made of four cyclic operations. Two of these working operations are considered as variable time and two as fix time. The times of loaded and unloaded tractor travel belong to variable times, while the felling site tractor work and the roadside landing tractor work belong to the second group. Fix time accounts for 19.11 min/cycle (E) and 19.65 min/cycle (T), respectively. Due to a large number of data and results, this paper will only show as an example the method of calculating the time of loaded Ecotrac (E) tractor travel and for all other variable times only the calculation equation will be showed. Travel time of loaded tractors on skid trail and felling site Based on distribution of the load volume, skidding distance, road slope and number of load pieces as well as on the values of the descriptive statistics, the software package selected the most favourable form for the mathematical calculation of travel time of the loaded Ecotrac tractor (E) on skid trail and felling site. Table 3 shows the values of multiple regression used for obtaining the equation for calculating time consumption (yO-E) of the loaded tractor E on skid trail and felling site, which is as follows: YO-E = 1.932822 – 0.413439 × q + 0.006290 × l – – 0.043047 × p + 0.014397 × n. (3). @. ZE^I] and J. MAREN^E. For the researched sample of records, where the average load volume q = 1.124 m3, the average skidding distance l = 212.3 m, the average terrain slope p = 14.4 % and the average number of load pieces n = 7.6, the time of the loaded tractor E is 2.291 minutes. Mathematical form for calculating time consumption (yO-T) of the loaded Torpedo tractor (T) on skid trail and felling site is as follows: YO-T = 0.0874076 – 0.174104 × q + 0.007700 × l – – 0.021937 × p + 0.101793 × n. (4),. where the average load volume q = 1.211 m3, the mean skidding distance l = 215.3 m, the average terrain slope p = 15.9 % and the average number of load pieces n = 8.2, and the time of the loaded tractor T is 2.81 minutes. The coefficient of the multiple correlation is R = 0.80131674. Travel time of unloaded tractors on skid trail and felling site The equation for the calculation of travel time of unloaded Ecotrac tractor (E) on skid trail and felling site is as follows: YN-E = 1.001102 + 0.07935 × l – 0.037377 × p. (5). In the researched sample of records, the mean skidding l = 213.7 m and the average road slope p = 14.5 %. Travel time of unloaded tractor E was calculated by use of the above equation No. 5 and it is namely 2.156 minutes. The coefficient of the multiple correlation R = 0.91443280 shows complete correlation.. Table 3 Indicators of regression and parameters of the regression equation of time of loaded Ecotrac tractor (E) on skid trail and felling site Tablica 3. Pokazatelji regresije i parametri regresijske jednad`be vremena vo`nje optere}enog traktora Ecotrac (E) po vlaci i sje~ini. N=127 Beta Independent member, b0 Nezavisni ~lan, b0 Load volume, q (m3) Obujam tovara, q (m3) Distance, l (m) Udaljenost privla~enja, l (m) Road slope, p (%) Nagib puta, p (%) Number of pieces, n (pcs) Broj komada, n (kom). Regression Summary for Dependent Variable: Var3 R=,78362356 R2=,61406589 Adjusted R2=,60141231 F(4,122)=48,529 p<0,0000 Std.Error of estimate:,71905 Std.Err. B Std.Err. t(122). p-level. 1.932822. 0.466254. 4.14543. 0.000063. –0.092057. 0.057938. –0.413439. 0.260206. –1.58889. 0.114673. 0.795491. 0.062225. 0.006290. 0.000492. 12.78414. 0.000000. –0.139574. 0.060734. –0.043047. 0.018731. –2.29812. 0.023258. 0.020859. 0.056672. 0.014397. 0.039117. 0.36806. 0.713467. Croatian Journal of Forest Engineering 26(2005)1. 33.
(6) @. ZE^I] and J. MAREN^E. Mathematical models for optimization of group work in harvesting (29–37). The equation for calculating time consumption of the unloaded Torpedo tractor (T) on skid trail and felling site is as follows:. The mathematical form for the calculation of time consumption of the unloaded tractor Tn at roadside landing is as follows:. YN-T = 0.726786 + 0.008099 × l – 0.010348 × p. YTn = 0.198731 + 0.005417 × l. (6). For the researched sample of records, the mean skidding distance l = 216.8 m and the average terrain slope p = 15.9 %. Travel time of the unloaded tractor T was calculated by inserting the mean skidding distance and the average terrain slope in the equation No. 6 and it is 2.32 minutes. The coefficient of the multiple correlation is R = 0.89206835 and it shows very strong correlation. Times of loaded tractors at roadside landing Travel time of loaded tractor on the roadside landing was observed in dependence on the load volume, skidding distance and number of load pieces. Skidding was carried out on macadam road. The mathematical form for calculating time consumption of the loaded tractor Eo at roadside landing is as follows: YEo = 1.145363 – 0.014330 × q + 0.009319 × l – – 0.003870 × n (7) With the average load volume q = 1.117 m3, the mean skidding distance and the average number of load pieces n = 7.6 in accordance with the equation 7, the time of the loaded tractor Eo is 0.417 minutes. The equation for calculating time consumption of the loaded Torpedo tractor (To) on the roadside landing is as follows: YTo = 0.253301 + 0.054996 × q + 0.008769 × l – – 0.004396 × n (8) With the average load volume q = 1.195 m3, the mean skidding distance l = 44.4 m and the average number of pieces in the tractor load, n = 8.0, the travel time of the loaded tractor To on the roadside landing is 0.673 minutes. Times of unloaded tractors at roadside landing Travel times of unloaded tractors were only investigated with a single independent variable and namely with the travel distance. The general form of the equation is as follows: YEn = 0.06336 + 0.006298 × l. (9). Travel time of the unloaded tractor En at roadside landing was calculated for the average travel distance l = 25.3 m, by use of the equation 9 and it is 0.265 minutes.. 34. (10).. Travel time of unloaded tractor Tn of 0.440 minutes was calculated by inserting the mean travel distance, l = 44.5 m in the equation 10.. 4.4 Standard time of the group – Norma vremena skupine Standard time of the group is calculated as the sum of individual standard times of each member of the group, i.e. cutter and tractor working together as well cutter-inspector engaged in inspecting wood assortments. Standard time of a group of workers per product unit is expressed by the mathematical pattern: NVSK = NVS + NVt + NVpS ¼ (min/m3) (11), where NVSK – is the standard time of the team, NVS – is the standard time of the cutter, NVt – is the standard time of the tractor, NVpS – is the standard time of the cutter-inspector. If all parameters from the mathematical patterns for each member of the group are inserted in the mathematical pattern 11, then the following pattern is obtained: æ ç =ç ç è. NVSK æ ç +ç ç è +. 2. 1. (( b. 0. (( t. nv. ((b. 0. ). + b1 × d1,30 + b2 × h) + I f × k ds ö÷ ÷+ qn ÷ ø. ). + tov + tnps + tops ) + (tu + ti ) × k dt ö÷ ÷+ qn ÷ ø. ). + b1 × n1 + b2 × q1 ) × k dps K(min /m 3 ). (11a). where: b0, b1, b2 – are the parameters of the linear mathematical regression model (1 and 2 the pertaining parameter of the mathematical model is used for each member of the team), d1,30 – is the breast-height diameter of the tree (cm), h – is the tree height (m), If – is the time consumed by cutter for load hooking (min), kds – is the cutter’s allowance time factor, qn – is the net tree volume (m3), tnv – is the travel time of the unloaded tractor on skid trail and felling site (min), tov – is the travel time of the loaded tractor on skid trail and felling site (min), tnps – is the travel time of unloaded tractor at roadside landing (min), tops – is the travel time of loaded tractor at roadside landing (min), tu – is the tractor work time at felling site (min), ti – is the tractor work time at roadside landing (min), kdt – is the allowance time factor of the Croatian Journal of Forest Engineering 26(2005)1.
(7) Mathematical models for optimization of group work in harvesting (29–37). @. ZE^I] and J. MAREN^E. Table 4 Optimum team size in view of minimum standard time Tablica 4. Optimalna veli~ina skupine s obzirom na najmanju normu vremena Skidding distance, m Udaljenost privla~enja, m. Cutter Sjeka~. Tractor Traktor. Cutter-inspector Sjeka~-pruzima~. Cutter Sjeka~. Standard time, min/m3 Norma vremena, min/m3. Tractor Traktor. Cutter-inspector Sjeka~-pruzima~. Number of team members Broj ~lanova skupine. Optimum team size Optimalna veli~ina skupine Number of workers Broj radnika. 150. 25.92. 25.06. 4.93. 5.25. 5.08. 1.00. 11.33. 250. 25.92. 26.69. 4.93. 5.25. 5.41. 1.00. 11.66. 350. 25.92. 28.32. 4.93. 5.25. 5.74. 1.00. 11.99. 450. 25.92. 29.95. 4.93. 5.25. 6.07. 1.00. 12.32. 550. 25.92. 31.58. 4.93. 5.25. 6.40. 1.00. 12.65. 650. 25.92. 33.20. 4.93. 5.25. 6.73. 1.00. 12.98. tractor, qt – is the average load volume of the tractor (m3), n1 – is the average number of pieces in a working operation of the cutter-inspector engaged in inspecting wood assortments (pcs), q1 – is the average wood volume in a working operation of the cutter-inspector engaged in inspecting wood assortments (m3), kdps – is the allowance time factor of the cutter-inspector engaged in inspecting wood assortments.. ters and 5.08 (150 m) to 6.73 (650 m) tractors are required for achieving optimum work effects of the team. The optimum team size changes depending on the tractor skidding distance and it ranges between 11.33 members (150 m) and 12.98 members (Table 4). The team organized in this way can produce 97.29 m3/day of wood assortments.. Optimum size of the work team is calculated based on the minimum standard time of an individual member and it is taken as the basic unit. The average standard time of the cutter, tractor and cutter-inspector is calculated in the team. The average standard time for two cutters is 25.92 min/m3, and the average standard time for two tractors ranges between 25.06 min/m3 (150 m) and 33.20 min/m3 (650 m).. The team daily efficiency is calculated as the sum of daily efficiency of two tractors in accordance with the skidding distance. The daily efficiency of each tractor is calculated as the ratio between the prescribed work time of 480 minutes and standard time of the tractor. The work team achieves the daily efficiency proportionally to the volume of wood skidded to the roadside landing. The efficiency ranging between 38.39 m3/day (150 m) and 28.95 m3/day (650 m) (Table 5) can be achieved by a team where skidding is performed by two tractors.. 4.5 Team daily efficiency – Dnevni u~inak skupine. Standard time of the cutter-inspector is 4.93 min/ m3 and it is taken as the basic unit. If there is a cutter-inspector at the roadside landing, then 5.25 cut-. Table 5 Daily efficiency (m3/day) of the team and by member Tablica 5. Dnevni u~inak (m3/dan) skupine radnika i prosje~no po ~lanu Tractor skidding distance. m Udaljenost privla~enja traktorom, m Team tractors Traktori skupine. 150. 250. 350. 450. 550. 650. 30.44. 28.95. 6.09. 5.79. 3. Team daily efficiency. m /day 3 Dnevni u~inak skupine, m /dan E+T. 38.39. 36.04. 32.10 3. Daily efficiency per team member. m /day 3 Dnevni u~inak po ~lanu skupine, m /dan. Number of team members Broj ~lanova skupine 5. 33.96. 7.68. 7.21. Croatian Journal of Forest Engineering 26(2005)1. 6.79. 6.42. 35.
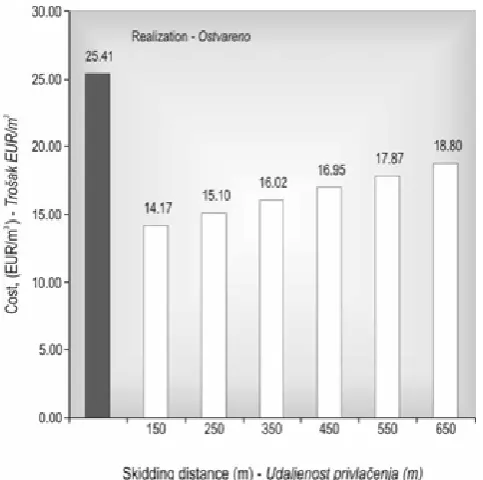
(8) @. ZE^I] and J. MAREN^E. Mathematical models for optimization of group work in harvesting (29–37). 4.6 Calculations and costs of teamwork – Kalkulacije i tro{kovi rada skupina The calculation for a cutter engaged in felling, processing and inspecting wood assortments was made based on 180 working hours per year. Total costs of the cutter with chain saw are EUR 73.35 per day. For an adapted farming tractor – Torpedo TD 75 A, total costs of the machine, driver and hooker are EUR 154.16 per day. Total costs of the Ecotrac V 1033 skidder are EUR 169.89 per day. Daily costs of the team are EUR 544.10 per day or an average of EUR 108.82 a day per member. The average achieved daily efficiency per team member is 4.28 m3/day. Figure 3 shows the ratio between the realized and modelled costs per product unit. The costs of wood production get higher with the increase of skidding distance. The costs range between EUR 14.17 per m3 (150 m) and EUR 18.80 per m3 (650 m), and in relation to the realized costs of EUR 25.41 per m3 it is lower by 44.2 % (150 m) to 26.0 % (650 m).. dard time (of the cutter-inspector) has been taken as the basic unit and the number of other members of the team has been determined on its basis. The average standard time for two cutters is 25.92 min/m3, and the average standard time for two tractors ranges between 25.06 min/m3 (150 m) and 33.20 min/m3 (650 m). Standard time of the cutter-inspector is 4.93 min/m3 and it has been taken as the basic unit. If there is a cutter-inspector at the roadside landing, then 5.25 cutters and 5.08 (150 m) to 6.73 (650 m) tractors are required for achieving optimum work effects of the team. The optimum team size changes in accordance with the tractor skidding distance and it ranges between 11.33 members (150 m) and 12.98 members. The team organized in this way can produce 97.29 m3/day of wood assortments. Daily efficiency per team member decreases with the increase of the skidding distance and it ranges between 7.68 m3/day (150 m) and 5.79 m3/day (650 m) and consequently it is by 79.3 % (150 m) to 35.2 % (650 m) higher than the achieved daily efficiency of 4.28 m3/day. On the basis of the modelled team daily efficiency, the costs range between EUR 14.17 per m3 (150 m) and EUR 18.80 per m3 (650 m), and hence they are by 44.2 % (150 m) to 26.0 % (650 m) lower than the realized costs of EUR 25.41 per m3. Teamwork is a higher form of work organization. It has been accepted by the Croatian forestry and it brought encouraging progress compared to individual work. The researched factors are a good ground for developing dynamic optimisation of the workers team and based on them better utilization of work time, machines and human resources can be achieved as well as higher productivity at lower production costs.. 6. References – Literatura Conway, S., 1986: Logging practices, Principles of timber harvesting systems. Miller Freeman Publications, 1–432.. Figure 3 Calculated costs per product unit (EUR/m3) in accordance with the achieved and modelled daily efficiency of the team Slika 3. Prikaz izra~unanog tro{ka po jedinici proizvoda (EUR/m3) prema ostvarenom i oblikovanom dnevnom u~inku skupine radnika. 5. Conclusions – Zaklju~ci This paper shows the characteristics and factors as well as the efficiency of a work team. On the basis of the standard time, dynamic models have been established of group. In this case, the minimum stan-. 36. Krpan A., Ze~i} @., [u{njar M., 2000: Productivity and costs of group work for harvesting mountainous broadleaf thinning stands (Proizvodnost i tro{kovi skupnoga rada pri eksploataciji brdskih bjelogori~nih prorednih sastojina) IUFRO World Simposium,. Kuala Lumpur, Malaesya. Krpan, A.P.B., 1992: Analiza ~imbenika daljinskog transporta drva kamionima. Disertacija, [umarski fakultet Sveu~ili{ta u Zagrebu, 1– 264. REFA, 1984: Methodenlehre des arbeitsstudiums. Teil 1 Grundlagen, 7. überarb. Aufl. C. Hanser München, 1–107. Winkler, I., 1990: Skupinsko delo v gozdni proizvodnji (Group Work in Wood production). Zbornik gozdarstva in lesarstva, Ljubljana, 35, 69–82. Croatian Journal of Forest Engineering 26(2005)1.
(9) Mathematical models for optimization of group work in harvesting (29–37). Ze~i} @., 2002: Proizvodnost i tro{kovi traktora u brdskim proredama (Productivity and costs of tractor in thinnings on hilly terrain) Zagreb. Znanstvena knjiga: Znanost u potrajnom gospodarenju hrvatskim {umama, 507 – 523. [umarski fakultet Sveu~ili{ta u Zagrebu. Ze~i}, @., Por{insky, T., [u{njar, M., 1999: Time study in the exploitation of mountainous thinnings by group labor (Studij vremena pri eksploataciji brdskih prorednih sastojina skupnim radom). Procedings of IUFRO symposium. @. ZE^I] and J. MAREN^E. »Emerging harvesting issues in technology transition« Opatija, 115–117. Ze~i}, @., 2003: Optimizacija skupnoga rada pri eksploataciji bjelogori~nih prorednih sastojina panonskog gorja (Optimization of group work in harvesting broadleaf thinning stands of the Pannonian mountains). Disertacija. [umarski fakultet Sveu~ili{ta u Zagrebu, 1–313. Ze~i} @., Krpan A., 2004: Efficiency of group work in harvesting mountainous broadleaf thinning stands. Zbornik gozdarstva in lesarstva 74, pp. 41 – 57. Ljubljana.. Sa`etak. Matemati~ki modeli optimizacije skupine radnika pri pridobivanju drva U radu je prou~avana proizvodnost jedne skupine koju ~ini pet radnika (dva sjeka~a, dva traktorista i jedan sjeka~-preuzima~) te poslovo|a. Skupina je opremljena s dva traktora i tri motorne pile. Istra`ivanje je provedeno na podru~ju GJ Ju`na Krndija Kutjeva~ka, na nadmorskoj visini od 550 m do 750 m u bukovoj sastojini u dobi od 55 godina. Na temelju norme vremena pojedinih ~lanova postavljen je dinami~ki model skupine. U ovom je slu~aju uzeta najmanja norma vremena (sjeka~a-preuzima~a) te je prema njoj odre|en broj ostalih ~lanova skupine. Norma je vremena izra~unana na temelju matemati~koga modela multiple linearne regresije efektivnoga vremena svakoga ~lana u skupini. Prosje~na norma vremena u skupini za dva sjeka~a iznosi 25,92 min/m3, a prosje~na norma vremena za dva traktora kre}e se od 25,06 min/m3 (150 m) do 33,20 min/m3 (650 m). Norma vremena sjeka~a-preuzima~a iznosi 4,93 min/m3 i uzeta je kao osnovna jedinica. Ako se jedan sjeka~-preuzima~ nalazi na pomo}nom stovari{tu, tada je za optimalan rad skupine potrebno 5,25 sjeka~a i 5,08 (150 m) do 6,73 (650 m) traktora. Optimalna se veli~ina skupine mijenja u odnosu na udaljenost privla~enja traktorom, a kre}e se od 11,33 ~lana (150 m) do 12,98 ~lanova (650 m). Optimalno organizirana skupina mo`e proizvesti 97,29 m3/dan drvnih sortimenata. Dnevni je u~inak izra~unan po ~lanu skupine, a kre}e se od 7,68 m3/dan (150 m) do 5,79 m3/dan (650 m) te je za 79,3 % (150 m) do 35,2 % (650 m) ve}i u odnosu na ostvareni dnevni u~inak od 4,28 m3/dan po ~lanu. Na temelju oblikovanoga dnevnoga u~inaka tro{ak se kre}e od 14,17 EUR/m3 (150 m) do 18,80 EUR/m3 (650 m) te je u odnosu na ostvareni tro{ak od 25,41 EUR/m3 manji za 44,2 % (150 m) do 26,0 % (650 m). Skupni je rad vi{i oblik organizacije rada. U hrvatskom je {umarstvu prihva}en i donio je napredak u odnosu na pojedina~ni rad. Prou~avani su ~imbenici osnova dinami~ke optimizacije skupine radnika na temelju kojih bi se bolje koristilo radno vrijeme, strojevi i ljudski resursi te ostvarila ve}a proizvodnja uz ni`e tro{kove proizvodnje. Klju~ne rije~i: skupni rad, prorede, studij vremena, ~imbenici, proizvodnost, tro{kovi. Authors address – Adresa autora: @eljko Ze~i}, Ph.D.1 e-mail: [email protected] Jurij Maren~e, Ph.D.2 e-mail: [email protected] 1. Department of Forest Harvesting Forestry Faculty of Zagreb University Sveto{imunska 25, 10000 Zagreb, CROATIA. Received (Primljeno): October 24, 2004 Accepted (Prihva}eno): February 17, 2005 Croatian Journal of Forest Engineering 26(2005)1. 2. University of Ljubljana, Biotechnical Faculty Ve~na pot 83, 1000 Ljubljana, SLOVENIA. 37.
(10)
Figure


+2
Related documents
It was decided that with the presence of such significant red flag signs that she should undergo advanced imaging, in this case an MRI, that revealed an underlying malignancy, which
The calculation results with solid lines include the evaporation components in addition to the total of the present INC (pickup from the surface and the inner orbits). Dashed
In this article, we investigate the meromorphic solutions of certain non-linear difference equations using Tumura-Clunie theorem and also provide examples which satisfy our
The Role Of Agriculture Sector In Groundwater Governance (Case Study: Rafsanjan Plain) A Qualitative Research With Using Focus
CHRONIC ULCERATIVE COLITIS: Case Report in a Newborn
Assessing the Impact of Biodiversity Conservation in the Management of Maize Stalk Borer (Busseola f
Field experiments were conducted at Ebonyi State University Research Farm during 2009 and 2010 farming seasons to evaluate the effect of intercropping maize with
