Comminution of logging residues with a tub grinder: Calculation of productivity and procurement cost of wood chips
12
0
0
Full text
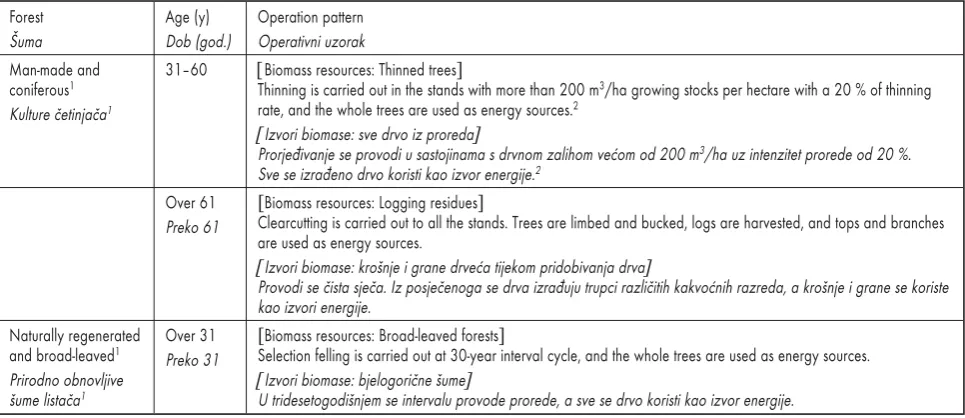
(2) T. YOSHIOKA and H. SAKAI. Amount and availability of forest biomass as an energy resource ... (59–70). income, however, it is crucial to know the relationship between the annual available amount of forest biomass and its harvesting and transporting cost (procurement cost) in the region. For instance, van Belle et al. (2003) analyzed such a relationship on the basis of a geographic information system (GIS). The GIS has been applied to the studies of forestry operation and forest road planning (Dean 1997, Eriksson and Rönnqvist 2003, Forsberg and Rönnqvist 2003, Kluender et al. 2000, Martin et al. 2001, Pentek et al. 2004 and 2005), and some researchers in the Nordic countries utilized the GIS for estimating the amount of domestic forest biomass resources in detail (Nord-Larsen and Talbot 2004, Ranta 2003 and 2004, Talbot and Nord-Larsen 2003). In this study, feasibility of energy utilization of forest biomass in a mountainous region in Japan is discussed by analyzing the relationship between the mass and procurement cost of biomass in the region with the aid of the GIS. A model region was selected, and logging residues, thinned trees, and broad-leaved forests were here defined as forest biomass. It was assumed that forestry mechanization was available for utilization of forest biomass for energy purposes. The objective of this study was to establish the actual situation of the region in terms of energy utilization of forest biomass by investigating the distribution of forest resources, topography, and alignment of forest and public roads as precisely as possible.. 2. Materials and methods – Materijal i metode Hikami County in Hyogo Prefecture, the middle part of Japan was here selected as a model region. The gross area of the county is 493.28 km2, the population is 72,862, and the number of households is 21,769. Its climate is of the inland and basin type, the annual average temperature is 13–14 degrees Celsius, and the annual precipitation is 1,500–1,600 mm/y. Its forest belongs to the lucidphyllous forest zone, total forest area is 37,202 ha (the percentage of gross area is 75 %), and man-made forest covers 58 % of the forest area. There are 43 sawmills, and the annual consumption of logs for timber is 78,992 m3/y. Hikami County is a leading region in forestry and timber business in Hyogo Prefecture. However the annual cut volume of logs has dropped in the region almost by 50 % in the past five years, and the untended forest stands are increasing. Delay in forestry mechanization is one of the major reasons for such a situation. The forest register, the statistics on forest industries, and the guides to forestry practice were provided by the prefectural office. Using these materials and the GIS, the annual available amount of biomass resources was calculated, and the distribution map was made. With regard to the GIS software, TNTmips® (MicroImages, Inc., the U.S.) was used in this study. The shapes and locations of sub-compartments are vector data, which are managed by the prefecture.. Table 1 Operation patterns of sub-compartments to be felled Tablica 1. Opis odsjeka predvi|enih za sje~u Forest [uma Man-made and coniferous1 Kulture ~etinja~a1. Age (y) Dob (god.) 31–60. Over 61 Preko 61. Naturally regenerated and broad-leaved1 Prirodno obnovljive {ume lista~a1. Over 31 Preko 31. Operation pattern Operativni uzorak [Biomass resources: Thinned trees] Thinning is carried out in the stands with more than 200 m3/ha growing stocks per hectare with a 20 % of thinning rate, and the whole trees are used as energy sources.2 [Izvori biomase: sve drvo iz proreda] Prorje|ivanje se provodi u sastojinama s drvnom zalihom ve}om od 200 m3/ha uz intenzitet prorede od 20 %. Sve se izra|eno drvo koristi kao izvor energije.2 [Biomass resources: Logging residues] Clearcutting is carried out to all the stands. Trees are limbed and bucked, logs are harvested, and tops and branches are used as energy sources. [Izvori biomase: kro{nje i grane drve}a tijekom pridobivanja drva] Provodi se ~ista sje~a. Iz posje~enoga se drva izra|uju trupci razli~itih kakvo}nih razreda, a kro{nje i grane se koriste kao izvori energije. [Biomass resources: Broad-leaved forests] Selection felling is carried out at 30-year interval cycle, and the whole trees are used as energy sources. [Izvori biomase: bjelogori~ne {ume] U tridesetogodi{njem se intervalu provode prorede, a sve se drvo koristi kao izvor energije.. 1. The representative tree species in the region are »hinoki« or a cypress (Chamaecyparis obtusa) for coniferous and »keyaki« or a zelkova (Zelkova serrata) for broad-leaved. Reprezentativne vrste drve}a u regiji su »hinoki« ili ~empres (Chamaecyparis obtusa) za ~etinja~e i »keyaki« ili zelkova (Zelkova serrata) za bjelogorice. 2 It was supposed in this study that all of the cut material in thinnings could be used as an energy source in consideration of the actual Japanese market value. Za sav je drvni materijal dobiven iz prorede, a iskori{ten kao izvor energije, u obzir uzeta njegova sada{nja vrijednost na japanskom tr`i{tu.. 60. Croatian Journal of Forest Engineering 26(2005)2.
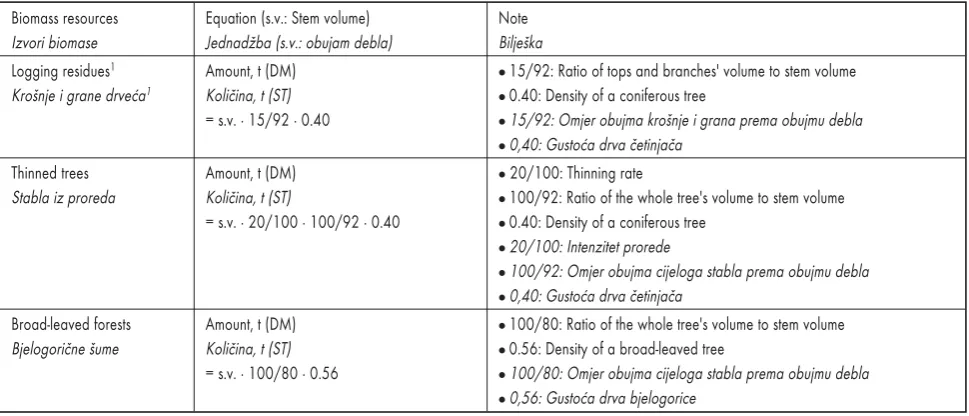
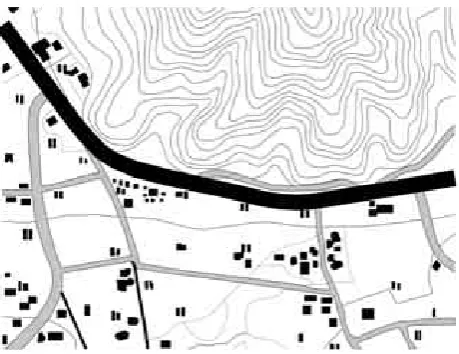
(3) Amount and availability of forest biomass as an energy resource ... (59–70). T. YOSHIOKA and H. SAKAI. Table 2 Methods for calculating the amount of biomass resources Tablica 2. Metode izra~unavanja mogu}ih koli~ina biomase Biomass resources Izvori biomase Logging residues1 Kro{nje i grane drve}a1. Equation (s.v.: Stem volume) Jednad`ba (s.v.: obujam debla) Amount, t (DM) Koli~ina, t (ST) = s.v. · 15/92 · 0.40. Thinned trees Stabla iz proreda. Amount, t (DM) Koli~ina, t (ST) = s.v. · 20/100 · 100/92 · 0.40. Broad-leaved forests Bjelogori~ne {ume. Amount, t (DM) Koli~ina, t (ST) = s.v. · 100/80 · 0.56. Note Bilje{ka • 15/92: Ratio of tops and branches' volume to stem volume • 0.40: Density of a coniferous tree • 15/92: Omjer obujma kro{nje i grana prema obujmu debla • 0,40: Gusto}a drva ~etinja~a • 20/100: Thinning rate • 100/92: Ratio of the whole tree's volume to stem volume • 0.40: Density of a coniferous tree • 20/100: Intenzitet prorede • 100/92: Omjer obujma cijeloga stabla prema obujmu debla • 0,40: Gusto}a drva ~etinja~a • 100/80: Ratio of the whole tree's volume to stem volume • 0.56: Density of a broad-leaved tree • 100/80: Omjer obujma cijeloga stabla prema obujmu debla • 0,56: Gusto}a drva bjelogorice. 1 The method for calculating the cut volume of logs in clearcutting is as follows: Volume of logs (m3) = s.v. · 85/92 (85/92: Ratio of logs' volume to stem volume) Metoda izra~unavanja o~ekivanoga obujma trupaca pri ~istoj sje~i: o~ekivani obujam trupaca (m3) = s.v. · 85/92 (85/92: omjer o~ekivanoga obujma trupaca prema obujmu debla). The digital elevation model (DEM) was used for calculating the heights above sea level and angles of inclination. Forest and public roads were traced on the digital topographic map of the region and converted to vector data. These data were integrated and processed by the software. Harvesting and transporting systems for forest biomass were classified depending on the parts of tree used for energy purposes and topographical conditions, and the equations were developed for calculating the costs.. 2.1. Calculation of annual available amount of forest biomass – Izra~un godi{nje mogu}e koli~ine {umske biomase There were 2,168 sub-compartments in the region, and total growing stock was 7,841,851 m3. In these sub-compartments, there were 1,113 man-made coniferous stands and 398 naturally regenerated broad-leaved stands, and these stands were targeted for harvesting logs and energy sources. The protection forest stands established for the purpose of sediment disaster prevention and water conservation were excluded. This study assumed that thinning and clearcutting were carried out in coniferous forests, and selection felling in broad-leaved forests. Table 1 lists the operation patterns of sub-compartments to be felled. In the man-made coniferous forest, the annual cut volume of the forest was supposed to be the same as the annual increment, so the cutting cycle was calculated as 9.2016 years by dividing the total cut volume (1,158,796 m3, this value was calculated Croatian Journal of Forest Engineering 26(2005)2. based on data from the forest register of the region and Table 1) by the annual increment (125,934 m3/y). The total stem volume of each sub-compartment is recorded in the forest register. Therefore, if the coefficient that converts the stem volume to dry mass is known, the amount of biomass resources can be calculated from the stem volume and the coefficient. The coefficients to calculate the amount of biomass resources are listed in Table 2. Consequently, by applying Tables 1 and 2 to the forest register and considering the cutting cycles of coniferous and broadleaved forests, the annual available amount of forest biomass in the region can be calculated. On the other hand, the amount of biomass in each sub-compartment was calculated by using the GIS, and the distribution map of the region was completed.. 2.2. Preparation of topographic information – Priprema topografskih informacija First, the vector data on shapes and locations of sub-compartments were input into the GIS software, and the forest register data were laid out at the same time. Second, the digital topographic map of the region (1 : 25,000 scale, the Geographical Survey Institute, Japan) was input into the software, and forest and public roads whose width was greater than 3 m were traced and converted to vector data (Figure 1). Third, the DEM of the region (50 m mesh, the Geographical Survey Institute, Japan) was input into the software to calculate the slope of each sub-compart-. 61.
(4) T. YOSHIOKA and H. SAKAI. Amount and availability of forest biomass as an energy resource ... (59–70). Figure 1 Conversion of forest and public roads into vector data Slika 1. Pretvorba {umskih i javnih cesta u vektorske podatke. Figure 2 DEM (right) corresponding to a contour map (left) Slika 2. DMV (desno) koji odgovara karti sa slojnicama (lijevo) ment and to judge the skidding/yarding direction (uphill or downhill) (Figure 2). Fourth, all vector data were converted to raster data. Vector data are projected on a digital topographic map. The converted raster data on shapes and locations of sub-compartments are shown in Figure 3, and the converted raster data on forest and public roads in Figure 4. Finally, the following items on topography were processed by GIS software packages. First, the skidding/yarding distance of each sub-compartment was determined. The distance between the »center of gravity« mesh of a sub-compartment and the. 62. nearest road mesh from the sub-compartment was calculated here, and a landing was to be arranged in the road mesh. Second, transporting distance was determined by calculating the distance between the »landing« road mesh and an energy-conversion plant, which is to be in the center of the region. Third, the average angle of inclination of each subcompartment was calculated, and skidding/yarding direction (uphill or downhill) was judged by comparing the altitudes of the »center of gravity« mesh with the »landing« road mesh. Thus, all topography data of the sub-compartments were prepared. Croatian Journal of Forest Engineering 26(2005)2.
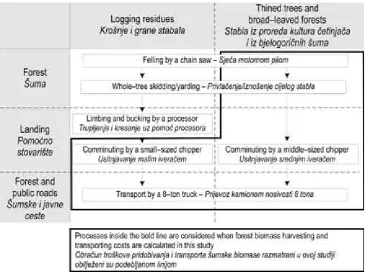
(5) Amount and availability of forest biomass as an energy resource ... (59–70). T. YOSHIOKA and H. SAKAI. Figure 3 Converted raster data on shapes and locations of sub-compartments Slika 3. Pretvoreni rasterski podaci po odsjecima. Figure 4 Converted raster data on forest and public roads Slika 4. Pretvoreni rasterski podaci za {umske i javne ceste 2.3. Classification of forest biomass harvesting and transporting systems – Razredba sustava pridobivanja i transporta {umske biomase In this study the whole trees are used as energy sources (Table 1), and a larger chipper is required Croatian Journal of Forest Engineering 26(2005)2. for their comminutation than the chipper for comminuting logging residues. For the chipping process, the use of a small-sized chipper (the engine power output of 23 PS /17.2 kW/) was assumed for comminuting logging residues, and a middle-sized chipper (200 PS /149 kW/) for comminuting thinn-. 63.
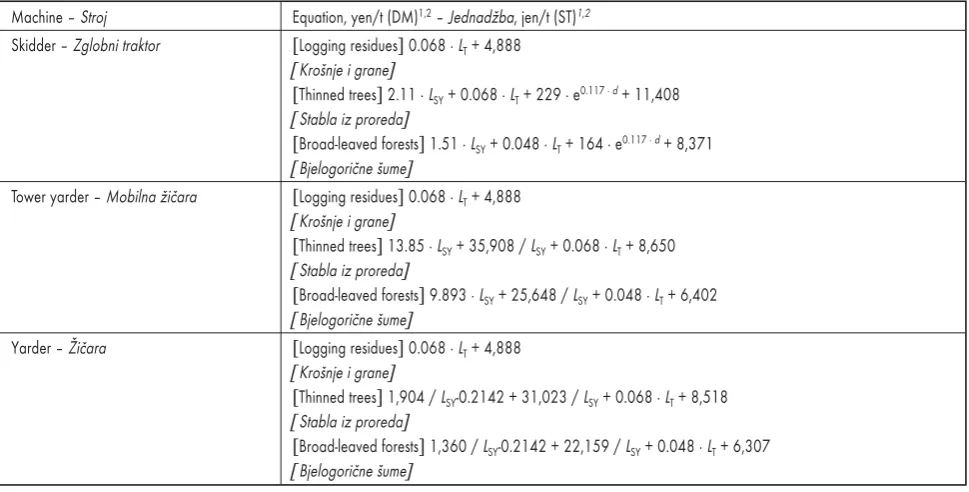
(6) T. YOSHIOKA and H. SAKAI. Amount and availability of forest biomass as an energy resource ... (59–70). Figure 5 Classification of systems according to the parts of a tree for energy purposes Slika 5. Prikaz modela prema dijelovima stabala kori{tenih kao izvor energije (Figure 5). The machine for skidding/yarding is usually selected according to topographical conditions, i.e., slope, skidding/yarding distance, and skidding/yarding direction (uphill or downhill). In this study, the use of tractors (skidders), tower yarders (mobile yarders), and yarders is assumed for skidding/yarding process, and Figure 6 shows the classification of skidding/yarding machines according to topographical conditions of sub-compartments. Table 3 shows the equations for calculating forest biomass harvesting and transporting costs whose variables are slope, skidding/yarding distance, and transporting distance. The costs of labor, machine, and fuel are considered here. By applying topographical data of each sub-compartment to the equations listed above, the procurement costs of forest biomass of all sub-compartments in the region can be calculated.. Figure 6 Classification of machines according to topographical conditions Slika 6. Razredba strojeva za pridobivanje drva prema topografskim uvjetima ed trees and broad-leaved trees. According to the parts of tree for energy purposes (logging residues or the whole tree), forest biomass harvesting and transporting systems were classified into two types. 64. 3. Results and discussions – Rezultati i rasprava 3.1. Annual available amount of forest biomass – Godi{nja mogu}a koli~ina {umske biomase The annual available amount of biomass resources in the region was calculated by the method described in Section 2.1. and Table 4. About half of the Croatian Journal of Forest Engineering 26(2005)2.
(7) Amount and availability of forest biomass as an energy resource ... (59–70). T. YOSHIOKA and H. SAKAI. Table 3 Equations for calculating forest biomass harvesting and transporting costs Tablica 3. Jednad`be za izra~unavanje tro{kova pridobivanja i prijevoza {umske biomase Machine – Stroj Skidder – Zglobni traktor. Tower yarder – Mobilna `i~ara. Yarder – @i~ara. 1 2. Equation, yen/t (DM)1,2 – Jednad`ba, jen/t (ST)1,2 [Logging residues] 0.068 · LT + 4,888 [Kro{nje i grane] [Thinned trees] 2.11 · LSY + 0.068 · LT + 229 · e0.117 · d + 11,408 [Stabla iz proreda] [Broad-leaved forests] 1.51 · LSY + 0.048 · LT + 164 · e0.117 · d + 8,371 [Bjelogori~ne {ume] [Logging residues] 0.068 · LT + 4,888 [Kro{nje i grane] [Thinned trees] 13.85 · LSY + 35,908 / LSY + 0.068 · LT + 8,650 [Stabla iz proreda] [Broad-leaved forests] 9.893 · LSY + 25,648 / LSY + 0.048 · LT + 6,402 [Bjelogori~ne {ume] [Logging residues] 0.068 · LT + 4,888 [Kro{nje i grane] [Thinned trees] 1,904 / LSY-0.2142 + 31,023 / LSY + 0.068 · LT + 8,518 [Stabla iz proreda] [Broad-leaved forests] 1,360 / LSY-0.2142 + 22,159 / LSY + 0.048 · LT + 6,307 [Bjelogori~ne {ume]. Yen to Euro exchange rate was about 135 at the beginning of September 2005. – Po~etkom rujna 2005. godine devizni je te~aj bio 135 jena za 1 euro LSY: Skidding/yarding distance (m), LT: Transporting distance (m), d: Slope (degree) – LSY: udaljenost privla~enja (m), LT: udaljenost prijevoza (m), d: nagib (stupanj). sub-compartments in the region were targeted for harvesting logs and energy sources, and the annual available amount was calculated as a total 52,206 t/y (DM). Both man-made coniferous forests and naturally regenerated broad-leaved forests will be felled in a sustainable way, i.e., by considering the forests cutting cycles. Therefore, the forests' health is expected to be improved by energy utilization of biomass resources. At least 143 t (DM) [52,206 t/y (DM) / 365 (d/y)] of biomass can be supplied to an energy-conversion plant every day (the mass varies with the days of operation). On the other hand, 57,162 m3/y of the cut volume of logs corresponds to 72 % of the annual consumption of logs for timber in the region, and the total amount of logs and energy sources to be harvested are enough to introduce large efficient forestry machines.. 3.2. Relationship between the mass and procurement cost of forest biomass – Ovisnost tro{kova pridobivanja {umske biomase o njezinoj masi Topography data presented in Section 2.2 and equations for calculating the costs classified in Section 2.3 were used here. First, the skidding/yarding machine to be used in each sub-compartment was selected according to the sub-compartment topographical conditions (Figure 6). Second, the harvesting and transporting systems for forest biomass were selected according to the parts of tree for energy purposes (logging residues or the whole tree, Figure 5). Third, the topographical conditions of all sub-compartments were applied to the equations for calculating the harvesting and transporting costs. Table 4 Annual available amount of forest biomass in the region Tablica 4. Godi{nja mogu}a koli~ina {umske biomase u istra`ivanom podru~ju Biomass resources Izvori biomase Logging residues – Kro{nje i grane Thinned trees – Stabla iz proreda Broad-leaved forests – Bjelogori~ne {ume Total – Ukupno. Number of sub-compartments Broj odsjeka 120 637 266 1,023. Croatian Journal of Forest Engineering 26(2005)2. Amount t/y (DM) Koli~ina t/god. (ST) 4,035 27,854 20,317 52,206. Cut volume of logs (m3/y) Obujam izra|enih trupaca (m3/god.) 57,162 – – 57,162. 65.
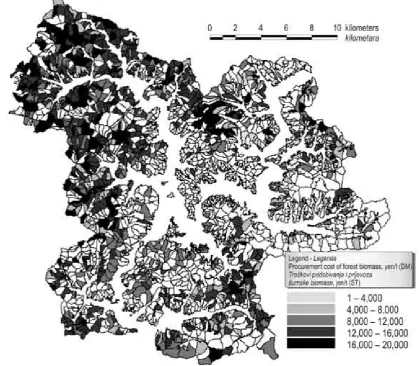
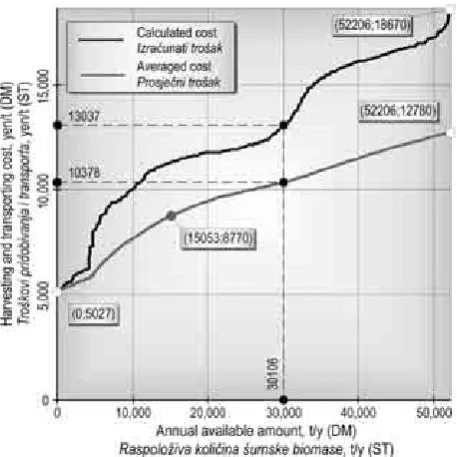
(8) T. YOSHIOKA and H. SAKAI. Amount and availability of forest biomass as an energy resource ... (59–70). Figure 7 Distribution map of the procurement cost of forest biomass, yen/t (DM) Slika 7. Prikaz raspodjele tro{kova pridobivanja i prijevoza {umske biomase, jen/t (ST) (Table 3). As a result, the masses and procurement costs of all sub-compartments were prepared. Figure 7 shows the distribution map of the procurement cost of forest biomass from each sub-compartment, and Figure 8 shows the relationship between the annual available amount and cost for harvesting and transporting forest biomass in the region. Logging residues were the most cost effective, followed by broad-leaved forests; thinned trees were the most costly. In this study, logging residues, i.e., tree tops and branches which are generated during limbing and bucking, are regarded as by-products in logging operations (Figure 5). Therefore, the procurement costs of residues were calculated by considering only the chipping and transporting processes, and these costs proved to be the lowest. Although the procurement cost of thinned trees was roughly the same as that of broad-leaved forests per cubic meter, the cost of broad-leaved forests was. 66. lower than the cost of thinned trees in Figure 8 because of higher bulk density of a broad-leaved tree than that of a coniferous tree. For achieving the energy utilization of forest biomass in the region, the following three advantages, already mentioned above, should be taken into consideration: 1) When an energy-conversion plant puts the upper limit of a purchase price of forest biomass, e.g., »Biomass resources whose prices are 10,000 yen/t (DM) or less will be accepted,« the annual available amount of the plant biomass can be determined. 2) On the other hand, when the annual amount of the required forest biomass is set up, e.g., »20,000 t/y (DM) of biomass will be necessary for the operation of an energy-conversion plant,« the plant can determine the ceiling purchase price. Croatian Journal of Forest Engineering 26(2005)2.
(9) Amount and availability of forest biomass as an energy resource ... (59–70). T. YOSHIOKA and H. SAKAI. purchased. The averaged cost for the supposed plant can be read as 10,378 yen/t (DM) in the above figure, and this value is equivalent to 16.95 yen/kWh. From the cost point of view, it seems to be difficult to utilize forest biomass as an energy resource in the region because the unit price of electricity per kWh in Japan is 18.17 yen/kWh. However, the feasibility of energy utilization of forest biomass should not be only discussed in terms of cost. A comprehensive assessment of utilization of forest biomass should be made taking into consideration the effects of reduction of carbon dioxide (CO2) emission and increase of job opportunities in the region.. 4. Conclusions – Zaklju~ci. Figure 8 Relatioship between the mass and procurement cost of forest biomass Slika 8. Ovisnost tro{kova pridobivanja {umske biomase o njezinoj godi{njoj proizvodnji 3) The procurement costs from all sub-compartments in the region are calculated. Therefore, the terms referred to in both 1) and 2) above, can contribute to drawing up an operational plan, i.e., »From which sub-compartment forest biomass should be harvested and transported?« Here are some considerations about the construction of a power-generation plant that uses forest biomass as fuel and supplies electricity to the region. Concerning the scale of the plant, the net power output is assumed to be 3 MW, the thermal efficiency 12 %, and the operating rate 70 %. This scale of the plant would cover 5,400 households, i.e., 24.8 % of households in the region, and consume 30,106 t/y (DM) of forest biomass. Therefore, the ceiling purchase price of biomass can be read as 13,037 yen/t (DM) in Figure 8, and the plan to harvest and transport biomass from sub-compartments whose costs are lower than 13,037 yen/t (DM) can be laid out. In this case, the average skidding/yarding and transporting distances are 262 m and 14.5 km, respectively (362 m and 13.2 km for logging residues, 146 m and 13.1 km for thinned trees, 275 m and 15.1 km for broad-leaved forests). Figure 8 also shows the averaged cost, which is calculated by dividing the total sum of forest biomass purchase price by the amount of biomass to be Croatian Journal of Forest Engineering 26(2005)2. Feasibility of forest biomass energy utilization in a mountainous region in Japan was discussed with the aid of a geographic information system (GIS). In this study, logging residues, thinned trees, and broad-leaved forests were defined as forest biomass. First, the distribution map of biomass resources was completed by use of the GIS, and information on topography of each sub-compartment was prepared. Second, harvesting and transporting systems were classified into six types according to the parts of tree used as energy source (two types) and topographical conditions (three types), and the equations for calculating the costs whose variables are slope, skidding/yarding distance, and transporting distance were developed. Finally, the relationship between the mass and procurement cost of forest biomass in the region was analyzed. As a result, logging residues [the annual available amount was 4,035 t/y (DM)] proved to be the most cost effective, followed by broad-leaved forests [20,317 t/y (DM)]; thinned trees [27,854 t/y (DM)] proved to be the most costly. This analysis could be of help in drawing an operational plan, i.e., in selecting sub-compartments to be felled. For instance, it was calculated that the amount of biomass resources of 30,106 t/y (DM) was required for the construction of a power-generation plant that covered 24.8 % of the power consumed by households in the region. To obtain this amount of forest biomass for energy purposes, forest biomass should be harvested in sub-compartments, whose procurement costs are lower than 13,037 yen/t (DM). In addition to forest biomass discussed in this study, it would be convenient and cost effective to utilize mill residues (wood shavings and barks generated in sawmills and plywood industries), woodbased waste material, and trimmings of park trees, roadside trees, and garden trees. For instance, if half the amount of biomass necessary for the supposed plant [15,053 t/y (DM)] were covered by mill resi-. 67.
(10) T. YOSHIOKA and H. SAKAI. Amount and availability of forest biomass as an energy resource ... (59–70). dues, wood-based waste material and trimmings generated in the region, the averaged cost of forest biomass would be reduced to 8,770 yen/t (DM) (Figure 7). Moreover, many of the mill residues, woodbased waste material and the trimmings can be obtained free of charge, so that the effectiveness of the reduction in biomass procurement cost would be even greater on the whole, e.g., {15,053 [t/y (DM)] · 8,770 [yen/t (DM)] + 15,053 [t/y (DM)] · 0 [yen/t (DM)]} / 30,106 [t/y (DM)] = 4,385 [yen/t (DM)]. On the other hand, the relationship between the mass and procurement cost of forest biomass analyzed in this study was only focused on the present moment. Considering a long-term feasibility of a sustainable utilization of forest biomass, further studies and discussions should be carried out.. Acknowledgement – Zahvala This study was partly supported by a Grantin-Aid for Scientific Research from the Ministry of Education, Culture, Sports, Science and Technology, Japan (No. 16-10303).. 5. References – Literatura Dean, D. J., 1997: Finding optimal routes for networks of harvest site access roads using GIS-based techniques. Canadian Journal of Forest Research 27 (1), p. 11–22. Eriksson, J., Rönnqvist, M., 2003: Transportation and route planning: Akarwe, a web-based planning system. In: IWARSSON WIDE, Maria & BARYD, Berit (eds.). Proceeding of the 2nd Forest Engineering Conference (May 12–15, 2003, Växjö, Sweden): Decision Support System/ Tools, p. 48–57. Forsberg, M., Rönnqvist, M., 2003: Integrated logistics management in the forest supply chain. In: IWARSSON WIDE, Maria & BARYD, Berit (eds.). Proceeding of the 2nd Forest Engineering Conference (May 12–15, 2003, Växjö, Sweden): Decision Support System/Tools, p. 64–73.. Nord-Larsen, T., Talbot, B., 2004: Assessment of forest fuel resources in Denmark: Technical and economic availability. Biomass and Bioenergy 27 (2), p. 97–109. Pentek, T., Pi~man, D., Por{insky, T., 2004: Planning of forest roads in Croatian mountainous forest by the use of modern technologies. In: Anon. (ed.). Proceedings of the International Scientific Conference on »Forest Engineering: New Techniques, Technologies and the Environment« (October 5–10, 2004, Lviv, Ukraine), p. 380–389. Pentek, T., Pi~man, D., Poto~nik, I., Dvor{~ak, P., Neve~erel, H., 2005: Analysis of an existing forest road network. Croatian Journal of Forest Engineering, 26 (1), p. 39–50. Ranta, T., 2003: Logging residues from regeneration fellings for biofuel production: A GIS-based availability analysis. In: Anon. (ed.). Proceedings of Bioenergy 2003: International Nordic Bioenergy Conference and Exhibition (September 2-5, 2003, Jyväskylä, Finland), p. 176–183. Ranta, T., 2004: Logging residues from regeneration fellings for biofuel production: A GIS-based availability analysis in Finland. Biomass and Bioenergy 28 (2). p. 171–182. Talbot, B., Nord-Larsen, T., 2003: Using haulage distance as a determinant of supply strategy for the bio-energy sector in Denmark. In: IWARSSON WIDE, Maria & BARYD, Berit (eds.). Proceeding of the 2nd Forest Engineering Conference (May 12–15, 2003, Växjö, Sweden): Technique and Methods, p. 139–148. van Belle, J.-F., Temmerman, M., Schenkel, Y., 2003: Three level procurement of forest residues for power plant. Biomass and Bioenergy 24 (4–5), p. 401–409. Yoshioka, T., Iwaoka, M., Sakai, H., Kobayashi, H., 2000: Feasibility of a harvesting system for logging residues as unutilized forest biomass. Journal of Forest Research 5 (2), p. 59–65. Yoshioka, T., Aruga, K., Sakai, H., Kobayashi, H., Nitami, T., 2002: Cost, energy and carbon dioxide (CO2) effectiveness of a harvesting and transporting system for residual forest biomass. Journal of Forest Research 7 (3), p. 157–163.. Kluender, R., Weih, R., Corrigan, M., Pickett, J., 2000: The use of geographic information system in harvest landing location for ground-based skidding operations. Forest Products Journal 50 (3), p. 87–92.. Yoshioka, T., Aruga, K., Nitami, T., Kobayashi, H., Sakai, H., 2005a: Energy and carbon dioxide (CO2) balance of logging residues as alternative energy resources: System analysis based on the method of a life cycle inventory (LCI) analysis. Journal of Forest Research 10 (2), p. 125–134.. Martin, A. M., Owende, P. M. O., Holden, N. M., Ward, S. M., O'Mahony, M. J., 2001: Designation of timber extraction routes in a GIS using road maintenance cost data. Forest Products Journal 51 (10), p. 32–38.. Yoshioka, T., Hirata, S., Matsumura, Y., Sakanishi, K., 2005b: Woody biomass resources and conversion in Japan: The current situation and projections to 2010 and 2050. Biomass and Bioenergy 29 (5), p. 336–346.. 68. Croatian Journal of Forest Engineering 26(2005)2.
(11) Amount and availability of forest biomass as an energy resource ... (59–70). T. YOSHIOKA and H. SAKAI. Sa`etak. [umska biomasa kao izvor energije u planinskom podru~ju Japana: GIS studija Japansko je {umarstvo dugo vremena bilo nerazvijeno. I danas ima puno regija u kojima {umarstvo i {umski radovi nisu mehanizirani te su tro{kovi sje~e izuzetno visoki. S druge je strane {umska biomasa u tim regijama izuzetno zanimljiva za cjelokupno japansko gospodarstvo. O~ekuje se, naime, kako }e uporaba {umske biomase za energiju pridonijeti razvitku {umarstva uz istodobno unapre|enje ekolo{kih, ekonomskih i socijalnih funkcija {umskih kultura kojima dosad nije gospodareno na zadovoljavaju}i na~in. Pri tome je nu`no izraditi studije kojima }e se prikazati mogu}nosti proizvodnje {umske biomase te tro{kovi njezina pridobivanja i transporta. U ovom se radu raspravlja o mogu}nosti uporabe {umske biomase u jednoj od planinskih regija u Japanu uz primjenu geografskoga informacijskoga sustava (GIS). Kao model za provedbu istra`ivanja odabrano je podru~je Hitami (u pokrajini Hyogo) povr{ine 493,82 km2, od ~ega na {ume i {umsko zemlji{te otpada oko 75 % (58 % je {umskih kultura ~etinja~a, dok prirodnih {uma lista~a ima 42 %). Izdvojeno je 2168 odsjeka s ukupnom drvnom zalihom od 7 841 851 m3. Cilj je rada utvrditi postoje}u situaciju na istra`ivanom podru~ju glede mogu}nosti uporabe {umske biomase za energiju uz definiranje detaljnoga rasporeda {umske biomase po odsjecima, odabir tehni~koga sredstva za njezino privla~enje (izno{enje) i iveranje te analizu postoje}e mre`e {umskih i javnih cesta, kao i konfiguracije terena. Definirane su tri ina~ice uporabe {umske biomase s obzirom na tip i dob {ume. U kulturama se ~etinja~a u dobi od 31 do 60 godina sva drvna masa iz prorednih sje~a koristi kao izvor energije. U istim se kulturama ~etinja~a u dobi preko 61 godine provode ~iste sje~e, od debala se posje~enih stabala izra|uje tehni~ka oblovina, dok se kao izvor energije koriste samo kro{nje i grane posje~enih stabala. U tre}em se slu~aju {umska biomasa pridobiva iz prirodnih {uma lista~a; sje~e se provode svakih 30 godina i sva se drvna masa rabi za energiju. Primjenom je GIS-a izra|en tematski zemljovid distribucije {umske biomase istra`ivanoga podru~ja. Za svaki su odsjek definirani i parametri konfiguracije terena (nagiba) kako bi se odredio smjer privla~enja/izno{enja drvne biomase. Odre|ene su i prosje~ne srednje udaljenosti privla~enja/izno{enja drvne biomase (primjenom te`i{ne metode) te srednje udaljenosti kamionskoga transporta drvne biomase do krajnjega korisnika. Pri sje~i je stabala upotrebljavana motorna pila, ~itava su stabla privla~ena (izno{ena) do pomo}noga stovari{ta na kojem su samo iz stabala ~etinja~a starijih od 61 godine izra|ivani trupci (izradba je drvnih sortimenata obavljena procesorom). Odabir je tehni~koga sredstva za privla~enje (izno{enje) drva obavljen temeljem topografske ra{~lambe svakoga odsjeka, a moglo se odabrati izme|u zglobnoga traktora, mobilne `i~are i `i~are. Iveranje se obavljalo na pomo}nom stovari{tu {umske ceste. Transport je do krajnjega korisnika izveden kamionom nosivosti 8 t. Dizajnirani su matemati~ki modeli izra~una tro{kova pridobivanja i transporta {umske biomase (od {ume do krajnjega korisnika) u ovisnosti o obja{njenim utjecajnim ~imbenicima. Rezultati analiza pokazuju kako je na istra`ivanom podru~ju mogu}e proizvesti ukupno 52 206 t/god. {umske drvne biomase, {to iznosi oko 143 t dnevno. Od toga je 27 854 t/god. iz kultura ~etinja~a u dobi od 31 do 60 godina (637 odsjeka), 4 035 t/god. iz kultura ~etinja~a u dobi preko 61 godine (120 odsjeka) i 20 317 t/god. iz prirodnih {uma lista~a (266 odsjeka). Tako|er je, uz navedenu koli~inu {umske biomase, mogu}e izraditi i 57 162 m3/god. trupaca razli~ite kakvo}e ({to je 72 % godi{nje potrebe 43 pilane u regiji). Rezultati }e ove analize pomo}i pri izradbi operativnoga plana pridobivanja {umske biomase, a u kombinaciji s tro{kovnom komponentom odabiru odsjeka iz kojih se postupak pridobivanja mo`e provesti najjeftinije. Prosje~na srednja udaljenost privla~enja/izno{enja {umske biomase iznosi 262 m, a prosje~na udaljenost kamionskoga prijevoza {umske biomase 14,5 km. Ukupna koli~ina mogu}e {umske biomase istra`ivanoga podru~ja s ukupnom cijenom pridobivanja i transporta ni`om od 13 037 yen/t ({to je uzeto kao gornja cjenovna granica) iznosi 30 106 t/god. i pokriva 24,8 % godi{njih potreba za energijom ku}anstava u regiji Hitami.. Croatian Journal of Forest Engineering 26(2005)2. 69.
(12) T. YOSHIOKA and H. SAKAI. Amount and availability of forest biomass as an energy resource ... (59–70). Prosje~na cijena pridobivanja i transporta {umske biomase iznosi 10 378 yen/t, {to odgovara cijeni od 16,95 yen/kWh elektri~ne energije. Cijena elektri~ne energije u Japanu danas iznosi 18,17 kWh, pa kada se cijeni pridobivanja i transporta {umske biomase pribroje i ostali tro{kovi potrebni za proizvodnju elektri~ne energije iz {umske biomase, tada samo s tro{kovnoga stajali{ta dono{enja odluke ideja se ne bi mogla podr`ati. Me|utim, tro{kove je mogu}e dodatno smanjiti uporabom biomase iz drugih izvora (npr. ostaci nastali orezivanjem parkovnoga drve}a, drve}a uz rubove cesta, ostaci iz pilana itd.) te svesti ukupnu cijenu pridobivanja biomase na 8 770 yen/t. Nije opravdano raspravljati o mogu}nosti i potrebi uporabe {umske biomase za energiju samo s gledi{ta tro{kovne isplativosti. Treba uzeti u obzir i mogu}nost otvaranja novih radnih mjesta, smanjenje emisije uglji~noga dioksida (CO2) itd. Prikazani je model nu`no sagledati u {irem okru`enju te }e daljnje studije i rasprave i}i u tom smjeru. Klju~ne rije~i: {umska biomasa, studija isplativosti, planinsko podru~je, GIS, tro{kovi pridobivanja i prijevoza, Japan. Authors address – Adresa autora: Takuyuki Yoshioka, Ph.D. Department of Forest Science and Resources College of Bioresource Sciences Nihon University 1866 Kameino Fujisawa 252-8510 JAPAN e-mail: [email protected]. Received (Primljeno): September 05, 2005 Accepted (Prihva}eno): November 09, 2005. 70. Hideo Sakai, Ph.D. University Forest in Hokkaido Graduate School of Agriculture and Life Sciences The University of Tokyo Aza-yamabe 2 jyo Kita 1 Furano 079-1561 JAPAN e-mail: [email protected] Croatian Journal of Forest Engineering 26(2005)2.
(13)
Figure

+5
Related documents