Evaluation of P300 based Lie Detection Algorithm
Syed Kamran Haider1,*, Malik Imran Daud2, Aimin Jiang1, Zubair Khan1
1Department of Internet of Things, Hohai University, Changzhou, China 2Department of Electrical Engineering, Foundation University, Rawalpindi, Pakistan
Abstract
Lie detection mechanism is used to evaluate the ethical and moral values of people. In general, these moral and ethical values are difficult to determine. Earlier technique like polygraph does not provide accuracy in determining mental behaviour. Lately, it is possible to study psychological response of a person using electroencephalogram (EEG). Based on this, we develop a standalone solution that can detect brain signals using EEG. To this end, we extract the desired features from the brain signals acquired through sixteen electrodes using various extraction techniques. Then, we implement linear discriminant analysis (LDA) classification technique to differentiate the positive and negative samples from the signals obtained from sensors in order to achieve a decision for either guilty subject or innocent subject accordingly. The whole work is designed with the help of MATLAB and Xilinx tool. For efficiency, the whole system is implemented on FPGA. The amount of correct deception detection in guilty and innocent subjects are 85%. It is easy and more convenient approach than other previously used methods.Keywords
Event Related Potential, Linear Discriminant Analysis, P300 Features Extraction1. Introduction
Deception detection has drawn much value from scientific society in the past decades. It has found many applications related to psychological implications. In present, the older technique polygraph are widely used for the justification of deceptive and truthful behavior of subject [1]. A researchable analysis gives us an idea that, with the help of EEG signals we can easily monitor the psychological variations, brain activities and deception detection related features [2, 3].
In decision making situation where scientific study gives us best solution which is relevant to the measurement of P300 event related potentials (ERP). The reason is to do so far is that cognitive disability is often associated with variations in the P300 potentials, the waveform can be helpful in treatments of cognitive task. There is a variety of uses for the P300 potential in scientific study, leading from study of depression and drug infatuation to anxiety dis-orders.
Currently designed Brain Computer Interface (BCI) systems and prototypes are facing problems in slow communication channel. The transfer rate (ITR) between human brain and BCI prototypes are lower than 100 bits per minute [4]. A systematic framework for hardware BCI is implemented using FPGA [5]. The system utilizes a BCI hardware modular architecture based on FPGA and allows
* Corresponding author:
[email protected] (Syed Kamran Haider) Published online at http://journal.sapub.org/eee
Copyright © 2017 Scientific & Academic Publishing. All Rights Reserved
integrating the complete BCI on a single FPGA device. Our research aims to explore the possibilities of the high-speed recognition from EEG signals, and a standalone system that can be used as a lie detector with less processing time without any software involvement. But this achievement is reached at a price of implementing the whole work process on MATLAB and as well as on FGPA chip.
In this research a system is designed to prove the feasibility of the whole concept of lie detector. The implementation of lie detector algorithm on FPGA and its interfacing with blue tooth module is the most critical step in our work. To reduce the development time that takes place at feature extraction and signal classification stage, high level synthesis approach is used. This approach is much better than the Register Transfer Language (RTL) flow, which can generate small enough design, such that it can fit the complete BCI pipeline into one FPGA device. Usage of LDA classifier synthesis speeds up the design process and allows us to work on a fairly high level of abstraction during the development of new algorithms. Further, high available computational power of FPGA device will allow us to integrate progressive non-linear signal processing algorithms like Principal Component Analysis (PCA) and Independent Component Analysis (ICA) for feature extraction. Compared to other known solutions of Transmit (Tx) part, Bluetooth Low Energy radio interface is proposed to keep the system power consumption as low as possible.
2. Test Based for Implementation
using FPGA
2.1. Participants
Twenty subjects (15 males and 5 females, ages between 20-25 years) that were generally universities students (undergraduate and postgraduate) and all had good health with stable psychological behavior participated in this study. Fig.1 shows the step-wise methods for the understanding of lie detector we have developed with some overview of the methodological analysis of this research.
Figure 1. Lie Detector Implementation flow chart
2.2. Lie Detection Based Scenario
We have recorded data of over 15 to 20 subjects. In one scenario, some precious items (e.g., jewelry, cash, smart phones, etc.) were placed in front of some subjects. Those subjects were not informed about the scenario and the subject can be any random person. Another person called as Subject-2 intended to perform this test come and stole that item that was placed in front of person called as Subject-1. It can be any person but suggestively that can be his/her close friend. As this test was performed in university, university authorities would handle the case of that stolen item [6]. This was done only to put our subject under pressure for lie and truth response. While conducting test in the presence of authorities our subject wore Emotiv EPOC headset. Some training data was collected to define the correct lie and truth classes. Training slides were prepared on MATLAB with defined time period (in our case 5 to 6 seconds for each question) of each image and questionnaire set. First some obvious questions were asked that everybody would answer the obvious answers, i.e., the true answer [7]. The instructions was also given to the subjects during the process to count the total number of questions asked by the investigator. This was essential to keep a record that our subject was mentally attentive and fluctuating thoughts did not come during the data acquisition process. Authenticity of
data was achieved through counting. At the end, the subject was asked to inform about the total number of questions displayed [8].
2.3. Desired Signal Acquisition
The brain signals were recorded with the sample rate of 128 samples per second. The recorded signals which were digitized and amplified can be monitored offline with the help of MATLAB software. Pass band filter were used with the range of 0.3-30 Hz prior to data analysis. For P300-based study about Guilty Knowledge Test (GKT) the previous mentioned pass band filter range were used [9]. The EEG signals from EPOC headset are itself digitized because headset contains the built-in analog to digital converter (ADC). The data can be received through the headset using Bluetooth receiver at reception end.
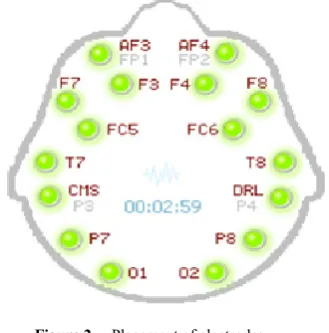
The electroencephalogram (EEG) signals were recorded using 16 channels Emotiv EPOC headset. The position of the sensors is shown in Fig.2.
Figure 2. Placement of electrodes
The Emotiv EPOC headset provide the features like high resolution and multi-channel and used in various applications in the field of research. The raw EEG waveform can be monitor on the software provided by the company. Moreover, it has the detection libraries: Mental Commands, Performance Metrics & Emotional States and Facial Expressions.
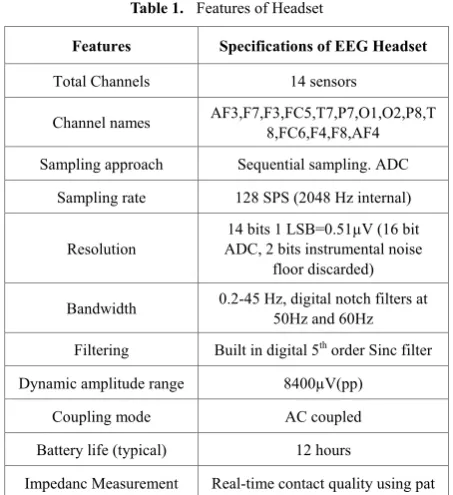
The Emotiv EPOC headset is specially designed headset & provides the following features shown in the Table 1.
Table 1. Features of Headset
Features Specifications of EEG Headset
Total Channels 14 sensors
Channel names AF3,F7,F3,FC5,T7,P7,O1,O2,P8,T8,FC6,F4,F8,AF4 Sampling approach Sequential sampling. ADC
Sampling rate 128 SPS (2048 Hz internal)
Resolution ADC, 2 bits instrumental noise 14 bits 1 LSB=0.51µV (16 bit floor discarded) Bandwidth 0.2-45 Hz, digital notch filters at 50Hz and 60Hz
Filtering Built in digital 5th order Sinc filter
Dynamic amplitude range 8400µV(pp) Coupling mode AC coupled Battery life (typical) 12 hours
Impedanc Measurement Real-time contact quality using pat
2.4. Pre-Processing
After applying pass band filter on EEG signals, each continuous subject record is divided into single sweep as per the times known by stimulus presentation [10]. The total length of each single sweep is 1000ms, and contains 128 samples. Then the signal pattern recognition technique includes special features extraction and features selection. After that apply classification method on the signals to assess the detection rate. It should be noticed that, in all cases related to P300 ERP the Pz is the prime location where P300 can be monitored maximal and therefore visual related experiments were performed only on Pz data [11].
2.5. Optimal Features Extraction
The original recorded EEG signal is in time domain and the whole signal energy distribution is dispersed. The optimal features are suppressed with the noise. In order to dig out the features, EEG signal is observed under the signal energy in the form of time domain or frequency domain. The frequency domain analysis is the best for those features utilized in the mental task related to EEG signals [12].
Two types of features were observed in this evaluation. These extracted features were also involved in similar studies and shown good performance and it is also useful for our application too.
2.5.1. Morphological Features
Several morphological features (based on shape) were extracted and evaluated. It has; Latency time, Maximum Peak value of signal, Positive value in the signal, Total Area and some others as discussed in [14]. These optimal features were previously used in to identify depressive subjects by using P600 ERP of the signal [13].
2.5.2. Frequency Features
This group of features has the frequency related characteristic of the signal [14]. It contains the features; mode, median and mean of the frequency.
2.6. Features Abstraction
To determine the guilty and innocent response of the subject all the defined features from the probe sweeps were save in European data format (.edf) file. Then the analysis was applied to find out the most related features for the guilty subjects (G-Probes) and innocent subjects (I-Probes) at signal classification stage [15].
2.7. Signal Classification
Extracted features were referred towards the LDA [16, 17]. This method has less computational requirement and it is more appropriate method for many pattern recognition related problems. In addition, LDA classifier is very simple to use and provides better results. The popularity of this classifier has been involved EEG processing, ERP related researches such as motor imagery based BCI systems, P300 speller and P300 component detection. This classification technique is more perfect and best practical processing method on data collected for P300 speller paradigm. Moreover, same like other classifier, LDA also share some drawbacks. Before applying P300 classifier on EEG signals, LDA needs to take the average of several trials to de-noise the background noise and increase the magnitude of P300 response for better results. Taking average of several trials is a time consuming step which greatly slows down the classification process and therefore it is not appropriate for real time P300 classification with single trial. It becomes our interest to implement algorithms for the detection of P300 in lie detection scenario [18].
In our research we are following class depend approach. The mathematical model of the class depend transformation we adopted as follow:
For better understanding of two-class problem, this concept is applied on 2-D data points. Mathematical interpretation of this classification method in cooperate with the MATLAB implementation allied with this work. The representation of 2-D data sets in the matrix containing features [19]: set1 = ⎣ ⎢ ⎢ ⎢
⎡aa1121 aa1222 ⋯ ⋯
am1
⋯ ⋯ am2⎦
⎥ ⎥ ⎥ ⎤
, set2 =
⎣ ⎢ ⎢ ⎢
⎡bb11 b12
21 b22
⋯ ⋯
bm1
⋯ ⋯ bm2⎦
⎥ ⎥ ⎥ ⎤
(1)
(1) Calculate mean for individual data sets and mean for
complete data set. Let 𝜇𝜇1 represents mean of data
set1 and 𝜇𝜇2 represents be the mean of data set2,
respectively, and 𝜇𝜇3 represents the entire data mean, which is calculated by inclusion of set1 and set2:
where 𝑝𝑝1 and 𝑝𝑝2 shows the two-class a prior probabilities. In our scenario of deception detection, the probability index is consider to be 0.5.
(2) All the covariance matrices hold the symmetric property. Let cov1 represents the covariance of data set1 and cov2 represents the covariance of data set2. Covariance matrix is calculated with the help of following equation.
𝑐𝑐𝑐𝑐𝑐𝑐𝑗𝑗 = �𝑥𝑥𝑗𝑗− 𝜇𝜇𝑗𝑗��𝑥𝑥𝑗𝑗− 𝜇𝜇𝑗𝑗�𝑇𝑇 (3) Therefore, for the two-class problem:
(3) Calculate the with-in class variance
𝑆𝑆𝑤𝑤= 0.5 ∗ 𝑐𝑐𝑐𝑐𝑐𝑐1+ 0.5 ∗ 𝑐𝑐𝑐𝑐𝑐𝑐2 (4) (4) The between-class distribution is calculated by using
following equation:
𝑆𝑆𝑏𝑏 = ∑ �𝜇𝜇𝑗𝑗 𝑗𝑗− 𝜇𝜇3� ∗ �𝜇𝜇𝑗𝑗− 𝜇𝜇3�𝑇𝑇 (5) 𝑆𝑆𝑏𝑏 can be represented as the covariance of data sets whose elements belongs to mean vector of each class. As defined before, formulation of optimization criterion in classification of LDA is the proportion of between-class distribution to within-class distribution. The solution achieved by maximizing this criterion represent the axes of new transformed space. Moreover in class-dependent case the optimizing criterion is calculated by using mention above equations. It should be verified that in class dependent LDA type, for L-class type L separate optimizing criterion are needed for each single class as calculated in Eq (6).
(5) The optimizing index in case of class dependent type are computed as:
𝑐𝑐𝑐𝑐𝑐𝑐𝑐𝑐𝑐𝑐𝑐𝑐𝑐𝑐𝑐𝑐𝑐𝑐j= 𝑐𝑐𝑐𝑐𝑐𝑐(𝑐𝑐𝑐𝑐𝑐𝑐𝑗𝑗) ∗ 𝑆𝑆𝑏𝑏 (6) (6) To obtain the transformation matrices, we transform
the data sets using single LDA transform.
𝑇𝑇𝑠𝑠𝑐𝑐𝑐𝑐 _𝑗𝑗 = (𝑇𝑇𝑗𝑗)T× set_j (7)
where (𝑇𝑇𝑗𝑗)T is the transpose of the Eigen vector which is obtained from the 𝑐𝑐𝑐𝑐𝑐𝑐𝑐𝑐𝑐𝑐𝑐𝑐𝑐𝑐𝑐𝑐𝑐𝑐𝑗𝑗 of each sets and set_j are the data set 1 and data set 2.
(7) Once the transformation are concluded using LDA transformation, then Euclidean distance or Root mean square (RMS) distance is used for the classification of data points.
𝑑𝑑𝑐𝑐𝑠𝑠𝑐𝑐𝑐𝑐= 𝑐𝑐𝑐𝑐𝑡𝑡𝑐𝑐𝑠𝑠𝑡𝑡𝑐𝑐𝑐𝑐𝑚𝑚𝑐𝑐𝑠𝑠𝑝𝑝𝑐𝑐𝑐𝑐𝑇𝑇× 𝑥𝑥 − 𝜇𝜇𝑐𝑐𝑐𝑐𝑐𝑐𝑡𝑡𝑐𝑐𝑠𝑠 (8) where 𝜇𝜇𝑐𝑐𝑐𝑐𝑐𝑐𝑡𝑡𝑐𝑐𝑠𝑠 is the mean of the transformed data set, n is the class index and x is the test vector. For n classes 𝑐𝑐, Euclidean distances are obtained for each test point. The smallest Euclidean distance among the distances classifies the test vector as belonging to class n.
2.8. FPGA Implementation
The contribution presents a novel high performance, low power BCI architecture allowing a single-chip implementation of a BCI device. FPGA platform is used to reach high performance and low power consumption; to speed up the classification process, high-level synthesis of
signal processing algorithms is employed by research scientists. FPGA architecture has many advantages i.e. configurability, possibility of independent development, topological compatibility, scalability, and high computational power as proposed for P300 based lie detector implementation [20].
Usage of developing the whole system on FPGA synthesis speed up the design process and allows us to work on a fairly high level of abstraction during development of new algorithms. Further, high available computational power of the FPGA device will allow us to integrate progressive non-linear signal processing algorithms like PCA and ICA for feature extraction. Compared to other known solution of the Transmit (Tx) part, Bluetooth Low Energy radio interface is proposed to keep the system power consumption as low as possible.
Hardware descriptive language (HDL) model needs to be transformed into binary stream before it can be coded to FPGA. ELBERT series related chips can only accepts binary (.bin) data bit stream created by XILINX software tool kit. Once HDL model is synthesized, it is more easy and convenient to produce a binary data bit stream out of it. The Papilio Pro board uses the FT2232 dual channel interface USD chip that helps for the easy reprogramming of SPI flash [21]. The .mat extension file load from the host application (MATLAB) and program it in to SPI Flash memory and then lets the FPGA boot from the flash.
3. Results and Discussion
3.1. MATLAB Simulation Results
As given in first scenario, the training data sets of two classes i.e. the lie & truth data sets are plotted corresponding to one another. Set1 is the truth data set class whereas set2 belongs to lie data sets.
Data sets are transformed through LDA classifier. Mean, variances, co-variances are calculated. Increase of separability criterion by the calculation of between and within class variances. In this project, class dependent transformation is applied because the objective is to maximize adequate class separability measure. Test vector is the target data, which need to be calculated that to which class it belongs. In the following figure it is clearly shown that vector set lies at minimum distance to the transformed set1 which is data set of truth class. This shows honest behavior of subject. On the other hand if the test vector lies at minimum distance to the transformed set2 i.e. lie data set, the subject is lying.
The Figure 3. indicates the data sets of lie and truth classes. The data sets of two classes are scattered randomly which would not provide the required information needed to separate the classes. The values are also normalized in feature vector set to remove the noise content of EEG signal.
Figure 3. Training data of truth & lie sets (subject 1)
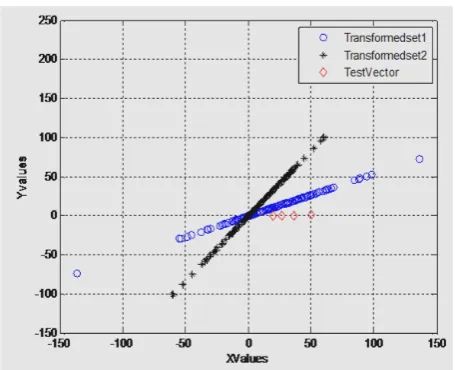
Figure 4. Target data indicating it belongs to transformed set 1 (the truth response)
In Figure 4. target data set lies to the transformed set1, this is trained innocent set. This is measured by minimum mean distance of the target data set to the innocent and guilty vector sets. The vector to which the targeted vector placed closely is the outcome of innocent and guilty response. Here, it is clearly shown that the subject has not concealed the information, which is our innocent subject.
Similarly the guilty response shows that sort of plots where evidently target set depicts that our response is dishonest.
Likewise, Figure 5. Indicates the data sets of lie and truth classes. The data sets of two classes are scattered randomly which could not provide the required information needed to separate the classes. The values are also normalized in feature vector set to remove the noise content of EEG signal. LDA maximizes the separability measure of the two classes, which are shown in the next figure.
In Figure 6. target data set lies close to the transformed set2, this is the trained guilty set. This is measured by the minimum mean distance of the target data set to the innocent
and guilty vector sets. The vector to which the targeted vector placed closely is the outcome of innocent and guilty response. Here, it is clearly shown that the subject has concealed the information, which is our anticipated guilty subject.
Figure 5. Training data of truth & lie sets (subject 2)
Figure 6. Target data indicating it belongs to transformed set 2 (the Lie response)
3.2. FPGA Implementation Results
reason behind the evaluation of lie detector on FPGA chip. If we connect headset with the FPGA using Bluetooth then there is no need for the intermediate device to monitor the signals. We can display the result on output port of FPGA using red and green light using with the help of screen display. In this section using Verilog coding the lie detection algorithm were implemented after verifying the MATLAB results. The FPGA kit is of Xilinx Company (Papilio Pro) is used. We used ISE 14.2 suit of Xilinx for writing the Verilog Coding.
The first case is about the innocent person and the below results shows the execution of first case. In the same manner like MATLAB after extracting the desired features from training data and testing data all values were stored on (.mat) file.
Figure 7. FPGA reset state
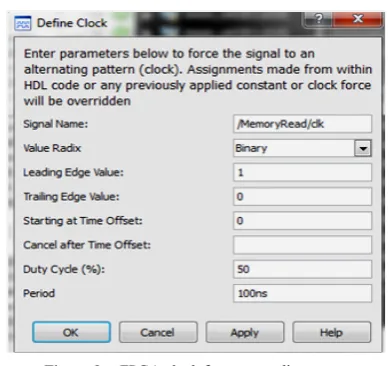
In Figure 7. Operations of LDA were adjusted on clock cycle, each clock leading edge one operation related to LDA will be performed on training and testing data sets. Before going to execute the LDA technique, Fig.8. Shows to set the initial parameters like clock period, leading edge value etc.
Figure 8. FPGA clock frequency adjustment
On each leading edge of clock one by one all tasks will be performed. On the first leading edge clock execute “RESET” command, everything is reset at that time. Status register shows “0000”.
On the Second leading edge of clock “Test vector, Set 1, Set 2” files were read. Status register were changed to “0001”.
Figure 9. Reading the Test vector, set1 & set2 data on the next leading edge of clock
After calculating the classification algorithm, “Euclidean distance” is calculated for the “set 1 & set 2”.
Figure 10. Calculate Euclidean distance for both set1 & set2
After calculating Euclidean distance on the next leading edge the message were displayed “Subject is innocent”. This shows that the samples are of innocent person.
Figure 11. Output of FPGA (Innocent response of subject)
compared to target data. Innocent samples are closer than the guilty samples. Distance of set2 is greater than set1, which shows that the subject is innocent. The next case is about guilty subject.
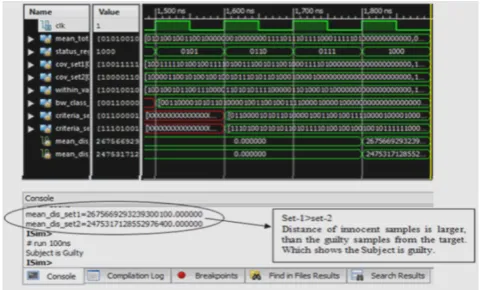
In the Fig.10 mean_dis_set1 shows distance of innocent samples from the target and similar as mean_dis_set2 shows distance of guilty samples as compared to target data. Guilty samples are closer than the innocent samples. Distance of set is greater than set2, which shows that the subject is guilty.
Figure 12. Output of FPGA (Guilty response of subject)
4. Conclusions
In this research, it becomes the determination and motivation to hardware (FPGA) implementation of the algorithm; P300 component analysis based on LDA classification technique with P300 peak values corresponding to each channel of electrode. We have achieved 85% accuracy in detecting lie and truth subjects. Simulation results on MATLAB is achieved by acquiring signals on Emotiv headset whereas on FPGA simulation is attained by converting the .edf format into .mat format and loaded it into the Papilio pro. Emotiv headset is the latest device that can map the EEG signal more accurately and with good signal to noise ratio. The filters that are used in headset digitized the signal and send to the Bluetooth receiver and we can monitor the signals on our systems. Our research is targeted to the evaluation of the high processing speed recognition from the EEG signals and makes a standalone system, which can be used as a lie detector. However, this achievement was reached at a price of implementing the whole algorithm on MATLAB and FPGA.
In terms of cost analysis the FPGA device is cheaper than the super computers to execute the heavy programs and the execution time of hardware is better than the software simulation of code. In the old methodology like polygraph to detect lie heavy machines were used to generate the reports. This new system eliminates the cost of heavy machines and gives the idea to build a standalone system using a small hardware device with good performance ability. However, with the emerging technology of latest products new methods are still under consideration to give the better output.
ACKNOWLEDGMENTS
This work was supported in part by the National Nature Science Foundation of China under grants 61101158, 61471157, and 61401148, and the Natural Science Foundation of Jiangsu Province, China under grants BK20130238, BK20141159 and BK20141157, and Science &Technology Program of Changzhou, China under Grant CJ20159039.
REFERENCES
[1] Shen, J., Liu, X., & Liang, J. (2016). P300-based deception detection in simulated network fraud condition. Electronics Letters, 52(13), 1136-1138.
[2] Rosenfeld, J. P., Hu, X., & Pederson, K. (2012). Deception awareness improves P300-based deception detection in concealed information tests. International Journal of Psychophysiology, 86(1), 114-121.
[3] Social Network Analysis for Fraud Detection. (2015). Fraud Analytics Using Descriptive, Predictive, and Social Network Techniques, 207-278.
[4] L.A. Farwel, E. Donchin, The truth will out: interrogative polygraphy (lie detection) with event-related potentials, Psychophysiology 28 (1991) 531–547.
[5] Xie, S., Wu, Y., Zhang, Y., Zhang, J., & Liu, C. (2014). Single channel single trial P300 detection using extreme learning machine: Compared with BPNN and SVM. 2014 International Joint Conference on Neural Networks (IJCNN). [6] Non-Invasive BCI through EEG Senior Honors Thesis Daniel
J. Szafir, 2009-10 Advised by Prof. Robert Signorile. [7] A. Akrami, et. al, "EEG-Based Mental Task Classification:
Linear and Nonlinear classification of Movement Imagery", In proceedings of the 2005 IEEE Engineering in Medicine and Biology 27th Annual Conference Shanghai, China, September 1-4, 2005.
[8] Simbolon, A. I., Turnip, A., Hutahaean, J., Siagian, Y., & Irawati, N. (2015). An experiment of lie detection based EEG-P300 classified by SVM algorithm. 2015 International Conference on Automation, Cognitive Science, Optics, Micro Electro-Mechanical System, and Information Technology (ICACOMIT).
[9] E. H. Meijer, F. T. Y. Smulders, H. L. G. J. Merckelbach, A. G. Wolf, “The P300 is sensitive to concealed face recognition. International,” Journal of Psychophysiology, vol 66, pp. 231–237, 2007.
[10] J. P. Rosenfeld, M. Soskins, G.Bosh, A. Ryan, “Simple, effective countermeasures to P300-based tests of detection of concealed information,” Psychophysiology, vol 41, 205–219, 2004.
the event-related potential and implicit behavioral measures: a methodology for prediction in the face of individual differences, Psychophysiology 29 (1992) 504–522.
[12] Gao, J., Tian, H., Yang, Y., Yu, X., Li, C., & Rao, N. (2014). A Novel Algorithm to Enhance P300 in Single Trials: Application to Lie Detection Using F-Score and SVM. PLoS ONE, 9(11).
[13] G. Ganis, S.M. Kosslyn, S. Stose, W.L. Thompson, D.A. Yurgelun-Todd, Neural correlates of different types of deception: an fMRI investigation, Cerebral Cortex 13 (2003) 830–836.
[14] V. Abootalebi, M. H. Moradi, M. A. Khalilzadeh, “A new approach for EEG feature extraction in P300-based lie detection,” Computer Methods and Programs in Biomedicine, vol 94, pp. 48–57. 2009.
[15] F.A. Kozel, L.J. Revell, J.P. Lorberbaum, A. Shastri, J.D. Elhai, M.D. Horner, A. Smith, Z. Nahas, D.E. Bohning, M.S. George, A pilot study of functional magnetic resonance imaging brain correlates of deception in healthy young men, The Journal of Neuropsychiatry and Clinical Neurosciences 16 (2004) 295–305.
[16] F.A. Kozel, T.M. Padgett, M.S. George, A replication study of the neural correlates of deception, Behavioral Neuroscience 118 (2004) 852–856.
[17] D.D. Langleben, J.W. Loughead, W.B. Bilker, K. Ruparel, A.R. Childress, S.I. Busch, R.C. Gur, Telling truth from lie in
individual subjects with fast event-related fMRI, Human Brain Mapping 26 (2005) 262–272.
[18] S. Axler, Linear Algebra Done Right, Springer-Verlag New York Inc., New York, New York, 1995.
[19] T.M.C. Lee, H.L. Liu, L.H. Tan, C.C.H. Chan, S. Mahankali, C.M. Feng, J. Hou, P.T. Fox, J.H. Gao, Lie detection by functional magnetic resonance imaging, Human Brain Mapping 15 (2002) 157–164.
[20] J.M. Nunez, B.J. Casey, T. Egner, T. Hare, J. Hirsch, Intentional false responding shares neural substrates with response conflict and cognitive control, Neuroimage 25 (2005) 267–277.
[21] K.L. Phan, A. Magalhaes, T.J. Ziemlewicz, D.A. Fitzgerald, C. Green, W. Smith, Neural correlates of telling lies: a functional magnetic resonance imaging study at 4 Tesla, Academic Radiology 12 (2005) 164–172.
[22] P. Johankhani, V. Kodogiannis, and K. Revett, “EEG Signal Classification Using Wavelet Feature Extraction and Neural Networks,” in IEEE John Vincent Atanasoff 2006 International Symposium on Modern Computing (JVA06). 2006, pp.120–124, IEEE.