PHARMACEUTICAL AND TECHNICAL SCIENCE
ISSN (O) :- 2349-3585EXAMINE THE MASS SPECTROMETRY METHOD
FOR TESTING THE EPITRANSCRIPTOME IN
CELLULAR LYSATES
__________________________________________________________________________________________
Dr. HumnaAyyaz Butt
1, Dr. Javaria Syed
2, Dr. Asma Sajid
3, Dr. Hamid Jugg
4 1Khawaja Muhammad Safdar Medical College, Sialkot, Pakistan, 2Sargodha Medical College, Sargodha, Pakistan,3
Central Park Medical College, Lahore, Pakistan, 4Sheikh Zayed Medical College, Rahim Yar Khan, Pakistan
ABSTRACT:New findings in the field of epitranscriptomics have led to resurgence in the study of modified nucleic acids in RNA.
Current mass spectrometry methods for the study of the epitranscriptome lack key information on the state of modified nucleotides
in RNA and cellular lysates. Presented here is the first report of modified nucleotides in RNA and the cell, and provides the first
reported method for the untargeted analysis of these compounds using HILIC-HRMS. We utilized a novel extraction method to
measure both the bound and unbound modified nucleotides in a single sample. This method also provides separation of many
modified nucleoside species. MS-FINDER software was used to provide in silico structure predictions for the creation of
fragmentation rules for separation of methylated modified nucleotides on the MS2 level. Annotated here are 12 modified
nucleotide species and 20 nucleosides across RNA types and cell lines.
INTRODUCTION
Epitranscriptomics is an emerging field studying chemical additions to RNA bases. Analogous to epigenetic modifications, epitranscriptome modifications do not alter the RNA sequence itself, but are post-transcriptional modifications to the RNA molecule. There are over one hundred reported RNA base modifications that include acetylation, methylation and hydroxylation on various positions of the RNA molecule1-3. Modified bases have been reported in both coding and non-coding RNAs and are conserved across organisms2. Serval modifications have been reported to influence function or stability of RNA, while many remain unconnected to distinct phenotypes. Current methods to study the epitranscriptome use immunoprecipitation sequencing or targeted mass spectrometry methods, and are largely hypothesis driven approaches. Immunoprecipitation sequencing provides sequence location of modified RNA bases but is not able to provide discovery of new nucleic acid modifications. This is because antibodies must be made against variant bases that subsequently can be used for pull- down sequencing. However, after validation and proper controls, antibody detection of specific RNA modifications is
protocol to determine modified nucleotides and nucleosides as native molecular species in cell extracts (Figure 1A). Further limiting our knowledge, targeted mass spectrometry methods are often used for the study of hydrolyzed RNA. By only measuring pre-determined targets, these studies continue to provide the same information on a limited number of modified nucleosides. With over 100 reported modifications3, these targeted studies routinely only measure a small subset of these modifications5-7. While modifications commonly studied are important targets, it is possible cellular phenotypes associated with unmeasured modifications are being ignored. This is where untargeted mass spectrometry studies can provide additional insight. Untargeted methods are only limited by the chemical space obtained in the extraction, chromatography and other analytical methods used. This provides an unbiased measurement of compounds in a sample, providing new hypothesis and areas of study. The study of epitranscriptomic modifications has identified novel RNA modifications that impact cellular function and may be linked to disease states2,8. While it is important to understand how epitranscriptomic modifications are regulated on RNA molecules, little attention has been given to understanding the fate of modified nucleic acids after RNA degradation. RNA degradation occurs by three major classes of intercellular RNA- degrading enzymes, 3’ endonucleases, 3’ exonucleases and 5’ exonucleases9. These enzymes are found in the
exosome and degrade RNA by creating nucleotide fragments and single nucleotides10. RNA mass spectrometry methods measuring nucleosides are not measuring the major RNA degradation products (Figure 1A) but a further metabolized break down product. Completely ignoring nucleotides limits our understanding of RNA metabolism and the epitranscritpome. Without methods to measure modified nucleotides, and spectra or standards, these peaks remain un- annotated. Combining the analysis of modified nucleic acids from hydrolyzed RNA with methods that can assess the abundance and nature of free monomers at the cellular level will provide insight into how these modifications may affect global cellular behavior in normal and disease states. This can be achieved by pairing the analysis of hydrolyzed RNA with metabolomics to provide vital information on the metabolism
of modified nucleotides, of which little is currently known. We provide here the first untargeted high resolution mass spectrometry method for the analysis of modified nucleotides. This is also the first reported method for the analysis of free nucleotides and RNA monomers from the same sample11 (Figure 1B). We use hydrophilic interaction chromatography (HILIC) column for metabolite separation without ion-pairing reagents and has a run time of 17 min enabling analysis of at least 50 samples per day. We utilized new software tools for the annotation of modified nucleotides in the RNA and provide fragmentation rules for methylated nucleotides based upon authentic standards.
Figure 5.1: Cellular RNA degradation products. Figure
1A: the major cellular RNA degradation products are
nucleotide species, which are then converted to
nucleosides. Figure 1B: To determine total cellular
nucleotide content, both RNA and cellular fractions should
be measured from the same sample.
MATERIALS AND METHODS
Sample preparation
Cells were grown in DMEM supplemented with 10% FBS and maintained in incubator with 10% CO2. Cells were harvested with trypsin, washed with PBS and then flash frozen. Metabolites were extracted for first using with 225 µl of methanol at −20°C and 750 µL of MTBE (methyl tert butyl ether) (Sigma Aldrich) at −20°C. Samples were shaken for 6
min at 4°C with an Orbital Mixing Chilling/Heating Plate (Torrey Pines Scientific Instruments). Then 188 µl of LC-MS grade water (Fisher) was added. Cell pellets were vortexed, centrifuged and the bottom (polar) layer was collected evaporated to dryness (CentriVap). RNA was extracted from the metabolomics extraction pellet using Invitrogen RNA isolation kit, following manufacturer’s instructions for total
manufacturer’s instructions. RNA yield and quality was
accessed using NanoDrop. RNA was hydrolyzed using P1 Nuclease (Sigma) for nucleotide analysis. For nucleoside analysis RNA was hydrolyzed using P1 Nuclease (Sigma), Phosphodiesterase (Sigma) and Alkaline Phosphates (Sigma) as previously described12. Chromatographic and mass spectrometric conditions for polar metabolite HILIC- QTOFMS analysis Five microliters or 25 microliters of re-suspended sample was injected onto a Waters Acquity UPLC BEH Amide column (150 mm length 2.1 mm id; 1.7 μm particle size) with an additional Waters AcquityVanGuard BEH Amide pre-column (5 mm 2.1 mm id; 1.7 µm particle size) maintained at 45°C coupled to an Agilent 1290 Infinity UHPLC. The mobile phases were prepared with 10 mM ammonium formate and 0.125% formic acid (Sigma–Aldrich) in either 100% LC-MS grade water for mobile phase (A) or 95:5 v/v acetonitrile:water for mobile phase (B). Gradient elution was performed from 100% (B) at 0-2 min to 70% (B) at 7.7 min, 40% (B) at 9.5 min, 30% (B) at 10.25 min, 100% (B) at 12.75 min, isocratic until 16.75 min with a column flow of 0.4 mL/min. Spectra were collected using a quadrupole/orbital ion trap mass spectrometer Q Exactive HF with a HESI-II ion source (Thermo Fisher Scientific). Simultaneous MS1 and MS/MS (data-dependent MS/MS) acquisition was used. The parameters were ESI polarity, positive or negative; sheath gas pressure, 60 psi; aux gas flow, 25 arbitrary units; sweep gas flow, 2 arbitrary units; spray voltage, 3.6 kV; capillary temperature, 300°C; aux gas heater temperature, 370°C; MS1 mass range, m/z 60–900; MS1 resolving power, 30,000 FWHM (m/z 200); number of data-dependent scans per cycle: 3; MS2 resolving power, 15,000 FWHM; acquisition speed: 2 MS1 spectra/s; normalized collision energy, 20, 30, 40%.
Data processing and annotation
HILIC data processing was performed using MS-DIAL13 for peak picking, alignment, and identification. MS-FINDER software was used for in silico fragmentation and structure prediction14.
RESULTS AND DISCUSSION
Optimization of nucleoside and nucleotide chromatography Various parameters were evaluated for the separation of
modified nucleosides and nucleotides, with selected optimizations detailed in this section. Due to the hydrophilic nature of the metabolites of interest, a HILIC method was chosen. Using a Waters BEH Amide HILIC column, we achieved baseline or near baseline separation of many modified nucleotide species in a 17 min run. We report here a method with sufficient sensitivity without the use of ion-pairing reagents, as common for some nucleic acid methods4. We found positive and negative ionization mode performed well for nucleosides, while negative ionization mode was best suited for nucleotides. To further improve our limits of detection, we performed large volume injection testing and changes to resuspension solvents. We show baseline separation of many nucleotide and nucleoside isomers in both standards and samples. Chromatographic separation of nucleotide and nucleosides using Hydrophilic Interaction
Liquid Chromatography (HILIC)
Method development began with un-modified nucleotide and modified nucleoside standards and focused on separation of isomers. As there are numerous methods available for the measurement of nucleosides5-7, we focused our method development on the separation of nucleotides, choosing a final method that performed best for these species. Analysis of modified nucleosides, using authentic standards, showed clear separation for most isomers modified on the nucleic acid base when resuspending standards in initial chromatography conditions. However, nucleoside isomers with 2’- and
3’-O-methylation on the ribose group did not show baseline chromatographic separation as shown in Figure 2A of methyluridine isomers. These isomers and would be best measured using traditional reversed-phase liquid chromatography methods or by utilizing separation based upon MS2 level fragmentation as previously reported15. To improve signal intensity for analysis of RNA hydrolysates, higher injection volumes were tested to decrease the amount of RNA needed for analysis. This increase in signal intensity aimed to decrease the total number of cells that need to be grown and harvested, simplifying the biological laboratory workflow. For nucleosides, increased injection volumes over 5 μL showed decreased peak shape and separation between
volume had little to no impact upon chromatography performance (Figure 2B). Therefore, increased injection volumes permitted injection of 5-times more RNA per run than original injection volume of 5 µL. This helped decrease RNA needed for the analysis, however we are still using higher quantiles of RNA than other methods5-7. To decrease material used, we can later adapt this method to a targeted approach. This would allow for the untargeted profiling of modified nucleotides, and then the targeted, more sensitive approach for subsequent studies. We feel this provides a balance between discovery, using larger RNA volumes, and subsequent hypothesis driven targeted analysis.
Figure 5.2: Resuspension and injection comparison
between nucleoside and nucleotide species. Figure 2A:
Chromatographic and spectral separation of methyl
uridine species using HILIC method with a BEH Amide
column in ESI (–) mode. Using a resuspension solvent of
the same composition as the HILIC starting conditions
improved peak shape for nucleoside species compared to
other solvents. Nucleotides showed no changes in peak
shape from changing solvent conditions. Figure 2B: Higher
injection volumes allowed for increased RNA injected for
nucleotides, but was unsuccessful for nucleosides.
Characteristic MS2 fragments provide insight to
substructure
Using P1-nuclease treated total RNA, we annotated 12 modified nucleotides, including three mUMP isomers. These isomers were separated by chromatography and differentiated by MS/MS fragmentation spectra. Using the example of mUMP isomers, we developed fragmentation rules to apply to other methyl-nucleotides annotated with this method. From analysis of 3-methyl uridine monophosphate (3mUMP) we found characteristic MS2 fragments that were used to further identify mUMP isomers on the MS2 level. Of the three mUMP isomers found, two shared a unique m/z 125.034 fragment, while the third isomer had a characteristic m/z 111.018 fragment not present in the other two mUMP isomers
(Figure 3A). To build substructure predictions of these fragments, we used MS-FINDER software (Figure 3B). We found the m/z 111 fragment was predicted to be a uridine base fragment, while the m/z 125 fragment was predicted to be a methyl uridine base fragment. Injection of the 3-mUMP standard confirmed the m/z 125 fragment to be a methyl uridine base fragment. Further analysis found two sets of fragments that allow for prediction of methylation status of the sugar of the uridine base. These fragments are shown in Figure 3B and derive from the sugar phosphate group of these species. Fragments m/z 192.990 and m/z 211.000 are indicative of a non-methylated sugar phosphate group, while fragments m/z 207.006 and m/z 225.016 are characteristic for a methyl-sugar phosphate group.
Figure 5.3 Identification of 3mUMP in hydrolysed RNA.
Using HILIC-ESI(–)-OrbitrapMS with a normalized
collision energy of 20, 30, 40% combined fragmentation
compared to authentic standard, we show identification of
3-mUMP in RNA. In addition to 3-mUMP, two other main
mUMP isomers were found. One isomer we predict to be a
combinationof 2’-O-mUMP and 3’-O-mUMP with a
distinct 111 m/z fragment. The other isomer we predict to
be 5-mUMP as it also contains 125 m/z fragment. Figure
3B: MS-FINDER substructure prediction of MSMS
spectra fragments. Using MS-FINDER for in silico
unknown modified nucleotide species. Shown here is the
example for 3-mUMP and 2’-O- or 3’-O-mUMP, with
characteristic fragments found for each isomer. 3m-UMP
annotation was confirmed with authentic standard.
5.1.1 RNA Hydrolysis using enzymatic, acidic and basic
methods
Two enzyme methods were used for RNA hydrolysis, one to obtain nucleosides and another to obtain nucleotides. P1-nuclease, phosphodiesterase and phosphatase treatment reduced RNA to nucleosides, while using P1-nuclease alone resulted in single nucleotides. Acid and base hydrolysis methods were also tested, but were not selected due to lower yields and production of degradation products (Supplemental Figure 1). Higher amounts of nitrogenous bases were found in basic digestions, showing digestion past the nucleoside level, an undesired by-product. Total RNA that was separated into tRNA/rRNA and mRNA were treated in the same manner to produce either nucleosides or nucleotides.
5.1.2 Ion suppression observed in LC-MS, but not GC-MS
in cellular fractions
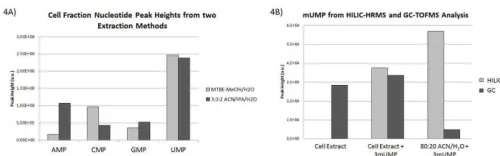
After establishing HILIC methods for authentic standards and RNA, we applied these methods to cellular fractions. Two extraction methods were evaluated: a single phase acetonitrile:isopropanol:water (3:3:2, v/v/v) extraction and a bi-phasic MTBE- methanol/water extraction. Matrix effects were observed for nucleotides in the cell fraction that appeared to be extraction-type dependent. We found the single phase extraction increased yields for AMP and GMP, while the bi-phasic extraction had increased yields in UMP and CMP (Figure 4A). Since the bi-phasic method would yield a lipidomic fraction in addition to the hydrophilic fraction, allowing for an additional analysis on a single sample, we performed further evaluation of this extraction method. To test for matrix effects on modified nucleotide species, we performed spike-in testing of 3-mUMP standard with different mass spectrometry methods. Cell extract with and without added 3-mUMP standard were compared to standard alone on HILIC–high-resolution mass spectrometry (HILIC-HRMS) and compared to gas chromatography–time-of-flight mass spectrometry (GC-TOF MS) (Figure 4B). We found the HILIC-HRMS run showed decreased abundances of 3-mUMP
compared to GC-TOF MS, when using fold change compared within each platform. Furthermore, no 3-mUMP signal was detected in the cell fraction data obtained using HILIC-HRMS until the standard was spiked in, despite detection of 3-mUMP in the same un-spiked cell fraction using GC-TOF MS. Standard alone showed increased levels in LC compared to GC, and demonstrate that the sensitivity in LC is not the reason for decreased 3-mUMP abundance. Indicating matrix effects are leading to ion suppression of 3mUMP in the cellular lysate sample. A possible factor might be the effect of co-eluting matrix components that interfered with modified nucleotides in cellular fractions and caused ion suppression in the electrospray interface of HILIC-HRMS16 so that only higher amounts of 3-mUMP would be detectable. Such ion suppression effects do not occur in GC-TOF MS. This is an excellent example of how parallel analysis of unknowns and standard mixtures on both LC and GC instrumentation can lead to further method development and biological interpretation.
Figure 4 Extraction differences in nucleotide species. Two extraction methods were tested in U87 cells, showing
similar abundance in the MTBE-methanol/water
extraction compared to acetonitrile:isopropanol:water (3:3:2, v/v/v) extraction. AMP and CMP species showed different trends between extractions, which will have to be repeated to confirm extraction differences. Figure 4B: Investigation of MTBE-methanol/water extraction loss of signal shows matrix effects that are platform specific. The same U87 cell extract was split and half spiked with 3-mUMP standard, the other with solvent. A third standard only sample was also prepared. On HILIC-HRMS ESI(–) mode no signal for 3-mUMP was found in un-spiked cell extraction, and cell extraction with spike in and standard showed mUMP signal. GC-TOFMS analysis showed 3-mUMP to be present in all samples.
5.1.3 Combined bound and unbound nucleic acid RNA
extraction
molecules were pelleted. The polar fraction of the general metabolomics extraction contained small molecules from the cell, including free nucleotides and nucleosides. The extraction pellet was further processed using an RNA isolation kit to produce the RNA fraction. The RNA fraction was further processed in some experiments to tRNA/ rRNA and mRNA as outlined in Figure 5A. Identical cell culture samples were used to analyze both free and bound nucleic acids, enabling us to directly compare relative abundances for nucleic acids in their free (polar metabolite extraction) and bound (RNA hydrolysis product from pellets) forms. We tested the RNA isolated using this method compared to RNA extracted using an RNA kit only by Nano-Drop spectroscopy for RNA quantity and mRNA quality. The combined RNA-metabolite extraction showed a non-significant increase in RNA yield from NanoDrop analysis. To determine if RNA isolated from this combined method still contained viable mRNA, we used qPCR to test for a low abundant transcript, VANGL1, compared to GAPDH for both extraction methods. From this analysis, there is a non- significant decrease of VANGL1 transcript in the RNA-metabolite extraction compared to RNA extraction alone (Figure 5B).
Figure 5 Workflow and validation of RNA-metabolomics
combined extraction. Figure 5A: Combined sample
preparation workflow for metabolomics and
epitranscriptomics mass spectrometry analysis. Figure 5B:
Combined extraction RNA yields and quality. Using Nano-
drop spectroscopy to determine RNA yield shows similar
levels between RNA extraction and RNA-metabolite
combined extraction. Using qPCR, mRNA quality and
abundance was similar between extraction methods, with a
small non-significant decrease in the RNA-metabolite
combined extraction.
5.1.4 Analysis of hydrolyzed RNA and cellular fractions
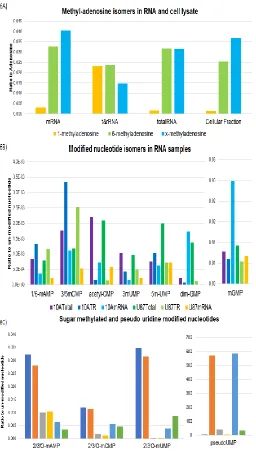
Untargeted analysis of hydrolyzed RNA and cellular extracts were performed to measure modified nucleosides and nucleotides. Based upon our limited trials, we found modified nucleotide and nucleoside intensities varied between cell lines and RNA types and between RNA and cellular lysate (Figure 6). This suggests that there could be differences in the metabolism of these RNA species. To understand the comparison of RNA types, we looked to information on the relative abundances of these species in the cell. The RNA and DNA content of a cell varies depending upon cell cycle status and cell volume. The nucleic acid content of a cell of a cell is thought to be around 15-20% of the total cellular mass, also varying depending upon cell cycle. Of this, excluding DNA (up to 3%) the RNA content is 85% rRNA, >5% mRNA and the rest a mixture of tRNA and other RNA species with these estimations varying based upon cell type and size17,18. We found rRNA/tRNA fractions didn’t reflect the total RNA
fraction as closely as expected based upon the overall abundances of these RNA species in the cell. As current, there is no finding reported in the literature that would support valid explanations for our results.
Hydrolyzed RNA to nucleosides in U87 cell line
fractions show similar ratios of modified adenosine species to adenosine with differences in t/rRNA fractions and total RNA, which was unexpected. Peak height values not normalized to adenosine levels show similar trends to normalized data. It is interesting that the relative abundances of these modified species are similar between total RNA and cellular fractions as the degradation of methyladenosine from nucleotide has not been previously reported. It is thought that modified nucleosides cannot be acted upon by salvage pathway enzymes and are therefore excreted in the urine19. Deoxypyrimidine salvage of modified nucleosides, specificly modified deoxycytosine has been previously studied, and showed these species are not acted upon by nucleotide salvage enzymes, but can be recyled through other pathways20. However the metabolism of purines, such as adenosine, is still unknown. With the high abundance of methyadenosine isomers, and other modified nucleosides in the cell, there must be currently unknown recyling or transport pathways for clearing of these metabolites. Furthermore, no studies on the cancer specific degradation of endogenous modified nucleosides (or nucleotides) have been reported. This is critical, as autophagy, used for recycling cellular material, is known to contribute to the pathogenesis of cancer. Autophagy is a method of degrading cellular material in the lysosome for production of energy and macromolecular precursors21. It is known that cancer cells utilize increased autophagic flux for tumor survival and growth22 and extensive preclinical evidence supports inhibiting autophagy to improve clinical outcomes21. Autophagy can be inhibited by 3-methyladenosine, which acts through inhibition of phosphoinositide 3- kinase (PI3K)23. It is possible other methyladenosine isomers are acting in similar epimetabolite roles24. The RNA modification database3 shows no record of 3- methyladenosine as a reported RNA modification. It is unclear why cells would have evolved sensitivity to a non-endogenous methylated adenosine isomer and it seems likely other isomers may exhibit a similar response. Without any understanding of modified nucleic acid metabolism, from RNA to cellular degradation, we are potentially missing epimetabolite, non-canonical roles, for these compounds in vivo.
5.1.5 Analysis of hydrolyzed RNA to nucleotides in U87
and MCF10A cell lines
We next compared modified nucleotide species across RNA types in two cell lines, U87 and 10A cells using the same normalization method (Figures 6B and 6C). We found 12 modified nucleotide species, annotated based upon accurate mass and fragmentation rules found in Figure 3. This is the first report of the measurement of modified nucleotides using mass spectrometry to our knowledge. All modified nucleotides were normalized to their un-modified nucleotide for sample comparison across RNA types. Without authentic standards for all species, it is impossible to be entirely sure of the isomer annotations made, so species were left as combined between isomers until standards can resolve these species. It appears this method may not provide chromatographic separation of O- and 3’-O methylated species. It is possible rules for
induce differential tertiary structure and local chemistry. These modifications affect stacking of RNA bases, sugar puckering and local chemistry of tRNAs affected the ability of macromolecules to recognize them25. It is plausible the modifications made to other RNA species are serving similar purpose, affecting RNA structure. Other studies have proposed the main role of these modifications is to provide coordinated regulation of a large number of mRNAs during major cellular reprogramming or similar events26. What is still unknown is the fate of these modified nucleotides after RNA degradation as they have not been previously measured using mass spectrometry. With the method here, we aim to further characterize these pathways from RNA to cellular metabolites.
Figure 6 Analysis of modified nucleoside and nucleotides
across various samples. Figure 6A: Nucleoside content was
measured in mRNA, tRNA/rRNA, total RNA and the
cellular fraction. Shown here are methyladenosine isomers
normalized to adenosine for each sample. 1-
methyladenosine and 6-methyladenosine were identified
based upon authentic standards for each compound.
X-methyladenosine was additional X-methyladenosine species
found during untargeted analysis. N = 1, data shown
acquired using HILIC-HRMS in ESI (+) mode. Figure 6B:
Shown are methylated and acetylated nucleotide species
annotated in 10A and U87 cell line RNA samples. Each
modified nucleotide is normalized to its un-modified form.
N = 1, data shown acquired using HILIC-HRMS in ESI (−)
mode. Figure 6C: Sugar methylated modified nucleotides
and pseudouridine nucleotides annotated in 10A and U87
cell line RNA samples. Each modified nucleotide was
normalized to its un-modified form. 2’/3’-O-methylted
bases were found for adenosine, cytosine and uridine, but
not guanosine in this analysis. N = 1, data shown acquired
using HILIC-HRMS in ESI (−) mode.
In summary, we identified 12 modified nucleotides by running authentic standards with samples. For nucleotides, we annotated 20 modified nucleosides using accurate mass and in silico fragmentation prediction software MS-FINDER. As standards were not available for all nucleotides, we validated 3mUMP annotation using a synthesized standard as proof of principle for this method and annotation workflow. Nucleosides were identified by comparing retention time, m/z, and MS2 spectra to authentic standards.
CONCLUSIONS
cellular lysate, we found differences in abundances between RNA types and cell lines. This highlights the possibility that differential metabolism is occurring for these free nucleic acid species. This is to our knowledge the first report modified nucleotides measured in RNA and cellular lysate using mass spectrometry.
REFERENCES
1 Li, X., Xiong, X. & Yi, C. Epitranscriptome sequencing technologies: decoding RNA modifications. Nat Methods 14, 23-31, doi:10.1038/nmeth.4110 (2016).
2 Schwartz, S. Cracking the epitranscriptome. RNA 22, 169-174, doi:10.1261/rna.054502.115 (2016).
3 Cantara, W. A. et al. The RNA Modification Database, RNAMDB: 2011 update. Nucleic Acids Res 39, D195-201, doi:10.1093/nar/gkq1028 (2011).
4 Wetzel, C. &Limbach, P. A. Mass spectrometry of modified RNAs: recent developments. Analyst 141, 16-23, doi:10.1039/c5an01797a (2016).
5 Cai, W. M. et al. A Platform for Discovery and Quantification of Modified Ribonucleosides in RNA: Application to Stress-Induced Reprogramming of tRNA Modifications. Methods Enzymol 560, 29-71, doi:10.1016/bs.mie.2015.03.004 (2015).
6 Su, D. et al. Quantitative analysis of ribonucleoside modifications in tRNA by HPLC-coupled mass spectrometry. Nat Protoc 9, 828-841, doi:10.1038/nprot.2014.047 (2014). 7 Yan, M. et al. A high-throughput quantitative approach reveals more small RNA modifications in mouse liver and their correlation with diabetes. Anal Chem 85, 12173-12181, doi:10.1021/ac4036026 (2013).
8 Zhao, B. S., Roundtree, I. A. & He, C. Post-transcriptional gene regulation by mRNA modifications. Nat Rev Mol Cell Biol 18, 31-42, doi:10.1038/nrm.2016.132 (2017).
9 Houseley, J. &Tollervey, D. The Many Pathways of RNA Degradation.Cell136, 763-776, doi:10.1016/j.cell.2009.01.019 (2009).
10 Makino, D. L., Halbach, F. & Conti, E. The RNA exosome and proteasome: common principles of degradation control. Nat Rev Mol Cell Biol 14, 654-660, doi:10.1038/nrm3657 (2013).
11 Weckwerth, W., Wenzel, K. &Fiehn, O. Process for the
integrated extraction, identification and quantification of metabolites, proteins and RNA to reveal their co-regulation in biochemical networks. Proteomics 4, 78-83, doi:10.1002/pmic.200200500 (2004).
12Crain, P. F. Preparation and enzymatic hydrolysis of DNA and RNA for mass spectrometry.Methods Enzymol 193, 782-790 (1990).
13Tsugawa, H. et al. MS-DIAL: data-independent MS/MS deconvolution for comprehensive metabolome analysis. Nat Methods 12, 523-526, doi:10.1038/nmeth.3393 (2015). 14Tsugawa, H. et al. Hydrogen Rearrangement Rules: Computational MS/MS Fragmentation and Structure Elucidation Using MS-FINDER Software. Anal Chem 88, 7946-7958, doi:10.1021/acs.analchem.6b00770 (2016). 15Zhang, Q. & Wang, Y. Differentiation of 2'-O- and 3'-O-methylated ribonucleosides by tandem mass spectrometry. J AmSocMassSpectrom17,10961099,doi:10.1016/j.jasms.2006. 04.023 (2006).
16Taylor, P. J. Matrix effects: the Achilles heel of quantitative high-performance liquid chromatography-electrospray-tandem mass spectrometry. ClinBiochem 38, 328-334, doi:10.1016/j.clinbiochem.2004.11.007 (2005).
17Alberts, B. et al. Molecular Biology of the Cell, Sixth Edition.Molecular Biology of the Cell, Sixth Edition, 1-1342 (2015).
18Schmidt, H., Siems, W., Muller, M., Dumdey, R. &Rapoport, S. M. Atp-Producing and Consuming Processes of Ehrlich Mouse Ascites Tumor-Cells in Proliferating and Resting Phases. Exp Cell Res 194, 122-127, doi:Doi 10.1016/0014- 4827(91)90140-P (1991).
19Schram, K. H. Urinary nucleosides. Mass Spectrom Rev 17, 131-251, doi:10.1002/(SICI)1098-2787(1998)17:3<131::AID-MAS1>3.0.CO;2-O (1998).
20Zauri, M. et al. CDA directs metabolism of epigenetic nucleosides revealing a therapeutic window in cancer. Nature 524, 114-118, doi:10.1038/nature14948 (2015).
21Levy, J. M. M., Towers, C. G. &Thorburn, A. Targeting autophagy in cancer. Nat Rev Cancer, doi:10.1038/nrc.2017.53 (2017).
30, 1913-1930, doi:10.1101/gad.287524.116 (2016).
23Seglen, P. O. & Gordon, P. B. 3-Methyladenine: specific inhibitor of autophagic/lysosomal protein degradation in isolated rat hepatocytes. ProcNatlAcadSci U S A 79, 1889-1892 (1982).
24Showalter, M. R., Cajka, T. &Fiehn, O. Epimetabolites: discovering metabolism beyond building and burning. CurrOpinChemBiol 36, 70-76, doi:10.1016/j.cbpa.2017.01.012 (2017).
25Vare, V. Y., Eruysal, E. R., Narendran, A., Sarachan, K. L. &Agris, P. F. Chemical and Conformational Diversity of Modified Nucleosides Affects tRNA Structure and Function. Biomolecules 7, doi:10.3390/biom7010029 (2017).