5222 FORMULATION AND OPTIMIZATION OF SUSTAINED RELEASE MATRIX
TABLET OF METFORMIN HCL 500 MG USING RESPONSE SURFACE METHODOLOGY
Raghuvanshi Neha1*, Dharashivkar Sanket1, Gaikwad Madhuri2
Department of Pharmaceutics, Dr. L.H. Hiranandani College of Pharmacy, Ulhasnagar, Maharashtra, India.
Department of Pharmaceutics, AIKTC School of Pharmacy, Panvel, Maharashtra, India.
*Corresponding author E-mail:[email protected]
ARTICLE INFO ABSTRACT
Key Words
Response surface methodology; Sustained release;
matrix tablet; Hydroxypropyl methyl
cellulose (HPMCK 100M,K15M); polyvinyl
pyrrolidone(PVP K 30)
The Aim of the current study was to design an oral sustained release matrix tablet of metformin HCl and to optimize the drug release profile using response surface methodology. Tablets were prepared by wet granulation method using HPMC K 100M as matrix forming polymer, PVP K 30 as binder. A central composite design for 2 factors at 3 levels each was employed to systematically optimize drug release profile. HPMC K 100 M (X1) and PVP K 30(X2) were taken as the in-dependent variables. The
dependent variables selected were %of drug released in 1hr (Y1), % of drug
released in 3 hrs (Y2) and %drug release in 10 hrs (Y3). Contour plots were drawn and optimum formulations were selected by feasibility and grid searches. All The polymer (HPMC K100M) and binder (PVP K 30) had
significant effect on the drug release (p<0.05). Polynomial mathematical models, generated for various response variables using multiple linear
regression analysis, were found to be statistically significant (p<0.05). Besides unraveling the effect of the 2 factors on the in vitro drug release, the study helped in finding the optimum formulation with sustained drug release.
INTRODUCTION:
Sustained-release oral delivery systems are designed to achieve therapeutically effective concentrations of drug in the systemic circulation over an extended period of time. Possible
therapeutic benefits of a properly designed SR dosage form include low cost, simple
Processing, improved efficacy, reduced adverse events, flexibility in terms of the range of release profiles attainable,
5223 increased convenience and patient
compliance1,2. Many innovative methods have been developed for obtaining modified drug release. From the practical view point, hydrophilic matrix tablet is one of the least complicated approaches for developing modified release dosage form. Hydroxy propyl methyl cellulose (HPMC) is hydrophilic cellulose ether widely used as a pH-independent gelling agent in controlled release preparation, due to their release behavior of the drug3. Due to non-toxicity, easy handling and no requirement of specified technology for production of sustained release tablets, HPMC is often used as release retarding materials 4. The transport phenomena involved in the drug release from hydrophilic matrices are complex because the microstructure and macrostructure of HPMC exposed to water is strongly time dependent. Upon contact with the gastrointestinal fluid, HPMC swells, gels, and finally dissolves slowly5. The gel becomes a viscous layer acting as a protective barrier to both the influx of water and the efflux of the drug in solution. The dissolution can be diffusion controlled depending on the molecular weight and thickness of the diffusion boundary layer. In the development of a sustained release tablet dosage form, an important issue is to design an optimized formulation with an appropriate dissolution rate in a short time period and minimum number of trials. Many statistical experimental designs have been recognized as useful techniques to optimize the process variables. For this purpose, a computer based optimization technique with a response surface methodology (RSM) utilizing a polynomial equation has been widely used 6-11. Different types of RSM designs include 3-level factorial design, central composite design (CCD), Box-Behnken design and D-optimal design. Response surface methodology (RSM) is used when only a few significant factors are
involved in optimization. The technique requires minimum experimentation and time, thus proving to be far more effective and cost-effective than the conventional methods of formulating sustained release dosage forms. Metformin HCL, the only available biguanide, remains the first line drug therapy for patients with Type 2 diabetes mellitus (T2DM), acts by decreasing hepatic glucose output and peripheral insulin resistance12. The advantages of metformin are a very low risk of hypoglycaemia, weight neutrality and reduced risk of cardiovascular morbidity and mortality13. It is an oral anti-hyperglycemic agent, shows incomplete absorption from the gastrointestinal tract and the absolute bioavailability is 50 –60 % with relatively short plasma half-life of 1.5 -4.5 h 14,15. An obstacle to more successful use of metformin therapy is the high incidence of concomitant gastrointestinal symptoms, such as abdominal discomfort, nausea, and diarrhea, that especially occur during the initial weeks of treatment 16.Side effects and the need for administration two or three times per day when larger doses are required can decrease patient compliance. A sustained-release (SR) formulation that would maintain plasma levels of the drug for 10 to 16 hours might be sufficient for once-daily dosing of metformin. SR products are needed for metformin to prolong its duration of action and to improve patient compliance. The overall objective of this study was to develop matrix sustained-release tablets of metformin using HPMC K 100M by wet granulation method and optimize the formulation using RSM.
MATERIALS AND METHODS Materials
5224 Magnesium stearate, Microcrystalline
cellulose (MCC) and PVP K 30 (polyvinyl pyrrolidone K 30) were purchased from S. D. Fine Chem. Labs, (Mumbai, India) and Aerosil 200 were procured from Sai Mirra Inno Pharma, Chennai. All other chemicals/reagents used were of analytical grade.
Preparation of Sustained Release Matrix Tablets: Sustained release Matrix tablet of drug were prepared by wet granulation technique. Table 1 enlists the composition of different trial formulations prepared using varying amounts of HPMCK 100M as release controlling polymer and PVP K 30 as binder along with fixed quantity of aerosil and magnesium stearate as lubricant and glidant . MCC was used as filler. High shear granulation (RMG) was chosen as method of granulation. Dry mix metformin HCl and MCC in RMG for 10 min at low speed 70RPM. Binder solution was prepared by adding Povidone K-30 in water to get a clear solution. The blend of drug and the excipients was wet granulated with binder solution at high speed 140 RPM for 1 min and the granules were dried in FBD at
temperature 60oC and airflow 40 with residual moisture content of 1-1.5 % w/w. The granules are then passed through a sieve 16 mesh to get uniform granules. Load sized granules in an octagonal blender with presifted HPMC, and aerosil mix for 5 min at 18 rpm. After completion of blending add sifted Magnesium stearate in an octagonal blender and lubricated for 5 min at 18 rpm. Granules thus obtained were compressed into 850 mg tablets to average hardness of 150-200 N on an sixteen station rotary tablet machine (CIP Machineries Pvt. Ltd., Ah-medabad, India) with 16 x 8 mm caplet tooling with rotational speed of 72 rpm. Prior to compression, granules were evaluated for their flow and compressibility characteristics
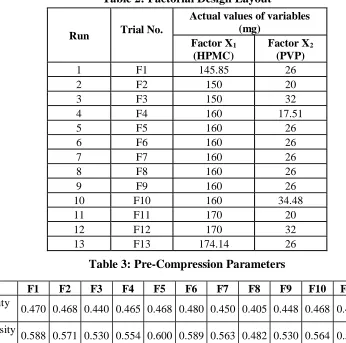
Experimental Design: A central composite design (CCD) was employed as per the standard protocol. The amounts of HPMC K 15M (X1 ) and PVP K 30 (X2) were selected as the factors, studied at 3 levels each. The central point (0, 0) was studied in quintuplicate. All other formulation and processing variables were kept invariant throughout the study. Table 2 summarizes an account of the 13 experimental runs studied,
their factor combinations. % of drug
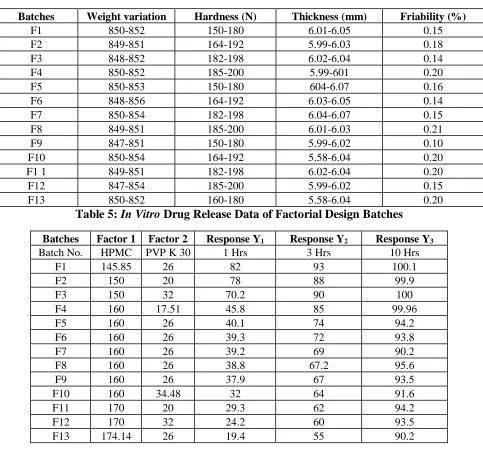
released in 1 hr (Y1), %of drug released in 3 hrs (Y2) and % of drug released in 10 h ( (Y3) were taken as the response variables. Characterization of granules: The pre-compression parameters of the granules were evaluated before compression of tablet. Precompression parameters such as angle of repose, bulk density, tapped density, Carr’s index, and Hausner’s ratio were determined for their micromeritic properties
Evaluation of tablets: The prepared matrix tablets were characterized immediately after preparation for hardness, weight variation, thickness, friability and drug content 14,15. The weight variation of the tablets was carried out with 20 tablets using an electronic balance (Shimadzu, Japan). Friability was determined using 10 tablets in a Roche friabilator (Pharma Lab, Ahmadabad,India) for 4 minutes at of 25 rpm. For each formulation, the hardness of 10 tablets was also evaluated using a Monsanto hardness tester (Campbell Electronics, India). The thickness of the each 10 tablets was measured with a Vernier Caliper
5225 pH 6.8 for 1, 3 and 10 hours hrs. 5 ml of
aliquot were withdrawn at 1, 3 and 10hrs with replacement of fresh media. Solution samples were analyzed by UV method. Data analysis and validation of optimization model for matrix tablet: Various response surface methodology (RSM) computations for the current optimization study were performed employing Design Expert software (Design Expert 9.0.1).Polynomial models including interaction and quadratic terms were generated for all the response variables using multiple linear regression analysis (MLRA) approach. The general form of the MLRA model is represented as the following equation:
Y = β0 + β1X1 +β2X2 +β3X1X2 +β4X12 + β5X22 + β6X12X2+ β7X1X22
Here,
β0 is the intercept representing the arithmetic average of all quantitative outcomes of 13 runs
β1 to β7 are the coefficients computed from the observed experimental response values of Y
X1 and X2 are the coded levels of the independent variable.
X1, X2, X12 and X22 represent the interaction and quadratic terms.
Statistical validity of the polynomials was established on the basis of ANOVA provision in the Design expert Software. Subsequently, the feasibility and grid searches were performed to locate the composition of optimum formulations. Three-dimensional (3D) response surface plots and two dimensional (2-D) contour plots were constructed based on the model polynomial functions using Design Expert software. These plots are very useful to see interaction effects of the factors on the
responses. Seven optimum checkpoints for drug were selected by intensive grid search, performed over the entire experimental domain, to validate the chosen experimental design and polynomial equations. The formulations corresponding to these checkpoints were prepared and evaluated for various response properties.
RESULTS AND DISCUSSION
Characterization of granules: Granules of all the batches were evaluated for different parameters such as angle of repose, bulk density, tapped density, Carr’s index, and Hausner’s ratio. The results of study (Table 3) showed that granules were free flowing.
Evaluation of tablets: Compressed batches of tablets were evaluated for hardness, weight variation, thickness, friability and drug content. The results for which are shown in table 4. Average weight of tablet was 850mg, hardness was 150 to 200 N, Thickness was around 6mm and friability was below 1%.
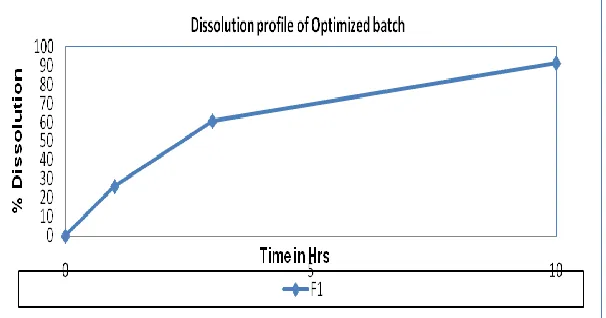
Drug Release Study: The results of dissolution studies are demonstrated in table 5.indicates that formulations F1 contains lower concentration of HPMC K100M and PVP K released 82, 93 and 100.1% of drug, after 1, 3 and 10 h respectively and formulations F13 contains higher concentration of HPMC K100M and PVP K released 29.3, 62% and 94.2 % of drug after 1,3 and 10 h respectively. The dissolution profile of metformin tablets containing combinations of a hydrophilic polymer HPMC with PVP K in the different polymer/polymer ratio are shown in fig 1. Indicates that the release rate decreased as the concentration of HPMC K100M and PVP K is increased.
5226 Y1 (Dissolution 1 Hrs.) = 39.06 – 25.84X1–
6.38X2 + 3.32X1X2 + 10.63X12 +
0.13X22….(1).
Table 1: Composition of 500 mg Metformin HCl Sustained Release Matrix Tablet
Ingredients Amount (mg) Metformin HCl 500 HPMC K 100M 145 to 175
PVP K 30 17 to 34 mg Magnesium stearate 8
Aerosil 4
MCC PH 101 QS to 850
* QS: quantity sufficient, HPMC K 100M: Hydroxypropyl methyl cellulose of K 100M viscosity grade, PVP K 30: Polyvinyl pyrrolidone of K 30 viscosity grade, MCC: Microcrystalline cellulose
Table 2: Factorial Design Layout
Table 3: Pre-Compression Parameters
F1 F2 F3 F4 F5 F6 F7 F8 F9 F10 F11 F12 F13
Bulk density
(g/ml) 0.470 0.468 0.440 0.465 0.468 0.480 0.450 0.405 0.448 0.468 0.468 0.490 0.468 Tapped density
(g/ml) 0.588 0.571 0.530 0.554 0.600 0.589 0.563 0.482 0.530 0.564 0.557 0.576 0.544 Compressibility
index (%) 20.000 18.000 17.000 16.000 22.000 18.500 20.000 16.000 15.500 17.000 16.000 15.000 14.000 Hausner’s
Ratio 1.250 1.220 1.205 1.190 1.282 1.227 1.250 1.190 1.183 1.205 1.190 1.176 1.163 Angle of
Repose 32.34 28.52 24.05 20.07 33.34 28.52 26.11 22.96 21.55 22.28 25.18 24.05 24.8 Run Trial No.
Actual values of variables (mg)
Factor X1 (HPMC)
Factor X2 (PVP)
1 F1 145.85 26
2 F2 150 20
3 F3 150 32
4 F4 160 17.51
5 F5 160 26
6 F6 160 26
7 F7 160 26
8 F8 160 26
9 F9 160 26
10 F10 160 34.48
11 F11 170 20
12 F12 170 32
5227 Table 4: Post-Compression Parameters
Batches Weight variation Hardness (N) Thickness (mm) Friability (%)
F1 850-852 150-180 6.01-6.05 0.15
F2 849-851 164-192 5.99-6.03 0.18
F3 848-852 182-198 6.02-6.04 0.14
F4 850-852 185-200 5.99-601 0.20
F5 850-853 150-180 604-6.07 0.16
F6 848-856 164-192 6.03-6.05 0.14
F7 850-854 182-198 6.04-6.07 0.15
F8 849-851 185-200 6.01-6.03 0.21
F9 847-851 150-180 5.99-6.02 0.10
F10 850-854 164-192 5.58-6.04 0.20
F1 1 849-851 182-198 6.02-6.04 0.20
F12 847-854 185-200 5.99-6.02 0.15
F13 850-852 160-180 5.58-6.04 0.20
Table 5: In Vitro Drug Release Data of Factorial Design Batches Batches Factor 1 Factor 2 Response Y1 Response Y2 Response Y3
Batch No. HPMC PVP K 30 1 Hrs 3 Hrs 10 Hrs
F1 145.85 26 82 93 100.1
F2 150 20 78 88 99.9
F3 150 32 70.2 90 100
F4 160 17.51 45.8 85 99.96
F5 160 26 40.1 74 94.2
F6 160 26 39.3 72 93.8
F7 160 26 39.2 69 90.2
F8 160 26 38.8 67.2 95.6
F9 160 26 37.9 67 93.5
F10 160 34.48 32 64 91.6
F11 170 20 29.3 62 94.2
F12 170 32 24.2 60 93.5
5228 Fig.1: In Vitro Drug Release comparison of Factorial Design Batches
Table 6: Analysis of Variance (ANOVA) for All Three Responses
*X1: HPMC K 100M, X2: PVP K 30
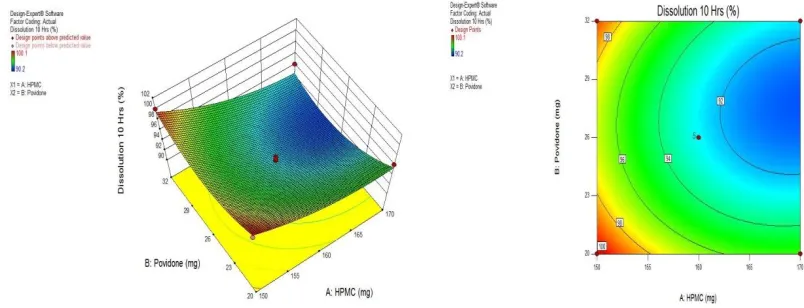
Table 7. Selected of Goal for Optimum Formulation.
A:HPMC Range 150-170
B:Povidone Range 20-32
Dissolution 1 Hrs is in range 20-40
Dissolution 03 Hrs is in range 45-65
Dissolution 10 Hrs minimize NLT 85
Table 8. Suggested Batches by the Software as Optimized Batch.
Number HPMC Povidone Dissolution 1 Hrs
Dissolution 03 Hrs
Dissolution 10 Hrs
Desirability
G1 170.000 27.622 26.971 60.395 91.038 0.600 Selected G2 169.998 27.694 27.045 60.410 91.038 0.600
Release in 1 Hr Release in 3 Hrs Release in 10 Hrs Source F Value p-value F Value p-value F Value p-value
Model 99.35 0.0001 10.93 0.0033 10.69 0.0036 X1 407.66 0.0001 22.84 0.0020 25.67 0.0015 X2 24.89 0.0016 3.24 0.1148 3.02 0.1256 X1X2 3.38 0.1088
1.714E-003
0.9681 0.41 0.5424
X12 59.96 0.0001 15.89 0.0053 6.00 0.0442 X22
8.464E-003
5229 Fig 2: Two dimensional contour plot (a); three dimensional (3D) response surface plots for
Y1 (% drug release in 1 Hr (b)
Fig 3. Two dimensional contour plot (a); three dimensional (3D) response surface plots for Y2 (% drug release in 3 Hrs (b)
5230 Fig 5: Overlay Plot from Software for Maximum Desirability.
Fig 5(a): Dissolution Profile of G1
Y2 (Dissolution 3 Hrs.) = 62.16 – 12.24X1– 4.61X2 –0.15X1X2 + 10.95X12 + 11.13X22…. (2) Y3 (Dissolution 10 Hrs.) = 92.66 – 2.94X1– 1.01X2 – 0.52X1X2 + 1.52X12 + 2.84X22…. (3). for estimation of significance of the model, the analysis of variance (ANOVA) was determined as per the provision of Design Expert Software
(Table 6). Using 5% significance level, a model is considered significant if the p value (significance probability value) is less than 0.05. From the p values presented in Table , it can be concluded that for all responses, the cross-product contribution(X1X2)and quadratic contributions (X22, X2) of the
model was not significant but the linear contribution(X1, X12 ) for all responses is
significant (p<0.05).
5231 CONCLUSION
Sustain release matrix tablets were prepared by wet granulation method using hydrophilic polymers like HPMC and PVP K 30 as binder. After application of central composite design (CCD) optimization technique, it was found that the concentration of HPMC K 100M and PVP K 30 had significant effect on dependent variables like % drug release in 1, 3 and 10 hours. The optimized batch was taken as G1 as it showed desirable drug release profile. Result from experiment data demonstrated the successful development of sustained release matrix tablet using HPMC K 100 M and PVP K 30. Both the polymer and binder plays major role for the sustained release of drug. In-vitro study showed sustained release of drug, which reduce the frequency of administration and decrease the dose-dependent side effects associated with repeated administration of conventional tablets.
REFERENCES
1. F.W.Merkus,Controlled and rate-controlled drug delivery; principal characteristics, possibilities and limitations, In Struyker-Boudier, H.A.(eds) , Rate-Controlled Drug Administration and Action, CRC Press, Boca Raton, FL, USA,(1986) 15-47
2. Colombo, P.S. Bettini, N.A. Peppas, Swellable matrixes for controlled drug delivery: gel-layer behavior, mechanisms and optimal performance, Pharm. Sci. Technol. Today. 3 (2000) 198-204
3. D.A. Alderman, A review of cellulose ethers in hydrophilic matrices of oral controlled release dosage forms, Int. J. Pharm. 5(1984)1-9
4. Yan, H. Li, R. Zhang, D. Ding, Preparation and evaluation of a sustained release formulation of Nifedipine HPMC tablets, Drug Dev. Ind. Pharm.26 (2000) 681-686.
5. Siepmann, H.Kranz , R.Bodmeier , N.A. Peppas , HPMC-matrices for controlled drug delivery: a new model combining diffusion, swelling, and dissolution mechanisms and predicting the release kinetics, Pharm Res. 16(1999)1748-1756.
6. Dave. Amin, Patel. Gastroretentive drug delivery system of ranitidine hydrochloride: formulation and invitro evaluation. AAPS Pharm. Sci. Tech.,5(2004) 3
7. Singh B., Kumar R., Ahuja N.,Optimizing drug delivery system using systematic “design of experiment’.Part 1:Fundamental aspects.Crit. Rev. Ther Drug Carrier Syst. (2005).,22,27-105 8. Singh B., Dahiya M., Saharan V.,
Ahuja N. Optimizing drug delivery system using systematic “design of experiment’.Part 2: Retrospect and prospects.,Crit. Rev. Ther. Drug Carrier Syst. (2005).,22,215-293 9. Singh., Mehta.Design,development
and optimization of nimesulide-loaded liposomal system for topical application.,Curr. Drug Deliv.,2, (2005).143-153
10. Aberturas M. R., Molpeceres J., Guzman M.,Garcia F.Development of a new cyclosporine formulation based on poly, (caprolactone) microspheresJ. Microencapsul., (2002). 19,61-72
5232 Delivery Sys-tems,'' eds. by Jain N.
K., New Delhi, 2004.
12. Nathan , Buse , M.B.Davidson , E. Ferrannini , Holman R.R, R. Sherwin, Medical management of hyperglycemia in type 2 diabetes: a consensus algorithm for the initiation and adjustment of therapy: a consensus statement of the American Diabetes Association and the European Association for the Study of Diabetes, Diabetes Care .32(2009) 193−203.
13. Holman, 10-year followup of intensive glucose control in type 2 diabetes, N. Engl. J. Med.359 (2008)1577−1589.
14. Dunn, D.H.Peters, Metformin: A review of its pharmacological properties and therapeutic use in non- insulin-dependent diabetes mellitus, Drugs. 49(1995)721-749. 15. Defang, N. Shufang, In vitro and in
vivo evaluation of two extended Release preparations of combination metformin and glipizide, Drug Dev. Ind. Pharm .31(2005) 677–685