w w w . a a s s j o u r n a l . c o m ISSN (Online): 2322 – 4479 ISSN (Print): 2476–4981
Original Article
www.AESAsport.com Received: 15/12/2016 Accepted: 07/02/2017
Relationship between Training-Induced Changes in the Star
Excursion Balance Test and the Y Balance Test in Young
Male Athletes
1
Vahid Mohammadi
*,
2Roger Hilfiker,
3Amir Ali Jafarnezhadgero,
4Shima Jamialahmadi,
5
Mohammad Karimizadeh Ardakani,
6Urs Granacher
1Department of Health and Sport Medicine, Faculty of Sport Science, Kharazmi University, Tehran, Iran. 2School of
Health Sciences, University of Applied Sciences and Arts Western Switzerland (HES-SO Valais-Wallis), Leukerbad, Switzerland. 3Department of Physical Education and Sport Science, Faculty of Education and Psychology, University of Mohaghegh Ardabili, Ardabil, Iran. 4School of Medicine, Mashhad University of Medical Sciences, Mashhad, Iran. 5
Department of Sport Injuries, Faculty of Physical Education and Sport Science, University of Tehran, Tehran, Iran. 6Division of Training and Movement Sciences, Research Focus Cognition Sciences, University of Potsdam, Potsdam,
Germany.
ABSTRACT
Background. Dynamic balance is often assessed in athletes using either the Star Excursion Balance Test (SEBT) or the Y Balance Test (YBT). There is evidence that the results for the three common directions are not comparable. Thus, the question is open to debate as to which instrument is better suited to measure training-induced changes over time. Objectives. The aim of this study is to compare the changes in the SEBT and the YBT, measured before and after six weeks of balance and strength exercise programmes in young and healthy athletes. Methods. A total of 30 young male athletes aged 15–17 years participated in this study and were involved in a six-week combined training, including balance and strength exercise. During pre- and post-training periods, the SEBT and YBT were conducted in random order. Results. The comparison between the changes in the SEBT and YBT with a paired sample T-test showed a significant increase in PM (p=0.001) and PL reach directions (p=0.000). No differences were observed in the A reach direction (p=0.38). Conclusion. the responsiveness levels of the SEBT and YBT are similar is valid. Also, because of higher effect size value in the anterior direction in YBT compared with SEBT, this balance test could possibly be preferred in this direction for postural control evaluation.
KEY WORDS:Exercise, Postural Control, Balance Tests.
INTRODUCTION
Measuring postural control is important for the assessment of injury and risk in falling in different populations (e.g. children, athletes, and seniors) (1). Postural control maintenance in static conditions or during activities needs general muscle force, involving the complex
interactions of the neuromuscular system (2). Generally, balance is classified in three forms— static, semi dynamic, and dynamic balance (3). Dynamic postural control can be defined as the ability to perform a task while maintaining a stable position. It most often involves the
performance of a functional task without compromising one’s base of support (4). Assessment of dynamic postural control has the advantage of including additional demands of proprioception, range of motion (ROM), and strength, along with the ability to remain upright and steady (1). Researchers used various methods to evaluate balance. Generally, balance tests are divided into two categories: 1) functional balance tasks like basic skills and sports activities and 2) non-functional balance tasks that are not similar to daily activities or athletic skills. Functional tests of dynamic balance are often tasks that assess the ability to maintain balance while walking, jogging, or doing tasks with the maximum possible speed (5). Methods of measuring the dynamic balance include Berg Balance Scale (BBS), step test (ST), functional reach (FR), Timed Up and Go Test (TUG), Star Excursion Balance Test (SEBT), and Y Balance Test (YBT). In athletes, the SEBT was used in numerous studies for the assessment of dynamic balance. The SEBT challenges the athlete’s postural control system (6-9). An individual is required to move from the starting position of a two-legged stance to a single-legged stance while maximally reaching along a set of multidirectional lines with the opposite leg and lightly touching down on a tape with the distal end of the reach foot. These reaching tasks are designed to challenge postural control, strength, range of motion, and proprioceptive abilities (10). High intra-rater reliability of measurements with the SEBT was found by Kinzey and Armstrong [ICC (2, 1): 0.67–0.87)] (11) and Hertel et al. [ICC (2, 1):
0.81–0.96] (5). In the SEBT, good
neuromuscular control and strength in
surrounding musculature are important for an optimal joint positioning throughout the test. The stance requires ankle-dorsiflexion, knee-flexion, and hip-flexion range of motion, as well as
adequate strength, proprioception, and
neuromuscular control, to perform these
reaching tasks (9). The SEBT may offer a simple, reliable, and valid low-cost alternative to the more sophisticated instrumented methods that are currently available (1). The SEBT is a test of dynamic stability that may provide a more accurate assessment of lower extremity function compared to tests involving only quiet standing
(e.g. one-legged stance). The goal of the SEBT is to reach as far as possible with one leg in each of the eight prescribed directions while maintaining balance on the contralateral leg. The YBT—a validated and reliable derivation of the SEBT—has been used to screen individuals with dynamic balance disorders (12). The reliability
of this test has been shown to be veryhigh (13,
14). The reliability of YBT (calculated using the intra-class correlation coefficients) ranged from 0.67 to 0.87 (15). Each subject performs YBT in
three different directions—Anterior (A),
Posteromedial (PM), and Posterolateral (PL). During YBT, the subjects stand on one leg in the centre of the foot plate. Then, while maintaining the single-legged stance, the subjects reach out with their free limb. This procedure is repeated for each of the three directions (16). Poor performance on the YBT is associated with elevated risk of non-contact lower extremity
injury. Other researchers have reported
decreased dynamic balance in patients with a history of chronic ankle instability or with ACL deficiency. Additionally, it is reported that dynamic balance can be modified with
neuromuscular training programmes (17),
suggesting that it may be possible to mitigate the elevated injury risk identified with the YBT (12). Some authors have compared the SEBT with the YBT and have consistently found that there are systematic differences in the measurements between the two tests. (10, 18). However, no study has compared the ability of the two tests to measure training-induced changes following a
combined balance and strength-training
programme. The knowledge about their
responsiveness would be important in the decision of which tool to use for an evaluation of an injury prevention programme in athletes, for example. Therefore, the purpose of this study is to compare the changes in the SEBT and the YBT, measured before and after a six-week balance and strength exercise programme in young and healthy athletes.
MATERIALS AND METHODS
Design. This study is an observational pre-post design with a six-week intervention period. The study has been approved by the research council of the faculty of physical education and sport sciences (University of Tehran) and
informed consent forms have been obtained from all participants.
Participants. A total of 30 young male athletes (with average weight of 60.54 ± 3.41 kg and height of 168.1 ± 37 cm) from local schools volunteered to participate in this study. The inclusion criteria for this study include age range between 15 and 17 years, active participation in sporting activities three or more times per week, and good health (without any history of lower extremity injury or vestibular and visual problems in the past three months and neurological or balance disorders). Before formal testing began, each participant went through an information leaflet and signed a consent form. All parts of this study were carried out based on the Helsinki Declaration (19).
Balance tests. We used the SEBT (with inter- and intra-observer reliabilities of about 0.83 and 0.81 respectively (5)) and YBT (with inter- and intra-observer reliabilities of about 0.85 and 0.82 respectively (13–15)) in three directions (A, PM, and PL) to evaluate the dynamic balance before and after a balance and strength exercise programme. In order to ensure relationship between the SEBT and the YBT, the A, PM, and PL directions were used.
The limb length of subjects in supine position (anterior superior iliac spine to the centre of the ipsilateral medial malleolus) was measured. Before starting the two tests, we determined the preferred or dominant limb of the subjects. Preferred limb was determined by kicking-the-ball test (20). If the right lower extremity was the preferred limb, the test was performed counter-clockwise; it was performed clockwise if the left lower extremity was the preferred limb (21, 22). The YBT consists of a stance platform to which three pipe pieces are attached in the A, PM, and PL directions. The posterior pipes were positioned 135° from the A pipe, with 45° between posterior pipes. Each pipe was marked with 5 mm increments for measurement (23). Standing on their preferred limb (single-leg) on the plateau where the three directions meet, the subjects moved the indicators with the other leg in a direction selected randomly by the examiner, without moving the stance leg from the plateau, using the reach foot as support, or falling down. After the subject returned to the initial position on both legs, the distance to
which they moved the indicator was recorded (24). All testing was conducted barefoot to eliminate additional balance and stability variability from shoes (10). Reach distance for two tests was measured in each direction from the most distal aspect of the toes of the stance foot to the most distal aspect of the reach foot. The greatest reach distance of three trials for each direction was used for the further analysis. The test sessions were undertaken at the same time of day to minimize diurnal variation in postural stability (25). A trial was omitted if the participant removed his hands from his hips, did not return to the starting position, applied sufficient weight through the reach foot so as to gain an increase in reach distance (SEBT), placed the reach foot on the ground on either side of the line or the tube, raised or moved the stance foot during the test, or kicked the plate with the reach foot to gain more distance (YBT). Reach distances were normalized to lower limb length (12).
Exercise protocol. Combined exercise included balance and strength exercises. Each tra
ining session involved 15 minutes
of balance exercises and 15 minutes of strength
training. Rest time durations of 30–
45 second between each set and two
minutes between each exercise were chosen (26, 27). The strength exercise protocol consisted of three sessions per week for six weeks. This protocol includes: squatting, leg extension, calf raise, lunge, and curl up (26, 27). The training started with Delorme's programme using 10RM and the weight was increased by 5% every week (28). Balance training consisted of nine basic exercises on and off the balance board, with variations on each exercise. Exercises were divided into three subcategories: (1) exercises with a ball only; (2) exercises with a balance board only; and (3) exercises with a ball and a balance board. The higher the exercise number, the more difficult was the exercise session, as variations make the basic exercises more challenging (29). Once an exercise was carried out, it could not be chosen again during the next week.
Statistical Analysis. Reach distances were normalized to limb length by calculating the maximized reach distance (%MAXD) using the
formula (excursion distance/limb length) × 100 =
% MAXD (30).
First, the normality of the variable
distributions was verified using Shapiro-Wilk test. We then calculated change from baseline to the end of the six-week treatment period (post– pre). Paired-samples T-tests were conducted to compare the change of reach distances for
preferred limb between tests. Pearson
correlations and Bland–Altman assessment for agreement were used to compare SEBT and YBT performances (31).
The significance level was considered to be at p < 0.05 for all analyses. Statistical analysis was performed using SPSS16 and Stata, version 14.1.
RESULTS
The reach distances of three directions were higher for the SEBT compared to the YBT at baseline. The correlation values were high (between 0.88 and 0.92) (Table 1). The values
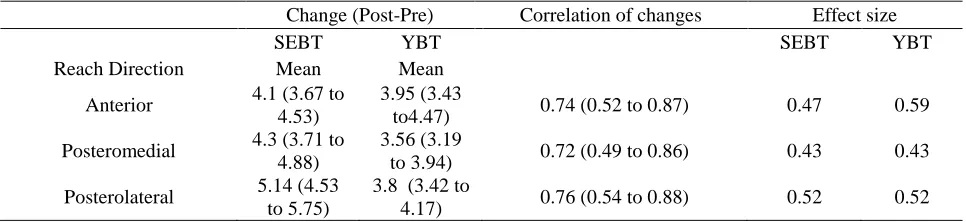
for SEBT and YBT improved over the six-week training period, with changes from 4.1 (% limb length) for the A direction and 5.1 for the PL direction. The comparison between the changes in the SEBT and YBT with a paired sample T-test showed significant differences in PM (p=0.001) and PL reach directions (p=0.000). No differences were noted in the A reach directions (p=0.38). The effect sizes were moderate, ranging from 0.43 to 0.52. The correlations between the changes were large, ranging between 0.72 and 0.76 (Table 2). Percentage change values for the A, PM, and PL directions in SEBT were 4%, 5%, and 5% respectively. Also, percentage change values for the three directions in YBT were 4%.
The Bland–Altman plot revealed limits of agreement for the A direction from −1.69 to 2.01 (Figure 1). Also, for the PM direction ranged from −1.4 to 2.87 and the PL reach from −0.79 to 3.48 (Figure 2).
Table 1. The reach distances at baseline for SEBT and YBT and their Pearson correlation coefficients. Baseline (Pre)
SEBT YBT Correlation
Reach Direction Mean (SD) Mean (SD) r (95% CI)
Anterior 94.53 (9.03) 91.6 (6.95) 0.88 (0.76 to 0.94)
Posteromedial 90.76 (10.01) 87.76 (8.34) 0.92 (0.84 to 0.96)
Posterolateral 92.77 (10) 88.93 (7.35) 0.91 (0.81 to 0.96)
Notes: SD and CI stand for standard deviation and confidence interval respectively.
Table 2. The change of reach distances for SEBT and YBT before and after exercise and their Pearson correlation coefficients.
Change (Post-Pre) Correlation of changes Effect size
SEBT YBT SEBT YBT
Reach Direction Mean Mean
Anterior 4.1 (3.67 to
4.53)
3.95 (3.43
to4.47) 0.74 (0.52 to 0.87) 0.47 0.59
Posteromedial 4.3 (3.71 to 4.88)
3.56 (3.19
to 3.94) 0.72 (0.49 to 0.86) 0.43 0.43
Posterolateral 5.14 (4.53 to 5.75)
3.8 (3.42 to
4.17) 0.76 (0.54 to 0.88) 0.52 0.52
DISCUSSION
Based on our results, the YBT has similar responsiveness (i.e. sensitive to changes in dynamic balance) compared to the SEBT. Although the SEBT showed slightly higher
absolute changes than the YBT, the effect sizes were similar in both tests due to the smaller standard deviations of the YBT. The correlation between the changes of SEBT and YBT were large, indicating that the YBT does measure a similar but slightly different construct. Another
finding in this investigation was that young male athletes achieved longer reach distances in the directions of the SEBT compared with those of the YBT, and that the changes in the PL and
PM were significantly larger in the SEBT compared to those in the YBT; no significant
difference was found for the A direction.
Figure 1. A total of 95% limits of agreement for anterior reach with preferred leg (0.15 [−1.69 to 2.01]).
Figure 2. A total of 95% limits of agreement for (a) posteromedial reach with preferred leg (0.74 [−1.4 to 2.87]) and (b) posterolateral reach with preferred leg (1.34 [−0.79 to 3.48]).
We found smaller standard deviations in the YBT test, which led to higher effect sizes for the
YBT in the anterior direction despite the smaller changes. Coughlan et al. did not find smaller
standard deviation for the YBT (10). Therefore, we believe that our result of the smaller standard deviation should not be over-interpreted.
Previous authors have reported differences between the SEBT and the YBT reach distances. They found similar differences with higher values for the SEBT (10, 18). However, we are not aware of any other study to evaluate the differences between the SEBT and the YBT change values over time. A previous study demonstrated a postural control improvement
after a six-week neuromuscular training
programme (32). Furthermore, similar balance improvements were observed after two different balance training programmes (uniaxial and multiaxial training on a rocker board) over three weeks (33).
The results of other studies (10, 18) and our results suggest that, although the task seem to be the same on the SEBT and the YBT test at first sight, the task is somewhat more difficult on the YBT test. Coughlan et al. (10) found differences in the A direction but not in the other two directions; whereas we found significant difference in all three directions. For the change values, we found significant differences for the PM and PL directions but not for the A direction. The reason for the higher values in the SEBT might be that in the SEBT, participants stand on the floor, reach with the tip of the foot, and try to touch the ground at the farthest possible distance. YBT is slightly more difficult, probably due to the fact that the participant stands on a slightly elevated surface on a central footplate with one foot while having to push a sliding block with the other. Another reason could be that participants receive constant proprioceptive feedback throughout the reach excursion from the plantar surface of the reach foot during the YBT. In the SEBT, the participant places downward pressure through the reach foot only at the end of the reach excursion and, therefore, does not receive a similar level of afferent information throughout the movement, possibly relying on a feedforward control strategy until contact is made with the tape measure (10). The SEBT is more of a reach test whereas the YBT is more of a push task. Therefore, the movement strategy might be
different. The postural-control strategy used during the SEBT allows the participant to have more flexion on the hip and knee and also more movement on the pelvic and hip than the YBT. Hence, the same level of co-contraction of synergic muscle is not involved throughout the movement. In the YBT, individuals stand on a footplate and have to push a block. Therefore, they have a defined trajectory of the leg and controlled range of motion in the hip, knee, and other body segments in all directions.
The possible reasons for the improvement of dynamic balance after combined exercises in SEBT and YBT were the various training modalities. This variation can lead to an improvement in performance of athletes (34).
Simultaneously implementation
of strength and balance training improves the balance mechanism, which in turn could improve the athletes’ performance. Dynamic stability training could strengthen the muscles for changing direction in these tests, as well as developing functional joint motion in field sport athletes. Increase in feedback receptor lead
to reorganization of the central nervous
system and sensorimotor integration and change in response to movement (35). Other reasons could be: stimulation of proprioception sense,
preparation of motor neurons in group
of muscles and joints to implement the task, increasing coordination and integration of motor units, concentration of synergic muscle, and the process of increase in inhibiting antagonist muscle.
This study has a few limitations that must be considered. The effect size is dependent on the effectiveness of the intervention and, therefore, does not reflect an inherent property of the SEBT and the YBT. However, this limitation does not preclude the comparison of the SRM within one study. Therefore, the conclusion that the responsiveness levels of the SEBT and YBT are similar is valid.
CONCLUSION
A difference in changes of PM and PL reach-directions distance was observed between the SEBT and YBT, with no differences noted
in the A direction. The movement strategies used in completing the tests appears to influence reach performance. There is a large correlation between the results in the SEBT and the YBT. The results for the SEBT are slightly higher than those for the YBT. Further research on the movement strategies and kinematic demands associated with these tests may indicate which test may be best used in different conditions.
REFERENCES
1. Gribble PA, Hertel J. Considerations for normalizing measures of the Star Excursion Balance Test. Measurement in physical education and exercise science. 2003;7(2):89-100.
2. Gribble PA, Hertel J, Denegar CR, Buckley WE. The effects of fatigue and chronic ankle instability on dynamic postural control. Journal of Athletic Training. 2004;39(4):321.
3. Marsh DW, Richard LA, WILLIAMS LA, Lynch KJ. The relationship between balance and pitching error in college baseball pitchers. The Journal of Strength & Conditioning Research. 2004;18(3):441-6.
4. Zech A, Hübscher M, Vogt L, Banzer W, Hänsel F, Pfeifer K. Balance training for neuromuscular control and performance enhancement: a systematic review. Journal of athletic training. 2010;45(4):392-403.
5. Hertel J, Miller SJ, Denegar CR. Intratester and intertester reliability during the Star Excursion Balance Tests. JSR. 2010;9(2).
6. Earl JE, Hertel J. Lower-extremity muscle activation during the Star Excursion Balance Tests. Journal of Sport Rehabilitation. 2001;10(2):93-104.
7. Gray GW. Lower extremity functional profile: Wynn Marketing, Incorporated; 1995. 8. Miller SJ. A Biomechanical Analysis of the Anterior Balance Reach Test2001.
9. Olmsted LC, Carcia CR, Hertel J, Shultz SJ. Efficacy of the star excursion balance tests in detecting reach deficits in subjects with chronic ankle instability. Journal of athletic training. 2002;37(4):501.
10. Coughlan GF, Fullam K, Delahunt E, Gissane C, Caulfield BM. A comparison between performance on selected directions of the star excursion balance test and the Y balance test. Journal of athletic training. 2012;47(4):366. 11. Kinzey SJ, Armstrong CW. The reliability of the star-excursion test in assessing dynamic balance. Journal of
Orthopaedic & Sports Physical Therapy. 1998;27(5):356-60.
12. Gorman PP, Butler RJ, Rauh MJ, Kiesel K, Plisky PJ. Differences in dynamic balance scores in one sport versus multiple sport high school athletes. International journal of sports physical therapy. 2012;7(2).
13. Plisky PJ, Gorman PP, Butler RJ, Kiesel KB, Underwood FB, Elkins B. The reliability of an instrumented device for measuring components of the star excursion balance test. North American journal of sports physical therapy: NAJSPT. 2009;4(2):92.
14. O'Neill M. The effects of fatigue and gender on the Star Excursion Balance Test in high school athletes: University of Delaware; 2011.
15. Baltaci G, Aktas G, Camci E, Oksuz S, Yildiz S, Kalaycioglu T. The effect of prophylactic knee bracing on performance: balance, proprioception, coordination, and muscular power. Knee Surgery, Sports Traumatology, Arthroscopy. 2011;19(10):1722-8.
16. Borsa PA, Lephart SM, Fu FH. Muscular and functional performance characteristics of individuals wearing prophylactic knee braces. Journal of athletic training. 1993;28(4):336.
17. Mohammadi V, Letafatkar A, Sadeghi H, Jafarnezhadgero A, Hilfiker R. The effect of motor control training on kinetics variables of patients with non-specific low back pain and movement control impairment: prospective observational study. Journal of Bodywork and Movement Therapies. 2016.
18. Fullam K, Caulfield B, Coughlan GF, Delahunt E. Kinematic analysis of selected reach directions of the Star Excursion Balance Test compared with the Y-Balance Test. J Sport Rehabil. 2014;23(1):27-35.
19. Association GAotWM. World Medical Association Declaration of Helsinki: ethical principles for medical research involving human subjects. The Journal of the American College of Dentists. 2014;81(3):14.
APPLICABLE REMARKS
Both tests showed changes during a
six-week balance and strength exercise training. However, the changes were slightly but significantly higher in the SEBT compared to the YBT. Both tests can therefore be recommended for the evaluation of exercise programmes.
20. Farahpour N, Jafarnezhad A, Damavandi M, Bakhtiari A, Allard P. Gait ground reaction force characteristics of low back pain patients with pronated foot and able-bodied individuals with and without foot pronation. Journal of biomechanics. 2016;49(9):1705-10.
21. King MB, Judge JO, Whipple R, Wolfson L. Reliability and responsiveness of two physical performance measures examined in the context of a functional training intervention. Physical therapy. 2000;80(1):8-16. 22. Hosseini SS, Asl AK, Rostamkhany H. The effect of strength and core stabilization training on physical fitness
factors among elderly people. World Appl Sci J. 2012;16(4):479-84.
23. Nashner LM. Adaptation of human movement to altered environments. Trends in Neurosciences. 1982;5:358-61. 24. Sarvestani H, Tabrizi H, Abbasi A, Rahmanpourmoghaddam J. The Effect of Eight Weeks Aquatic Balance
Trainingand Core Stabilization Training on Dynamic Balance in Inactive Elder Males. Middle-East Journal of Scientific Research. 2012;11(3):279-86.
25. Gribble PA, Tucker WS, White PA. Time-of-day influences on static and dynamic postural control. Journal of athletic training. 2007;42(1):35.
26. Cynthia A. The effects of strength and plyometric training on joint position, joint moments and joint stiffness at the knee: Dissertation. Faculty of Brigham young university (Canada); 2004.
27. Samson KM. The effects of a five-week core stabilization-training program on dynamic balance in tennis athletes: West Virginia University; 2005.
28. Prentice WE, Kaminski TW. Rehabilitation techniques for sports medicine and athletic training: McGraw-hill New York:; 2004.
29. Bahr R, Kannus P, Van Mechelen W. Epidemiology and prevention of sports injuries. Textbook of Sports Medicine: Basic Science and Clinical Aspects of Sports Injury and Physical Activity. 2008:299-314.
30. Robinson RH, Gribble PA. Support for a reduction in the number of trials needed for the Star Excursion Balance Test. Archives of physical medicine and rehabilitation. 2008;89(2):364-70.
31. Bland JM, Altman D. Statistical methods for assessing agreement between two methods of clinical measurement. The lancet. 1986;327(8476):307-10.
32. McLeod T, Armstrong T, Miller M, Sauers JL. Balance improvements in female high school basketball players after a 6-week neuromuscular-training program. J Sport Rehabil. 2009;18(4):465-81.
33. Eisen TC, Danoff JV, Leone JE, Miller TA. The effects of multiaxial and uniaxial unstable surface balance training in college athletes. The Journal of Strength & Conditioning Research. 2010;24(7):1740-5.
34. McKeon PO, Hertel J. Systematic review of postural control and lateral ankle instability, part II: is balance training clinically effective? Journal of athletic training. 2008;43(3):305-15.
35. Mahieu NN, Witvrouw E, Van de Voorde D, Michilsens D. Improving strength and postural control in young skiers: whole-body vibration versus equivalent resistance training. Journal of athletic training. 2006;41(3):286.
![Figure 1. A total of 95% limits of agreement for anterior reach with preferred leg (0.15 [−1.69 to 2.01])](https://thumb-us.123doks.com/thumbv2/123dok_us/8742823.1746597/5.612.134.533.403.641/figure-total-limits-agreement-anterior-reach-preferred-leg.webp)
