Available Online at www.ijpret.com
508
APPLIED RESEARCH IN ENGINEERING AND
TECHNOLOGY
A PATH FOR HORIZING YOUR INNOVATIVE WORK
DETERMINATION OF RED AND WHITE BLOOD CELLS AND ANALYSIS OF
BLOOD FOR MEDICAL DIAGNOSIS USING DIGITAL IMAGE PROCESSING
PROF. S. M. AGRAWAL1 , SONAL MAHALLE2
1. Associate Professor, H. O. D. Department of Electrical Engineering.
2. M.E.(Second Year)Department of Digital Electronics ,BNCOE , Pusad.
Accepted Date: 27/02/2014 ; Published Date: 01/05/2014
p
\
Abstract: In this project, it is proposed to do the analysis of blood i.e. complete blood cell count (CBC) with the help of Digital Image Processing software. This software may determine different blood attributes; usually access the size and shape of the image. Today in this busy hectic schedule; pathologists need some help in terms of software for blood cell analysis. Thus, the idea of this project is to serve the pathologists, medical technicians for the same. The method utilizes image segmentation and counting the cells of different size. It is a novel use of Image Processing technique, which takes clean and properly stained blood cell sample image for the software.
Keywords: Digital Image Processing
Corresponding Author: PROF. S. M. AGRAWAL
Access Online On:
www.ijpret.com
How to Cite This Article:
SM Agrawal, IJPRET, 2014; Volume 2 (9): 508-517
-
Available Online at www.ijpret.com
509 INTRODUCTION
Blood carries out many vital functions as it circulates through the body. It transports oxygen from the lungs to other body tissues and carries away carbon dioxide. It carries nutrients from the digestive system to the cells of the body, and carries away wastes for excretion by the kidneys. Blood helps our body fight off infectious agents and inactivates toxins, stops bleeding through its clotting ability, and regulates our body temperature.
Doctors rely on many blood tests to diagnose and monitor diseases. Some tests measure the components of blood itself; others examine substances found in the blood to identify abnormal functioning of various organs. Hence, we here propose a software system which will assist pathologists to detect blood cell count and help to find out the diseases. This information can be very helpful to a physician who, for example, is trying to identify the cause of a patient's diseases.
In blood cell image detection, the task is usually split into two stages; one is image enhancement for the purpose of reducing noise, and the other is detection of blood cell characteristics.
In our proposed stage, image thresholding and segmentation is one part of stage and the detection in the later stage. Counts are calculated by scanning the image and using fuzzy decision device.
Also, because of cells’ complex nature, it still remains a challenging task to segment cells from its background and count them automatically. Morphological techniques and Hough transform is use for detecting features in terms of shape and size of the image. The method can not only de-noise and segment blood cell image perfectly, but also can well eliminate disturbed objects which will serious impact the blood cell counting step, and is able to segment specific isolated cell from its background.
COMPOSITION OF BLOOD
Available Online at www.ijpret.com
510
blood test
Hematology laboratories not only examine blood films, they also perform various measurements relating to the hemoglobin content of the blood, the characteristics of number of red cells, white cells and platelets. These measurements are collectively referred to as a blood count or full blood count (FBC).
Purpose of blood test
During illness, abnormalities can develop in any of the cells in the blood. The purpose of performing a blood count and examining a blood film is to detect quantitative and qualitative abnormalities in blood cells. Their detection often helps in diagnosis and in the treatment of the patient.
Existing method
A complete blood count (CBC), also known as full blood count (FBC) is a test panel requested by a doctor or other medical professional that gives information about the cells in a patient's blood. A scientist or lab technician performs the requested testing and provides the requesting medical professional with the results of the CBC.
3. DESCRIPTION OF THE METHOD
Image segmentation and extraction
In the segmentation process, morphological technique is used because the mathematical Morphology offers a powerful tool for segmenting images and useful to describe the region shape, such as boundaries, skeletons and texture. The first method in this process divides saturation, S image into two images output by applying the thresholding process. Thresholding is one of the methods to extract and segment the object from the background by selecting any point, T.
Any point (x, y) for which f (x, y) > T is called an object point; otherwise the point is called background point. Thresholding normally results in binary image and the mathematically; the operation can be expressed as;
-
Available Online at www.ijpret.com
511 0 if f(x,y)>T
where the pixels labeled 1 is corresponded to object whereas the pixels labeled 0 are
Corresponding to the background
Morphological operation
Morphology is a broad set of image processing operations that process images based on shapes. Morphological operations apply a structuring element to an input image, creating an output image of the same size. In a morphological operation, the value of each pixel in the output image is based on a comparison of the corresponding pixel in the input image with its neighbors. By choosing the size and shape of the neighborhood, you can construct a morphological operation that is sensitive to specific shapes in the input image.
The most basic morphological operations are dilation and erosion. Dilation adds pixels to the boundaries of objects in an image, while erosion removes pixels on object boundaries. The number of pixels added or removed from the objects in an image depends on the size and shape of the structuring element used to process the image. In the morphological dilation and erosion operations, the state of any given pixel in the output image is determined by applying a rule to the corresponding pixel and its neighbors in the input image. The rule used to process the pixels defines the operation as dilation or erosion. This table lists the rules for both dilation and erosion.
Rules for Dilation and Erosion
Operation Rule
Dilation The value of the output pixel is the maximum value of all the pixels
in the input pixel's neighborhood. In a binary image, if any of the pixels is set to the value 1, the output pixel is set to 1.
Erosion The value of the output pixel is the minimum value of all the pixels in
the input pixel's neighborhood. In a binary image, if any of the pixels is set to 0, the output pixel is set to 0.
Available Online at www.ijpret.com
512 The following figure illustrates this processing for a grayscale image. The figure shows the processing of a particular pixel in the input image. Note how the function applies the rule to the input pixel's neighborhood and uses the highest value of all the pixels in the neighborhood as the value of the corresponding pixel in the output image.
Morphological Dilation of a Grayscale Image
where the pixels labeled 1 is corresponded to object.
HOUGH TRANSFORM
Circle Hough Transform (CHT)
The Hough transform can be used to determine the parameters of a circle when a number of points that fall on the perimeter are known. A circle with radius R and center (a, b) can be described with the parametric equations
x = a + R cos(α)
-
Available Online at www.ijpret.com
513
When the angle α sweeps through the full 360 degree range the points (x, y) trace the
perimeter of a circle.
If an image contains many points, some of which fall on perimeters of circles, then the job of the search program is to find parameter triplets (a, b, R) to describe each circle. The fact that the parameter space is 3D makes
a direct implementation of the Hough technique more expensive in computer memory and time.
Search with fixed R
If the circles in an image are of known radius R, then the search can be reduced to 2D. The objective is to find the (a, b) coordinates of the centers.
x = a + Rcos (α)
y = b + Rsin (α)
Available Online at www.ijpret.com
514 If the radius is not known, then the locus of points in parameter space will fall on the surface of a cone. Each point (x,y) on the perimeter of a circle will produce a cone surface in parameter space. The triplet (a,b,R) will correspond to the accumulation cell where the largest number of cone surfaces intersect. The drawing at the right illustrates the generation of a conical surface in parameter space for one (x, y) point. A circle with a different radius will be constructed at each level, r.
The search for circles with unknown radius can be conducted by using a three dimensional accumulation matrix.
Example
-
Available Online at www.ijpret.com
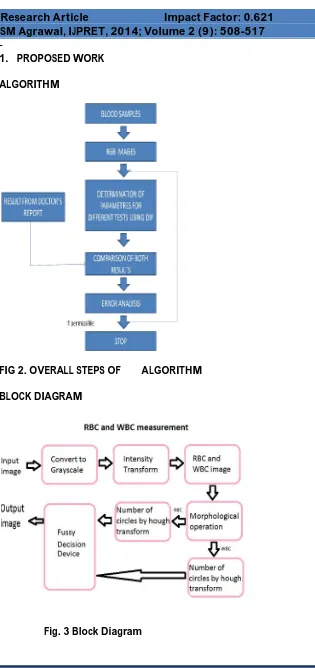
515 1. PROPOSED WORK
ALGORITHM
FIG 2. OVERALL STEPS OF ALGORITHM
BLOCK DIAGRAM
Available Online at www.ijpret.com
516 2. Segment the blood part of the image to get the actual blood portion (this would be done using Soft Thresholding)
3. Now, from this blood portion, apply morphological transforms to get the various smaller portions of the image (which would contain the corpuscles)
4. Then classify these corpuscles based on WBC and RBC to get the specified counts
5. With the help of these counts, we would make sure that the person is fine or not
CONCLUSION
This system has implemented the segmentation part and after testing this system it is concluded that, it is more timely efficient than the existing systems. It is reliable and cost effective than automated method. The aim of this system is to provide CBC i.e. complete blood Cell Count, which has been achieved by using the powerful image processing technique.
This system is more efficient in reducing the valuable time than manual system. The system is user friendly so that the pathologist can observe the blood cell sample image in different views. Also pathologist can get the result of blood cell test within minutes. as tested. Also live comparison is down, the results of this system with existing one in laboratory, so that to make the proper calculations.
Using image processing technique, it can count the number of RBC’s and platelets separately. Also it can count types of WBC’s separately.
REFERENCES
1. Dwi Anoragaingrum, “Cell Segmentation with median Filter and Mathematical morphology
Operation,” In Proc. of the IEEE 10thInternational Conference on Image Analysis and processing (ICIAP), 1999:1043-1046
2. Keng Wu etc, “Live Cell image Segmentation,” IEEE Trans On Biomedical Engineering.
1995,.42(1):1-12
3. Mark B. Jeacocke, Brian C. Lovell, “A Multi-resolution Algorithm for Cytological Image
-
Available Online at www.ijpret.com
517
4. Micheli Tzanakou, H. Sheikh, B. Zhu, “ Neural Networks and Blood Cell Identification,” J. of
Med. Systems, 1997, 21(4):201-210
5. Diaspro., A, Beltrame. F, Fato. M., Ramoino. P, “Characterizing Biostructures and Cellular
Events in 2D/3D (Using wide-field and Confcoal Optical Sectioning Microscopy),” IEEE Engineering in Medicine and Biology. EMB-M, 1996, 1/2:92-100.
6. G. Fernandez, Murat Kunt, Jean-Pierre Zryd, “A New Plant Cell Image Segmentation
Algorithm,” In Proc of the 8th Int. Conference On Image Analyze and Processing, San Remo Italy. 1995:229-224.
7. Wang Tianfu Zheng Changqiong Li Deyu. “Neural Network Based Ultrasonic Medical Image
Automatic Segmentation,” Journal of UEST of China, 1997, 26(4):366-368.
8. Zhao Zhiqin Wang Jianguo Huang Shunji. “Research on Edge Detection of SAR Image,”