http://www.sciencepublishinggroup.com/j/ajbio doi: 10.11648/j.ajbio.20180606.11
ISSN: 2330-0159 (Print); ISSN: 2330-0167 (Online)
Isolation and Characterization of Water Soluble
Polysaccharides from
Isaria cicadae
Changsheng Sun
1, Shijun Yu
2, Jiayuan Bao
2, Meizhen Fan
1, 2, *1
Zhejiang BioAsia Bio-Pharmaceutical Co., Ltd, Pinghu, China
2Anhui Provincial Key Laboratory of Microbial Control, Anhui Agriculture University, Hefei, China
Email address:
*
Corresponding author
To cite this article:
Changsheng Sun, Shijun Yu, Jiayuan Bao, Meizhen Fan. Isolation and Characterization of Water Soluble Polysaccharides from Isaria cicadae.
American Journal of BioScience. Vol. 6, No. 6, 2018, pp. 57-64. doi: 10.11648/j.ajbio.20180606.11
Received: September 13, 2018; Accepted: January 11, 2019; Published: February 26, 2019
Abstract:
Isaria cicadaeMiquel is an important medicinal food fungus. The crude polysaccharides from I. cicadae were shown to significantly extend the lifespan of fruit flies in our previous study. To understand the underlying mechanism, thecomposition and structural characterization of polysaccharides from I. cicadae were determined. A water-soluble crude
polysaccharide, obtained from a cultured Isaria cicadae by boiling-water extraction and ethanol precipitation, was fractionated
by DEAE-Sepharose column chromatography. The isolate gave four polysaccharide fractions termed B-I-1, B-I-2, B-II-1 and B-II-2. The average ratio of Glu: Man: Gla in B-I-2 was 1.28:1.25:1, B-II-1 was 16.08:1:1.95, and B-II-2, was 1:2.43:2.61. B-I-1 was composed of Ara, Xyl and Glu in the ratio of 1:2.36:33.14. GC and FTIR spectra analysis combined with NMR spectroscopic analysis gave preliminary structures of the four polysaccharide fractions, which may provide an elucidation on the action mechanisms of - polysaccharide on fruit flies proliferation.
Keywords:
Isaria cicadae, Polysaccharides, GC, FTIR Spectra, NMR Spectra1. Introduction
Isaria cicadae Miquel, (Cordycipitaceae, Hypocreales,
Sordariomycetes, Pezizomycotina, Ascomycota) [1], is one of the most valued medicinal fungi in Chinese Traditional
Medicine. It is commonly known as “Jin Chanhua” (Cicada
flower) but has also been called as “Cordyceps sobolifera” and
“Yan flower” in many medical books in China, such as
Chinese Dictionary, Xinhua materia medica and Sichuan traditional Chinese Medicine.
As a valued Chinese herb and tonic, I. cicadae has a long
history of use and a high reputation of value. One of the
earliest Chinese accounts of the use of “Isaria cicadae” was
published in Leigong Treatise on the Preparation (fifth
century), and later appeared in other famous ancient medical
books, such as Theory of Drug Property and Compendium of
Materia Medica (1590). I. cicadae has also been shown in recent studies to have multiple pharmacological effects, including immunity regulation [2-4], antitumor activity [5-7], neuroprotective and renoprotective benefits [8-9].
In a previous study, we found that crude polysaccharides
from I. cicadae extended the lifespan of female and male fruit
flies by 18.78% and 26.23% respectively. I. cicadae enhanced
the activity of SOD and reduced the MDA content in fruit flies
[10]. In this study, pure polysaccharide was isolated from I.
cicadae based on a bioassay-guided fractionation procedure, and structure of the polysaccharide was determined in order to understand the mechanisms of action of polysaccharide on fruit flies proliferation.
2. Material and Methods
2.1. Materials
Powder of Isaria cicadae was provided by Zhejiang
BioAsia Bio-Pharmaceutical Co., Ltd (China).
2.2. Chemicals and Reagents
Sweden); DEAE-cellulose (DE-52) was bought from Whatman (Maidstone, England).
The chemicals and reagents used in this study were of analytical grade, including standard sugars (Arabinose, Rhamnose, Galactose, Mannose, and Xylose), Glucose, sulfuric acid, phenol, sodium periodate, three fluorine acetic acid, sodium borohydride, anhydrous acetic anhydride, sodium hydroxide and DMSO (purchased from Shanghai Zhenqi Bioengineering Institute, Shanghai, China).
2.3. General Methods
Optical rotation was measured with a SpectraMax M2 polarimeter (Molecular Devices, USA). Gas chromatography (GC) was used for identification and quantification. GC was performed on a GC7890A-MSD5975C instrument (Agilent, USA) equipped with HP-5 MS column (30 m × 0.25 mm × 0.25 µm). The column temperature was kept at 80°C for 1 min and then first increased to 200°C at a rate of 5°C /min, then to 215°C at a rate of 2°C/min, finally reaching to 270°C at a rate of 20°C /min. Infrared (IR) spectroscopy of the samples was
recorded on a Nicolet 8700 in a range of 400–4000 cm-1. Gel
filtration chromatography was carried out on columns of DE-52 and Sephadex G-150 (Whatman, UK) using 0.5 M NaCl. The column was calibrated with T-series dextrans of known molecular weights. All gel filtration chromatography
was monitored with phenol– H2SO4 method [11].
2.4. Isolation and Purification of Polysaccharides from I. Cicadae
The powder of I. cicadae (1.0 g) was extracted with 20 ml
of distilled water at 90°C for 2 h, and repeated twice. After vacuum filtration, the aqueous extracts were combined and concentrated to one-fourth of the total volume in vacuum. The extracts were then precipitated in cold 95% (v/v) ethanol to a 75% (v/v) final concentration and incubated at 4°C for a minimum of 24 h. After centrifugation at 5000 rpm for 15 min at 4°C, ethanol was removed and the polysaccharide fraction was redissolved in distilled water. The polysaccharide solution was then treated with proteinase and kept in hot water (65°C) for 1.5 h. Seavg reagent (2-fold of polysaccharide solution) was then added into the solution followed by 30 min ultrasonic. The sample was centrifuged at 8000 rpm for 10 min at 4 °C. The supernatant was retreated in this manner at least 5 times to remove the protein fraction. The resulting aqueous fraction was precipitated again by adding threefold volume of ethanol. After centrifugation, the precipitate was washed with anhydrous ethanol and then dissolved in water and lyophilized (FreeZone12, LABCONCO, USA) to yield the crude
polysaccharide corresponding to polysaccharide of I. cacide in
the subsequent description.
The crude polysaccharide (300 mg) was dissolved in distilled water (10 ml) and the solution was centrifuged at 10000 rpm for 15 min. The supernatant was injected to DEAE-52 column (2.6 cm × 40 cm, Whatman, UK) and eluted with different concentrations of NaCl aqueous solution (0-1 mol/ml) stepwise at a flow rate of 1 ml/ min. Each fraction of 5
ml was collected and monitored by the phenol-sulfuric acid method at 490 nm. The elution profile detected by the phenol-sulfuric acid assay showed two big elution peaks namely as B-I and B-II, respectively. These two fractions were then purified by gel filtration chromatography on a Sephadex
G-150 column(2.6 cm × 40 cm, Pharmacia, USA)and eluted
with distilled water. Each fraction of 4 ml was collected at a flow rate of 0.45 ml/min and monitored by the phenol-sulfuric acid method at 490 nm using a microplate reader Spectra Max 20 (Molecular Devices, USA).
2.5. Spectrum Evaluation (FTIR Spectra)
IR spectra of the films were recorded with a Nexus-870 Spectrometer (Nicolet, USA), using the photoacoustic technique. KBr pellets containing 1% of the samples were used only to obtain the pure polysaccharide spectra.
2.6. Monosaccharide Composition and Properties
Monosaccharide composition analysis followed the method of Yu et al. (2009) [12]. A polysaccharide fraction of 5 mg was hydrolyzed with 4 ml 2M aqueous trifluoroacetic acid in a sealed tube at 110°C for 4 h. The hydrolysate was concentrated with a rotary evaporator under reduced pressure, and remaining trifluoracetic acid was removed by co-evaporating with methanol (3× 5 ml). The concentrated
hydrolysate was dried over P2O5 in vacuum overnight. The
dried hydrolysate was dissolved in 4 ml acetic acid and stirred at 100°C for 1 h. Excess acetic acid was removed by co-evaporating with toluene (3× 5 ml). The mixture was then concentrated and dried under reduced pressure. The dried residue was dissolved in 3 ml chloroform and then a minimal amount of distilled water was added. This mixture was stirred and then separated with separating funnel. Chloroform layer (10 ml) was for gas chromatography-mass spectrometry (GC-MS) analysis with a GC analyzer GC7890A-MSD5975C (Agilent, USA). The GC column was HP-5 MS with dimension of 30 m × 0.25 mm. The injector and column temperature was 250°C.
2.7. Nuclear Magnetic Resonance (NMR) Spectroscopy
The polysaccharide was dissolved in D2O at a concentration
of approximately 40 mg/mL and deuterium-exchanged 3 times
by freeze drying in D2O. Both 1H and 13C NMR spectras were
recorded on a 600 MHz Bruker INOVA 600NB NMR spectrometer (Brucker, Rheinstetten, Germany). The double quantum filtered correlated spectroscopy (DQF-COSY), heteronuclear multiple quantum coherence (HMQC), and
heteronuclear multiple-bond correlation (HMBC)
experiments were conducted at 65°C.
2.8. Statistical Analysis
3. Results and Discussion
3.1. Isolation, Purification and Composition of Polysaccharides from I. Cicadae
The crude polysaccharide was isolated from the hot-water
extract of I. cicadae. After fractionation on DEAE-cellulose
(DE-52) column, B-I (70.86%) and B-II (29.14%) were obtained from the NaCl eluate. The two fractions were purified by gel chromatography on a Sephadex G-150 column, respectively, and showed two symmetrical peak in both B-I and B-II fractions. B-I-1 and B-I-2 were separated from the B-I fraction whileB-II-1 and B-II-2 were obtained from the B-II fraction. The four fractions were repurified on Sphadex G-150 column, respectively, and showed a single peak indicating no other polysaccharide was present in the sample. We concluded that B-I-1 and B-II-1 were homogeneous and the same as B-I-2 and B-II-2 by the following tests. They were all eluted as a single peak from gel-filtration chromatography on a Sephadex G-150 column which was equilibrated in 0.9% sodium chloride. The average molecular weight of B-I-1 and B-II-1 were 108.70 and 114.40 KDa on Sephadex G-150, and B-I-2 and B-II-2 were 43.75 and 49.46 KDa.
The average ratio of Glu: Man: Gla in B-I-2 was 1.28:1.25:1, of B-II-1, 16.08:1:1.95, and of B-II-2, 1:2.43:2.61, while B-I-1 was constituted by Ara, Xyl and Glu in the ratio of 1:2.36:33.14 (Table 1, Figure 1). Mannose and galactose accounted a large ratio in B-I-2 and B-II-2 fractions, which
was consistent with reports on polysaccharides from natural C.
cicadae [13-14]. This indicates that the compositions in
polysaccharides are similar between cultured I. cicadae and
natural C. cicadae.
Table 1. Components of monosaccharides and properties of fractions from Isaria cicadae.
Samples B-I-1 B-I-2 B-II-1 B-II-2
Average molecular weights (KDa) 108.70 43.75 114.40 49.46 Sugar component (mol)
D-Ara 1
D-Xyl 2.36
D-Glu 33.14 1.28 16.08 1
D-Man 1.25 1 2.43
D-Gal 1 1.95 2.61
D-Ara, D-arabinose; D-Xyl, D-xylose; D-Glu, D-glucose; D-Man,
D-mannose; D-Gal, D-galactose.
3.2. FTIR Spectra of Four Polysaccharide Fractions
FTIR spectra of B-I-1, B-I-2, B-II-1 and B-II-2 fractions were drawn and the maximum of the absorption band due to hydroxyl
groups (4000-400 cm-1) were measured (Figure 2). The hydroxyl
groups self-associated by hydrogen bonds give a strong and
broad band, with the center of gravity within 3500-3200 cm-1 in
all the four polysaccharide fractions. However, it was difficult to find a reasonable correlation between these intense OH stretching modes and vibrational state, due to the complicated network of inter- and intra-molecular hydrogen bonds occurring in the polysaccharide structure.
A second group of bands with moderate intensity in IR
spectra was found within 3000-1800 cm-1. These were due to
the CH and CH2 symmetrical and anti-symmetrical stretching
vibrations [15]. Another distinct band, which was recorded at
about 1646 cm-1, was attributed to C=O stretching, and
appeared related to the vibrations of bound water molecules
[16]. One band at 1540 cm-1 was affected by N-H vibrations,
indicating some minimum amount protein was still bound with the polysaccharides in B-II-1 and B-II-2 fractions.
Several bands observed in the range 1450-1220 cm-1
overlapped with the CH and CH2 in-plane bending and wagging
vibrations, and to the C-OH deformation modes. Between
1200-1000 cm-1 bands were influenced to various extents by
other vibrations, such as –OH stretching and anomeric skeleton. Heyn (1974) reported that glycogen exhibited two distinct and
well resolved infrared bands in the region 1050 to 970 cm-1 [17],
while starch showed only one broad band. Galat (1980)
believed that the spectral region within 1050 and 970 cm-1 could
be served as an approximate criterion of polysaccharide heterogeneity [18]. In our study, four fractions exhibited one
band of considerable intensity at about 1050 to 1020 cm-1.
The bands detected at about 930 and 761 cm-1 in the infrared
spectra of B-I-1 fraction, and within 1151 and 761 cm-1 in B-II-1
fraction were assigned to out-of-phase C-O-C ring vibrations. This was partly coincide with Kacurakova et al. (2000) [19].
One intensive IR band at about 850 cm-1 corresponded to
the “α-configuration” bending modes was found in B-I-1 and B-II-1 fractions, while a small band positioned at about 800
cm-1 was visible in B-I-2 and B-II-2 fractions, attributed to
out-of-plane CH bending deformation vibrations.
Since the four polysaccharides had different chemical structures, it was difficult to find an IR band attributed only to
I. cicadae polysaccharide groups. However, accumulation of more extensive data on the IR spectra of different sugars and polysaccharides would facilitate estimation of the structure and conformation of polysaccharide structure with the use of computer-assisted analysis.
Figure 2. The FTIR spectra of four polysaccharide fractions from I. cicadae. 3.3. 1D and 2D NMR Analysis
Signals of four polysaccharide fractions from I. cicadae in
1D 1H and 13C NMR and 2D NMR (HSQC, COSY and
HMBC) spectra were assigned as completely as possible, based on monosaccharide analysis, linkage analysis and chemical shifts reported in the literature.
Table 2. Chemical shifts for the resonances of glycosyl residues of B-I-1 in 1D and 2D NMR spectra. Pos Chemical shifts, δ (ppm)
δδδδH δδδδC HSQC 1H-1H COSY HMBC
1 5.34 101.02 1→ H1→C4
H4→C1
2 3.60 72.84
3 4.10
3.90
85.43
73.91-74.60 3→
4 3.91-4.10 76.68-82.24 4→ H4→H5
H1→C4 H4→C1 H4→C5
5 3.82 72.83 H5→H4
H5→H6
6 3.62-3.95
62.65 63.55 62.07 61.77
With respect to B-I-1, the anomeric proton signals δ 5.34 ppm corresponded to the H-1 of Rhap. The corresponding signal at δ
< 102 ppm in 13C NMR was found. So it could be deduced that the residue is attributed to pyran ring with alpha model connecting
way of glycosidic bond, which was consistent with the 1H NMR speculation. Based on the data (Table 2) the repeated unit
structure was assigned as →4)-α-D-Glc (1→4)-α-D-Glc (1→ (Figure 3).
Figure 3. Structure of B-I-1.
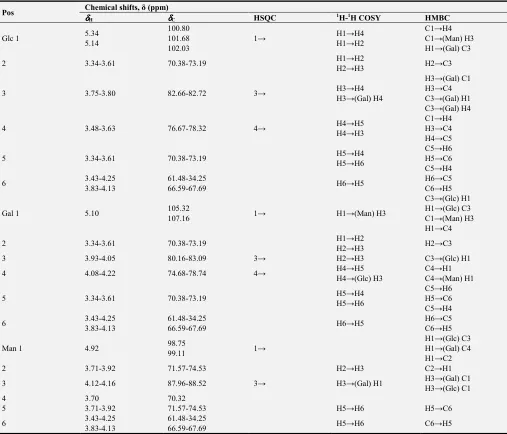
For B-I-2, the anomeric proton signals δ 5.34,5.14,5.10,4.92 ppm were detected, which was attributed to β or α glycosidic
bond. The complete 1H and 13C NMR signal assignments for B-I-2 were summarized in Table 3. From this we deduced that the
structure of B-I-2 may be repeated with →1)-α-D-Glc (4→1)-α-Glc (3→1)-α-D-Gal (4→1)-α-D-Gal (3→1)-α-D-Glc (4→, within chain link monose 1 and 4 (Figure 4).
Table 3. Chemical shifts for the resonances of glycosyl residues of B-I-2 in 1D and 2D NMR spectra.
Pos Chemical shifts, δ (ppm) δδδδ
H δδδδC HSQC 1H-1H COSY HMBC
Glc 1 5.34
5.14
100.80 101.68 102.03
1→ H1→H4
H1→H2
C1→H4 C1→(Man) H3 H1→(Gal) C3
2 3.34-3.61 70.38-73.19 H1→H2
H2→H3 H2→C3
3 3.75-3.80 82.66-82.72 3→ H3→H4
H3→(Gal) H4
H3→(Gal) C1 H3→C4 C3→(Gal) H1 C3→(Gal) H4
4 3.48-3.63 76.67-78.32 4→ H4→H5
H4→H3
C1→H4 H3→C4 H4→C5
5 3.34-3.61 70.38-73.19 H5→H4
H5→H6
C5→H6 H5→C6 C5→H4
6 3.43-4.25
3.83-4.13
61.48-34.25
66.59-67.69 H6→H5
H6→C5 C6→H5
Gal 1 5.10 105.32
107.16 1→ H1→(Man) H3
C3→(Glc) H1 H1→(Glc) C3 C1→(Man) H3 H1→C4
2 3.34-3.61 70.38-73.19 H1→H2
H2→H3 H2→C3
3 3.93-4.05 80.16-83.09 3→ H2→H3 C3→(Glc) H1
4 4.08-4.22 74.68-78.74 4→ H4→H5
H4→(Glc) H3
C4→H1 C4→(Man) H1
5 3.34-3.61 70.38-73.19 H5→H4
H5→H6
C5→H6 H5→C6 C5→H4
6 3.43-4.25
3.83-4.13
61.48-34.25
66.59-67.69 H6→H5
H6→C5 C6→H5
Man 1 4.92 98.75
99.11 1→
H1→(Glc) C3 H1→(Gal) C4 H1→C2
2 3.71-3.92 71.57-74.53 H2→H3 C2→H1
3 4.12-4.16 87.96-88.52 3→ H3→(Gal) H1 H3→(Gal) C1
H3→(Glc) C1
4 3.70 70.32
5 3.71-3.92 71.57-74.53 H5→H6 H5→C6
6 3.43-4.25
3.83-4.13
61.48-34.25
Figure 4. Structure of B-I-2.
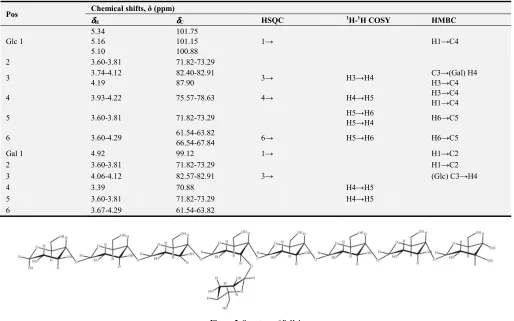
For B-II-1, the data showed that it was very similar to B-I-1. The anomeric proton signals δ 5.34,5.14,5.10,4.92 ppm were
detected, which were attributed to α glycosidic bond, and in the 13C spectrum, the δ < 102 ppm was attributed to pyran ring with
alpha model connecting way of glycosidic bond, which was consistent with the 1H NMR speculation (Table 4). The data showed
that the repeating unit of B-II-1 was →1)-α-D-Glc (4→1)-α-D-Glc (4→1)-α-D-Glc (4→1)-α-D-Glc (4→1)-α-D-Glc (4→1)-α-D-Glc (4→1)-α-D-Glc (4→1)-α-D-Glc (4→, with the C3 in the fourth Glc was replaced by α-D-Glc (3→4)-α-D-Gal (Figure 5).
Table 4. Chemical shifts for the resonances of glycosyl residues of B-II-1 in 1D and 2D NMR spectra.
Pos Chemical shifts, δ (ppm)
δδδδH δδδδC HSQC 1H-1H COSY HMBC
Glc 1
5.34 5.16 5.10
101.75 101.15 100.88
1→ H1→C4
2 3.60-3.81 71.82-73.29
3 3.74-4.12
4.19
82.40-82.91
87.90 3→ H3→H4
C3→(Gal) H4 H3→C4
4 3.93-4.22 75.57-78.63 4→ H4→H5 H3→C4
H1→C4
5 3.60-3.81 71.82-73.29 H5→H6
H5→H4 H6→C5
6 3.60-4.29 61.54-63.82
66.54-67.84 6→ H5→H6 H6→C5
Gal 1 4.92 99.12 1→ H1→C2
2 3.60-3.81 71.82-73.29 H1→C2
3 4.06-4.12 82.57-82.91 3→ (Glc) C3→H4
4 3.39 70.88 H4→H5
5 3.60-3.81 71.82-73.29 H4→H5
6 3.67-4.29 61.54-63.82
Figure 5. Structure of B-II-1.
Table 5. Chemical shifts for the resonances of glycosyl residues of B-II-2 in 1D and 2D NMR spectra.
Pos Chemical shifts, δ (ppm) δδδδ
H δδδδC HSQC 1H-1H COSY HMBC
Gal 1 5.10
5.08
101.74
107.34 1→ H1→C4
2 3.63-3.96 70.91-72.54
3 3.74-4.18 82.75-83.03 3→ H3→H4
H4→C3 C3→H6 C3→(Man) H1
4 3.85-4.22 74.60-78.84 4→ H4→H5
H4→H3
C4→H5 C4→H1
5 3.63-3.96 70.91-72.54 H5→H4
H5→H6
H5→C4
6 3.54-4.24 60.53-63.82
63.82-67.66 6→ H6→H5
Man 1 5.15
5.18
100.68
104.44 1→ H1→H3
H1→(Gal) C3 H1→C3
2 3.63-3.96 70.91-72.54
3 4.12 87.92 3→ H3→H1 C3→H1
4 4.04 70.91
5 3.63-3.96 70.91-72.54
6 3.54-4.24 60.53-63.82
63.82-67.66 6→
Glc 1 5.34 105.30 1→
2 3.63-3.96 70.91-72.54
3 4.04 73.47
4 3.66 77.30 4→
5 3.63-3.96 70.91-72.54
6 3.54-4.24 60.53-63.82
63.82-67.66 6→
Figure 6. Structure of B-II-1.
4. Conclusion
According to the above results, it was concluded that the
water extract of Isaria cicadae predominantly contained four
types of water extractable polysaccharides (B-I-1, B-I-2, B-II-1 and B-II-2). According to their FTIR spectra, it is possible to assume that the four polysaccharide fractions
exhibited various extents marker vibrations of
polysaccharide substance, such as O-H, C-H, C=O and –OH stretching. However, special bands were also found in the IR spectra of each fraction, making it not feasible to use some
vibrations as marker bands for I. cicadae polysaccharides.
Every polysaccharide fraction was constituted by D-glucose,
D-mannose and D-galactose in different ratios except for
B-I-1, which was constituted by D-arabinose, D-xylose and
D-glucose. Moreover, preliminary structure of four
polysaccharide fractions from I. cicadae were proposed as
follows: →4)-α-D-Glc (1→4)-α-D-Glc (1→ for B-I-1;
→1)-α-D-Glc (4→1)-α-Glc (3→1)-α-D-Gal
(4→1)-α-D-Gal (3→1)-α-D-Glc (4→, within chain link monose 1 and 4 for B-I-2; →1)-α-D-Glc (4→1)-α-D-Glc
(4→1) -α-D-Glc (4→1)-α-D-Glc (4→1)-α-D-Glc
(4→1)-α-D-Glc (4→1)-α-D-Glc (4→1)-α-D-Glc (4→, with the C3 in the fourth Glc was replaced by α-D-Glc (3→4)-α-D-Gal for B-II-1; →1)-α-D-Gal (4→1)-α-D-Gal (3→1)-α-D-man (3→1)-α-D-man (3→, with the second Gal replaced by α-D-Gal (4→1)-α-D-Glc for B-II-2. Preliminary
activity tests showed that I. cicadae were effective in
Acknowledgements
The author gratefully acknowledge Ying Zhang for assistance with the experiments.
References
[1] Sung, G. H., Hywel-Jones, N. L., Sung, J. M., Luangsa-ard, J. J., Shrestha, B., & Spatafora, J. W. (2007). Phylogenetic classification of Cordyceps and the clavicipitaceous fungi.
Studies in mycology, 57, 5-59.
[2] Kuo, Y. C., Weng, S. C., Chou, C. J., Chang, T. T., & Tsai, W. J. (2003). Activation and proliferation signals in primary human t lymphocytes inhibited by ergosterol peroxide isolated from cordyceps cicadae. British Journal of Pharmacology, 140, 895–906.
[3] Kim, H. S., Kim, J. Y., Ryu, H. S., Shin, B. R., Kang, J. S., & Kim, H. M., et al. (2011). Phenotypic and functional maturation of dendritic cells induced by polysaccharide isolated from
Paecilomyces cicadae. Journal of Medicinal Food,14, 847– 856.
[4] Xu Z, Song Z, Yan X, Li W, Zhao W, Ma H, Du J, Li S, Zhang D. (2018). Two heteropolysaccharides from Isaria cicadae
Miquel differ in composition and potentially immunomodulatory activity. International Journal of Biological Macromolecules, 117:610-616.
[5] Wang, H., Zhang, J., Sit, W. H., Lee, C. Y. J., & Wan, M. F. (2014). Cordyceps cicadae induces G2/M cell cycle arrest in MHCC97H human hepatocellular carcinoma cells: a proteomic study. Chinese Medicine,9, 15.
[6] Wang, J., Zhang, D. M., Jia, J. F., Peng, Q. L., Tian, H. Y., & Wang, L., et al. (2014). Cyclodepsipeptides from the ascocarps and insect-body portions of fungus Cordyceps cicadae.
Fitoterapia,97, 23–27.
[7] Lu CL, Lin HI, Chen BF, Jow GM. (2016). Beauvericin-induced cell apoptosis through the mitogen-activated protein kinase pathway in human nonsmall cell lung cancer A549 cells. Journal of Toxicological Sciences, 41 (3):429.
[8] Wang D, Wang J, Wang D, Yu X, Olatunji OJ, Ouyang Z, Wei Y. (2017). Neuroprotective effects of butanol fraction of
Cordyceps cicadae on glutamate-induced damage in PC12 cells involving oxidative toxicity. Chemistry & Biodiversity, 15 (1):
e1700385.
[9] Zhu, R., Chen, Y. P., Deng, Y. Y., Zheng, R., Zhong, Y. F., & Wang, L., et al. (2011). Cordyceps cicadae extracts ameliorate renal malfunction in a remnant kidney model. Journal of Zhejiang University B,12, 1024-1033.
[10] Yu, S. J., Bao, J. Y., & Fan, M. Z. (2014). Extraction technology and biological activities of crude polysaccharide from synnemata of Cordyceps cicadae culture. Journal of Fungal Research, 12, 100-106.
[11] Galonic, D. P., Gin, D. Y. (2007). Chemical glycosylation in the synthesis of glycoconjugate antitumour vaccines. Nature, 446, 1000–1007.
[12] Yu, R. M., Yin, Y., Yang, W., Ma, W., Yang, L., & Chen, X., et al. (2009). Structural elucidation and biological activity of a novel polysaccharide by alkaline extraction from cultured
Cordyceps militaris. Carbohydrate Polymers,75, 166–171.
[13] Ukai, S., Matsuura, S., Hara, C., Kiho, T., & Hirose, K. (1982). Structure of a new galactomannan from the ascocarps of
Cordyceps cicadae shing. Carbohydrate Research,101, 109– 116.
[14] Kiho, T., Miyamoto, I., Nagai, K., Ukai, S., & Hara, C. (1988). Minor, protein-containing galactomannans from the insect-body portion of the fungal preparation chán huā (Cordyceps cicadae). Carbohydrate Research,181, 207–215.
[15] Zha, S. H., Zhao, Q. S., Chen, J. J., Wang, L. W., Zhang, G. F., Zhang, H., et al. (2014). Extraction, purification and antioxidant activities of the polysaccharides from maca (Lepidium meyenii). Carbohydrate Polymers, 111, 584-587.
[16] De Paula Regina, C. M., Heatley, F., & Budd, P. M. (1998). Characterization of Anacardiumoccidentale exudate polysaccharide. Polymer International, 45, 27–35.
[17] Heyn, A. N. J. (1974). The infrared absorption spectrum of dextran and its bound water. Biopolymers, 13, 475–506.
[18] Galat, A. (1980). Study of the Raman scattering and infrared absorption spectra of branched polysaccharides. Acta Biochimica Polonica, 27, 135–142.
[19] Kacurakova, M., Capek, P., Sasinkova, V., Wellner, N., & Ebringerova, A. (2000). FT-IR study of plant cell wall model compounds: Pectic polysaccharides andhemicelluloses.