Drug release and swelling kinetic studies of glipizide sustained release matrix tablet – wet granulation method
9
0
0
Full text
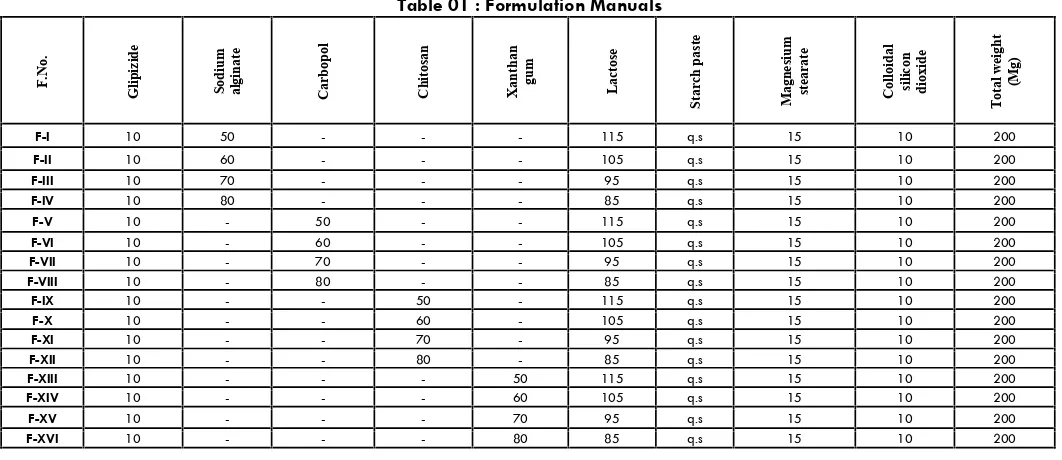
(2) 44. Materials and methods. No.20. Starch mucilage was used as a binder .The aggregates formed after addition of binder were initially dried 5-10 min to reduce moisture level and to prevent sticking with the sieve. The aggregates were passed through sieve # 16 mesh to get granules. The granules were finally dried at 500 c for 10-15 min to reduce moisture content to 2-5%. Magnesium stearate and talc were used for lubrication. After lubrication the formulations were evaluated for bulk density and compressibility. Same method followed for all formulations (FI, FII, FIII, FIV, and up to FXVI). The formulation manuals for all formulation are given in Table 1. Prior to the compression the granules were evaluated for several tests.. Materials Glipizide gift sample from Micro Labs, Hosur. Sodium alginate, carbopol chitosan , xanthan gum Gift sample from S.D fine chemicals., Mumbai. Magnesium stearate, talc, colloidal silicon dioxide, was of AR Grade.. Methods. Preparation of matrix tablets Matrix tablets were prepared by wet granulation method. Accurate quantities of all ingredients for different were weighed. For each formulation, specific and accurate quantities were blended uniformly and passed through sieve. F.No.. Glipizide. Sodium alginate. Carbopol. Chitosan. Xanthan gum. Lactose. Starch paste. Magnesium stearate. Colloidal silicon dioxide. Total weight (Mg). Table 01 : Formulation Manuals. F-I. 10. 50. -. -. -. 115. q.s. 15. 10. 200. F-II. 10. 60. -. -. -. 105. q.s. 15. 10. 200. F-III F-IV. 10 10. 70 80. -. -. -. 95 85. q.s q.s. 15 15. 10 10. 200 200. F-V. 10. -. 50. -. -. 115. q.s. 15. 10. 200. F-VI F-VII F-VIII F-IX F-X F-XI F-XII F-XIII F-XIV F-XV F-XVI. 10 10 10 10 10 10 10 10 10 10 10. -. 60 70 80 -. 50 60 70 80 -. 50 60 70 80. 105 95 85 115 105 95 85 115 105 95 85. q.s q.s q.s q.s q.s q.s q.s q.s q.s q.s q.s. 15 15 15 15 15 15 15 15 15 15 15. 10 10 10 10 10 10 10 10 10 10 10. 200 200 200 200 200 200 200 200 200 200 200. Evaluation of granules Angle of repose The angle of repose of granules was determined by the funnel method. [11]The granules were allowed to flow through the funnel freely onto the surface. The diameter of the powder cone was measured and angle of repose was calculated using the following equation . Given in table 02 Bulk density Both loose Bulk density (LBD) and tapped density (TBD) were determined. A calculated quantity of 2 gm of powder from each formula was introduced into a measuring cylinder and tapped for certain time until no further change in volume was noted. LBD and TBD were calculated using the following formula. The results are given in table 02 Compressibility index The compressibility Index[12] of the granules was determined by Carr's compressibility index. The results are given in table 02.. Int. J. Pharm & Ind. Res. Vol – 01. Total porosity( Hausners ratio’s) Total Porosity was determined by measuring the volume occupied by a selected weight of a powder (V bulk) and the true volume of the granules V the space occupied by the powder exclusive of spaces greater than the intermolecular space[13]. The results are given in table 02. Drug content 20 tablets of each formulation were weighed and powdered. The quantity of powder equivalent to 15mg of glipizide was taken and dissolved in 30 ml of methanol with gentle heating on a water bath, cool and add sufficient amount of methanol is added to produce 50 ml. filter and dilute to 5 ml of the filtrate to 50ml with methanol. The absorbance was measured spectrophotometrically at 274 nm after suitable dilution. Evaluations of tablets Thickness The thickness of the tablets were determined using a Digital Caliper (Mitutoyo, Digimatic Caliper, New Delhi, India) 20 tablets from each batch were used and average values were calculated. The results are given in table 03.. Issue – 01. Jan - Mar 2011.
(3) 45 Weight variation test To study the weight variation, 20 tablets of each formulation were selected at random and average weight was determined. Not more than 2 of the individual weights may deviate from the average weight by more than the % deviation and none should deviate by more than twice that of the percentage (Limit for not more than 130 to 324 mg is 7.5 %.). The results are given in table no: 3 Hardness and friability For each formulation, the hardness and friability of 20 tablets each were determined using the Monsanto Hardness Tester and Roche Friabilator (Cadmach, Ahmedabad, India). The results are given in table 03. In vitro drug release studies The in vitro dissolution studies were performed using USP 22 type I dissolution (Electro Lab, TDT -08 L, Mumbai, India) apparatus 37±5°C, at 50 rpm. Using 900 ml of 0.1 N HCl for first 2 hr and phosphate buffer of pH 6.8 from 2-12 hr. An aliquot (5 ml) of the sample solution was withdrawn at predetermined time intervals , filtered through a membrane filter, diluted suitably and analyzed spectrophotometrically at 274 nm (Shimadzu Model 1601). The results are given in table no: 4 Optimum release profile Optimum release profile for once daily SR formulation was calculated by the Equation 3 using available pharmacokinetic data [14]. Dt = Dose (1+ 0.693 × t / t ½) (Equation 1) Where Dt is total dose of drug, dose is dose of the immediate release part, t is time duringwhich the sustained release is desired (12 h) and t ½ is half -life of the drug (3 h). The optimum formulation was selected on the above equation so that it could attain complete and controlled drug release upon "trading off" various response variables; the following maximizing criteria were adopted. Kinetic release profile To study the release kinetics, data obtained from in vitro drug release studies were plotted in various kinetic models, zero order. As cumulative amount of drug released Vs time, C= Ko.t first order as log cumulative percentage of drug remaining vs. time, Log C= Log Co- kt/ 2.303 Higuchi's model as cumulative percentage of drug released Vs. square root o f time. Q= kt ½ Where ‘Ko’ is the zero -order rate constant expressed in units of concentration / time and ‘t’ is the time in hours. A graph of concentration Vs time would yield a straight line with a slope equal to Ko and intercept the origin of the axes [15]. ‘Co’ is the initial concentration of drug, ‘k’ is the first order constant, and t is the time.. Int. J. Pharm & Ind. Res. Vol – 01. . ‘K’ is the constant, reflecting the design variables of the system and ‘t’ is the time in hours. These models fail to explain drug release mechanisms due to the swelling (upon hydration) along with gradual erosion of the matrix. Therefore the dissolution data was also fitted to the well known Koresmeyer- peppas equation[16] Log (Mt/Ma) = log K+ n Logt Hixon and crowell erosion equation To evaluate the drug release with changes in the surface area and the diameter of particle, the data were plotted using Hixon and crowell rate equation. The graph was plotted by cubic root of % drug remaining Vs time in hours. Qo 1/3 –Qt 1/3 =KHC Xt Which is often used to describe the drug release behavior from polymer systems? Where ‘Mt’ is the amount of the drug release at time‘t’, ‘Ma’ is the amount of drug release after infinite time and ‘K’ is a release rate constant incorporating structural and geometric characteristic of the tablet and ‘n’ is the diffusion exponent indications of the mechanism of drug release. A value of n=0.45 indicates Fickian (case -I) release: >0.45 but <0.89 for non-Fickian (Anomalous) release and >0.89 indicates case II type of release. Case II generally refers to the erosion of the polymeric chain and anomalous transport (non-Fickian) refers to a combination of both erosion and diffusion controlled drug release. The results are given in table no: 5 In vivo pharmacokinetic study (Experimental procedure) Anti diabetic activity[17] Study in normal rats: A group of ten albino rats weighing between 250-300 g were administered with 2 mg/kg weight Glipizide orally, for two consecutive days. Blood samples withdrawn from retro orbital puncture at 0,1,2,4,6 and 12 hours intervals. Blood samples were analysed for blood glucose levels by GOD/POD method using commercial glucose kits for serum Glipizide concentration by HPLC method. Study in diabetic rats: diabetes was induced by the administration of alloxan monohydrate in the two doses i.e 100 mg and 50 mg/kg body weight, intraperitoneally for two consecutive days. A group of 10 rats with blood glucose levels above 250 mg/dL was selected for the study. The similar to the one conducted in normal rats was repeated in diabetic group. The results are given in table no: 6 Estimation of Glipizide SR by HPLC Method Test solution- dissolve 25 mg of s the substance under examination in 100ml of mobile phase. A stainless steel column 15cm X 4.6 mm packed with octa decylsilyl silica.. Issue – 01. Jan - Mar 2011.
(4) 46 Mobile phase- mixture of 17 volumes of acetonitrile and 83 volumes of 0.35 percent w/v of dipotassium hydrogen phosphatewas taken and adjust to pH 8.0 with orthophosphoric acid. The results are given in table and fig no: 7, 8 & 6. The concentration[18] of glipzide SR tablet at sampling points were utilized for calculating pharmacokinetic parameters using PK summit solutions (software for calculations) The relative bioavailability was calculated by using the following equation (AUCo - a) F4 Ho, L Relative bioavailability = -----------------------------(AUCo - a) Std Glipizide SR Accelerated stability studies[19] Tablets from optimized formulated batch F10 was packed in an air tight high density polythene bottles and kept at 45 °C with 75±5% RH for 45 days as per International Congress on Harmonization states (ICH) guidelines. Samples were withdrawn at 0, 15, 30 and 45 days of storage and evaluated for appearance, hardness and drug content. The results are given in table 09 & 07. Comparison of Dissolution profile between Optimized Formulation and Marketed Product Fig no: 1 FT IR Spectrum of Glipizide. Result and Discussion. Glipizide raw material passed all the tests for identification, Percentage purity of raw material was determined to be % w/w. Physical compatibility Studies The physical compatibility test between drug and other tablet components was carried out at 25-300C and 75% R.H for 45 days. The mixture does not show any visible change, thus indicating drug and other tablet components do not have any physical incompatibility. Drug- Excipient interaction The drug polymer interaction was studied by comparing the FTIR spectrum of the formulations F1 to F16 with that of Glipizide RS. Thus the comparison shows that there is no drug interaction between the drug and other ingredients of formulation including excipients and such as lactose, starch, talc etc. Fig no: 3 FT IR Spectrum of Carbopol. Fig no: 2 FT IR Spectrum of Sodium alginate. Int. J. Pharm & Ind. Res. It was done as per procedure given as per in vitro release in this section. Graph of cumulative percentage drug release Vs time (hour) for both the optimized formulation and marketed product was plotted. The results are given in table 10 and fig no 8. Vol – 01. Fig no: 4 FT IR Spectrum of Xanthan gum. Issue – 01. Jan - Mar 2011.
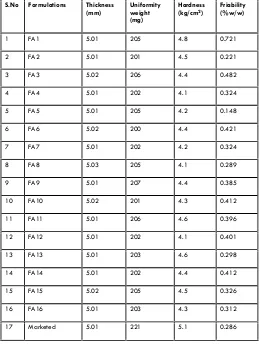
(5) 47 Fig no: 5 FT IR Spectrum of Chitosan Test. Specification. Observation. Granules ready for compression. Not more than 0.5%. 0.39%. Further to this all the formulated tablets designed as FA1, FA2, FA3, FA4, FA5, FA6, FA7, FA8, FA9, FA10, FA11, FA12, FA13, FA14, FA15, FA16 were evaluated for its following physicochemical character Physical Properties of Tablets Table no: 3 Evaluation of tablets Physical Properties of Granules Glipizide powder and the prepared granules were evaluated for angle of repose, bulk density, hausner’s ratio and compressibility index. Results of evaluation of granules are as follows, Table no: 2 Evaluation of granules. S.No. Formulations. Thickness (mm). Uniformity weight (mg). Hardness (kg/cm2). Friability (%w/w). 1. FA1. 5.01. 205. 4.8. 0.721. 2. FA2. 5.01. 201. 4.5. 0.221. 3. FA3. 5.02. 206. 4.4. 0.482. 4. FA4. 5.01. 202. 4.1. 0.324. 5. FA5. 5.01. 205. 4.2. 0.148. 6. FA6. 5.02. 200. 4.4. 0.421. 7. FA7. 5.01. 202. 4.2. 0.324. 8. FA8. 5.03. 205. 4.1. 0.289. 9. FA9. 5.01. 207. 4.4. 0.385. 10. FA10. 5.02. 201. 4.3. 0.412. 11. FA11. 5.01. 206. 4.6. 0.396. S.No.. Formulation. Bulk Density (gm/ml). 1. FA1. 0.450. 30042’. 12.25. 1.13. 2. FA2. 0.462. 30040’. 14.36. 1.16. 3. FA3. 0.456. 30048’. 15.42. 1.15. 4. FA4. 0.458. 30062’. 14.36. 1.14. 5. FA5. 0.464. 30040’. 12.36. 1.12. 6. FA6. 0.470. 30042’. 15.42. 1.13. 7. FA7. 0.472. 30044’. 12.68. 1.15. 12. FA12. 5.01. 202. 4.1. 0.401. 8. FA8. 0.468. 31012’. 14.62. 1.13. 13. FA13. 5.01. 203. 4.6. 0.298. 9. FA9. 0.468. 30060. 13.85. 1.14. 14. FA14. 5.01. 202. 4.4. 0.412. 10. FA10. 0.476. 30042’. 14.28. 1.16. 15. FA15. 5.02. 205. 4.5. 0.326. 11. FA11. 0.498. 30044’. 12.98. 1.15. 16. FA16. 5.01. 203. 4.3. 0.312. 12. FA12. 0.472. 30039’. 15.00. 1.15. 17. Marketed. 5.01. 221. 5.1. 0.286. 0.478. 30042’. 13.62. 1.12. 14.06. 1.14. 13. FA13. Angle of repose. Carr’s index (%). Hausner’s Ratio. 14. FA14. 0.478. 30039’. 15. FA15. 0.476. 31008’. 12.98. 1.12. 16. FA16. 0.472. 30042’. 15.02. 1.13. Loss on drying Loss on drying was determined as per procedure given in material and methodology section. Physical compatibility test Physical compatibility test was determined as per procedure given in material and methodology section. The study implies that the drug, polymer and other excipients were physically compatible with each other as there was no change of physical description. Int. J. Pharm & Ind. Res. Vol – 01. In Vitro Release Studies The in vitro dissolution studies were performed using USP-22 type I dissolution (Electro Lab, TDT -08 L, Mumbai, India) apparatus 37±5°C, at 50 rpm. Using 900 ml of 0.1N HCl for first 2 hr and phosphate buffer of pH 6.8 from 2-12 hr. An aliquot (5 ml) of the sample solution was withdrawn at predetermined time intervals , filtered through a membrane filter, diluted suitably and analyzed spectrophotometrically at 274nm (Shimadzu Model 1601).. Issue – 01. Jan - Mar 2011.
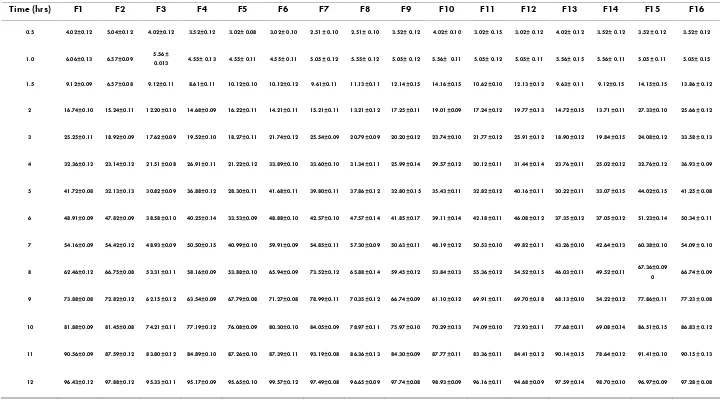
(6) 48 Table no:4 invitro drug release studies F1-F16 Time (hrs). F1. F2. F3. F4. F5. F6. F7. F8. F9. F10. F11. F12. F13. F14. F15. F16. 0.5. 4.02±0.12. 5.04±0.12. 4.02±0.12. 3.52±0.12. 3.02± 0.08. 3.02± 0.10. 2.51± 0.10. 2.51± 0.10. 3.52± 0.12. 4.02± 0.10. 3.02± 0.15. 3.02± 0.12. 4.02± 0.12. 3.52± 0.12. 3.52± 0.12. 3.52± 0.12. 1.0. 6.06±0.13. 6.57±0.09. 4.55± 0.13. 4.55± 0.11. 4.55± 0.11. 5.05± 0.12. 5.55± 0.12. 5.05± 0.12. 5.56± 0.11. 5.05± 0.12. 5.05± 0.11. 5.56± 0.15. 5.56± 0.11. 5.05± 0.11. 5.05± 0.15. 1.5. 9.12±0.09. 6.57±0.08. 9.12±0.11. 8.61±0.11. 10.12±0.10. 10.12±0.12. 9.61±0.11. 11.13±0.11. 12.14±0.15. 14.16±0.15. 10.62±0.10. 12.13±0.12. 9.63± 0.11. 9.12±0.15. 14.15±0.15. 13.86± 0.12. 2. 16.74±0.10. 15.24±0.11. 12.20±0.10. 14.68±0.09. 16.22±0.11. 14.21±0.11. 15.21±0.11. 13.21±0.12. 17.25±0.11. 19.01±0.09. 17.24±0.12. 19.77±0.13. 14.72±0.15. 13.71±0.11. 27.33±0.10. 25.66± 0.12. 3. 25.25±0.11. 18.92±0.09. 17.62±0.09. 19.52±0.10. 18.27±0.11. 21.74±0.12. 25.54±0.09. 20.79±0.09. 20.20±0.12. 23.74±0.10. 21.77±0.12. 25.91±0.12. 18.90±0.12. 19.84±0.15. 24.08±0.12. 33.58± 0.13. 4. 32.36±0.12. 23.14±0.12. 21.51±0.08. 26.91±0.11. 21.22±0.12. 33.89±0.10. 33.60±0.10. 31.34±0.11. 25.99±0.14. 29.57±0.12. 30.12±0.11. 31.44±0.14. 23.76±0.11. 25.02±0.12. 32.76±0.12. 36.93± 0.09. 5. 41.72±0.08. 32.13±0.13. 30.82±0.09. 36.88±0.12. 28.30±0.11. 41.68±0.11. 39.80±0.11. 37.86±0.12. 32.80±0.15. 35.43±0.11. 32.82±0.12. 40.16±0.11. 30.22±0.11. 33.07±0.15. 44.02±0.15. 41.25± 0.08. 6. 48.91±0.09. 47.82±0.09. 38.58±0.10. 40.25±0.14. 33.53±0.09. 48.88±0.10. 42.57±0.10. 47.57±0.14. 41.85±0.17. 39.11±0.14. 42.18±0.11. 46.08±0.12. 37.35±0.12. 37.05±0.12. 51.23±0.14. 50.34± 0.11. 7. 54.16±0.09. 54.42±0.12. 48.93±0.09. 50.50±0.15. 40.99±0.10. 59.91±0.09. 54.85±0.11. 57.30±0.09. 50.63±0.11. 48.19±0.12. 50.53±0.10. 49.82±0.11. 43.26±0.10. 42.64±0.13. 60.38±0.10. 54.09± 0.10. 8. 62.46±0.12. 66.75±0.08. 53.31±0.11. 58.16±0.09. 53.88±0.10. 65.94±0.09. 73.52±0.12. 65.88±0.14. 59.45±0.12. 53.84±0.13. 55.36±0.12. 54.52±0.15. 46.03±0.11. 49.52±0.11. 9. 73.88±0.08. 72.82±0.12. 62.15±0.12. 63.54±0.09. 67.79±0.08. 71.27±0.08. 78.99±0.11. 70.35±0.12. 66.74±0.09. 61.10±0.12. 69.91±0.11. 69.70±0.18. 68.13±0.10. 54.22±0.12. 77.86±0.11. 77.23± 0.08. 10. 81.88±0.09. 81.45±0.08. 74.21±0.11. 77.19±0.12. 76.08±0.09. 80.30±0.10. 84.05±0.09. 78.97±0.11. 75.97±0.10. 70.29±0.13. 74.09±0.10. 72.93±0.11. 77.68±0.11. 69.08±0.14. 86.51±0.15. 86.83± 0.12. 11. 90.56±0.09. 87.59±0.12. 83.80±0.12. 84.89±0.10. 87.26±0.10. 87.39±0.11. 93.19±0.08. 86.36±0.13. 84.30±0.09. 87.77±0.11. 83.36±0.11. 84.41±0.12. 90.14±0.15. 78.64±0.12. 91.41±0.10. 90.15± 0.13. 12. 96.43±0.12. 97.88±0.12. 95.33±0.11. 95.17±0.09. 95.65±0.10. 99.57±0.12. 97.49±0.08. 96.65±0.09. 97.74±0.08. 98.93±0.09. 96.16±0.11. 94.68±0.09. 97.59±0.14. 98.70±0.10. 96.97±0.09. 97.28± 0.08. 5.56± 0.013. Int. J. Pharm & Ind. Res. Vol – 01. Issue – 01. Jan - Mar 2011. 67.36±0.09 0. 66.74± 0.09.
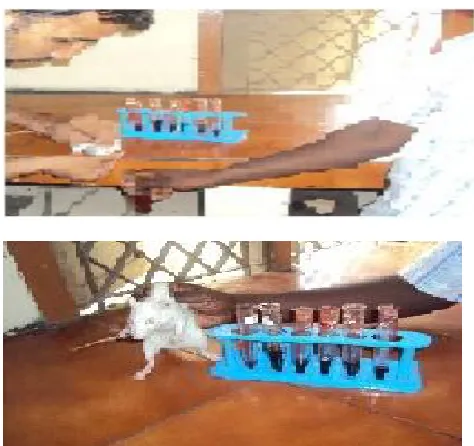
(7) 49 In vitro Kinetic study The in vitro data of optimized formulation F10 for zero and first order, higuchi and Korsmayer peppas equation were the observed slop values and regression co-efficient .The result of table showed that the formulation F10 follow zero order and release mechanism of drug through polymeric membrane was observed anomalous transport (Non-fickian) diffusion, which is also confirmed by koresmeyer-peppas plot. Table no: 5 invitro kinetic studies Formulation. Regression coefficient of Zero order kinetics. The drug sustained release tablets. 0.9965. Regression coefficient of first order kinetics. Order of release Zero order. 0.6853. In vivo pharmacokinetic study: Table No: 6 Blood Glucose Level Time In Hours. Table no: 7 in vivo pharmacokinetic study of HPLC Time in hrs. Test F (mcg/ml). Marketed F (mcg/ml). 0 1 2 3 4 5 6 8 12. 0 14.25 24.4 35.05 42.66 62.3 85 63.41 40.23. 0 12.25 22.63 35 40.1 60.52 52.32 48.37 37.74. Fig no: 6. Time (Hours). 1. 2. 3. 6. 8. 12. Mean ± SEM. Control. 0. 91.00. 90.25. 88.0. 87.0. 87.0. 88.5±0.71. Test-A. 0. 210.0. 201.0. 160.5. 137.3. 129.0. 166.3±13.2. Test-B. 0. 207.0. 199.5. 160.5. 135.5. 125.0. 164.8±13.3. Test-C. 0. 205.0. 197.5. 159.5. 134.3. 123.0. 163.3±13.2. Standard. 0. 201.0. 193.5. 154.5. 128.8. 122.0. 159.0±13.5. Relative bioavailability In vivo pharmacokinetic study (approval from the IACE/XIII / 02 /CLBMCP/ 2009-2010 dated 15/10/09) carried out albino rats. In-vivo release characteristics of F10with that of marketed Glipizide SR. Plasma concentration was determined by established high performance liquid chromatography method.. Table no: 8 Pharmacokinetic parameters Parameters. Units. F10. Marketed F. C max t max AUC 0-α. Mcg/ml Hrs Mcg-hr/ml. 85 6 93.0. 60.5 5 1083. AUMC 0-α MRT. Mcg-hr* hr/ml mr. 17327 4.2. 11254 4.1. The results were analysed by student ‘t’ test F10 and marketed formulation. Therefore F10 performs. Significantly better than marketed formulation. The relative bioavailability = 1.16. Stability studies (As Per ICH Guidelines) Dissolution data cumulative drug released for optimized formulation. Dissolution data of stability sample was also performed at room temperature 30 0C±20C / 65% RH±5% and 400C±200C / 75% RH±5% accelerated temperature for 45 days. The product was evaluated Friability, hardness, weight variation, thickness, drug content an in vitro release study. Test Inference Hardness Weight variation Complies with the stability Thickness condition Friability Int. J. Pharm & Ind. Res. Vol – 01. Issue – 01. Jan - Mar 2011.
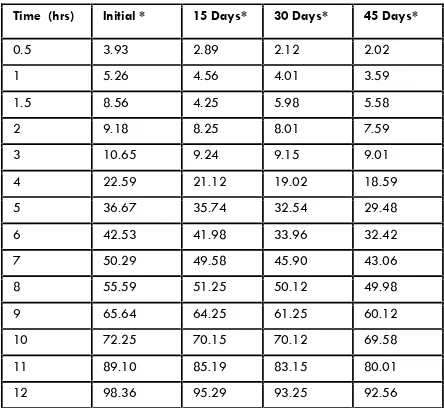
(8) 50 Table no: 9 Comparison of dissolution data of stability sample at Accelerated temperature. Table no: 10 %cumulative drug release comparison of Marketed and Test formulation Percent cumulative drug release for marketed product. Time (hrs). Initial *. 15 Days*. 30 Days*. 45 Days*. 0.5. 3.93. 2.89. 2.12. 2.02. Time in hr. Marketed formulation. F10 formulation. 1. 5.26. 4.56. 4.01. 3.59. 0.5. 3.52. 4.02. 1.5. 8.56. 4.25. 5.98. 5.58. 2. 9.18. 8.25. 8.01. 7.59. 1.0. 5.56. 6.56. 3. 10.65. 9.24. 9.15. 9.01. 1.5. 9.12. 11.60. 4. 22.59. 21.12. 19.02. 18.59. 5. 36.67. 35.74. 32.54. 29.48. 2. 13.71. 16.10. 6. 42.53. 41.98. 33.96. 32.42. 3. 19.84. 23.74. 7. 50.29. 49.58. 45.90. 43.06. 8. 55.59. 51.25. 50.12. 49.98. 4. 25.02. 29.58. 9. 65.64. 64.25. 61.25. 60.12. 5. 33.07. 37.03. 10. 72.25. 70.15. 70.12. 69.58. 11. 89.10. 85.19. 83.15. 80.01. 6. 37.05. 45.10. 12. 98.36. 95.29. 93.25. 92.56. 7. 42.64. 52.03. 8. 49.52. 61.03. 9. 54.22. 69.02. 10. 69.08. 79.09. 11. 78.64. 87.78. 12. 98.70. 98.93. Fig no: 7 Percentages Cumulative Drug Release at Accelerated Temperature. Conclusion. Comparison of Dissolution Profile between Optimized Formulation and marketed product The comparison of dissolution profile between optimized formulation F10 and marketed product was done as per procedure given as per in vitro release in material and methodology section. Graph of cumulative percentage drug release Vs time (hour) for both the optimized formulation F10 and Marketed product was plotted. From the results and discussions, amongst, the 16 different formulations designate as F-I,F-II,F-III,F-IV,F-V,F-VI,F-VII,FVIII,F-IX,F-X,F-XI,F-XII,F-XIII, F-XIV,F-XV and F-XVI the formulation in terms of sustained release and maximum percentage drug release, and the results are comparable with that of marketed formulation. This was further ascertained by the in vivo studies in rat models where formulation F10 has got no similar profile with that of the marketed formulation. To conclude, chitosan at a concentration ratio of 1:6 is suitable for preparing sustained release matrix tablets of glipizide SR.. Fig no: 8. Reference 1. 2. 3.. 4. Int. J. Pharm & Ind. Res. Vol – 01. Gwen MJ, Joseph RR. In: Banker GS and Rhodes,CT, (editors). Modern Pharmaceutics. 3rd ed. Marcel Dekker Inc, 1996, 575. Chein YW. Novel drug delivery systems. 2nd ed. Marcel Dekker Inc., 1997, 1-42. Ritchel WA. Biopharmaceutic and pharmacokinetic apects in the design of controlled release per-oral drug deliver system. Drug Dev Ind Pharm 15, 1989, 1073-1074. Reddy KR, Mutalik S, Reddy S. Once daily sustained release matrix tablets of nicorandinal. Issue – 01. Jan - Mar 2011.
(9) 51 formulation in vitro evaluation. AAPS Pharm Sci Tech 4, 2003, 1-9. 5. Mohammed AD, James LF, Michael HR, John EH, Rajabi-Siahboomi AR. Release of propranolol hydrochloride from matrix tablets containing sodium carboxy methylcellulose and Hydroxypropyl methyl cellulose. Pharm Dev Tech 4,1999, 313-324. 6. Jamzad S, Fassihi R. Development of controlled release low dose class II drug-glipizide. Int J Pharm 2006, 24-32. 7. Sweetman SC. Martindale, the complete drug reference. 34th ed. London: Pharmaceutical Press, 2007, 213. 8. Patel JK, Patel RP, Amin AF, Patel MM. Formulation and evaluation of glipizide microspheres. AAPS Pharm Sci Tech 6, 2005, 49-55. 9. Chowdary KPR, Rao YS. Design and in vitro and in vivo evaluation of mucoadhesive microcapsules of glipizide for oral controlled release. AAPS Pharm Sci Tech 4, 2003, 1-6. 10. Cooper J, Gunn C. Powder flow and compaction. In: Carter SJ, (editor). Tutorial pharmacy. New Delhi: CBS Publishers and distributors, 1986, 211-233. 11. Chowdary KPR, Rao YS. Design and in vitro and in vivo evaluation of mucoadesive microcapsules of glipizide for oral controlled release. AAPS Pharm Sci Tech 4,2003, 1-6.. Int. J. Pharm & Ind. Res. Vol – 01. 12. Cooper J, Gunn C. Powder flow and compaction. In: Carter SJ, (editor). Tutorial pharmacy. 1986, 21133. 13. Lachman L, Lieberman HA, Kanig JL. The theory and practice of industrial pharmacy. Philadelphia: Lea & Febieger, 1970, 68-9. 14. The Pharmacopoeia of India. New Delhi: Controller of Publication, 1996, 736. 15. Hadjioannou TP, Christain GD, Koupparis MA. Quantitative calculations in pharmaceutical practice and research. New York: VCH Publishers Inc., 1993, 345-8. 16. Bourne DW, Pharmacokinetics, In: Banker GS, Rhoides CT, (editors). Moder Pharmaceutics. Marcel Dekker Inc. 4, 2002, 67-92. 17. Satyanarayana S, Nitin M, Prasad K, Pharmacodynamic drug interaction of mexiletine with tolbutamide in rats, Indian J.Pharm. Educ. Res. 41(4), 2007, 342 - 346. 18. Rhodes CT, Carstensen T, Drug stability principle and practice 3rd edition. New work: 107, 2001, 21-46. 19. Basak S, Jayakumar Reddy B, Lucas Mani K, Formulation and release behaviour of sustained release ambroxol hydrochloride HPMC matrix tablet, Indian J.Pharm. Sci., 68 (5), 2006, 594-598.. Issue – 01. Jan - Mar 2011.
(10)
Figure
+3
Related documents
In the present study, the fatigue properties have been investigated in the Al-Mg-Mn alloy sheet consisting of the coarse-grained surface and the fine-grained center layers. The
Group 1 apparently disap- peared from North America shortly thereafter, during a period of relatively low E30 activity (Fig. 1 and 2), but it apparently continues to circulate in
In wild-type embryos at E12.5, TUNEL-positive cells were detected in the endolymphatic duct epithelium (Fig. 3A), the wall of the cochlear duct (Fig. 3A-D), the distal edge of the
INDEX WORDS: Black women, academy, network circles, sister circles, fictive kin networks, Black feminist thought, Critical Race theory, social capital theory... NARRATIVES ON THE
Figure 1. Ensemble of all 3 repetitions representing the value of every segment, * = Nautilus is significantly higher than Elastic 000. ~ E30%) is significantly higher than EO%. t NM
Processes we find to be over-represented by detected miRNA targets include: transcriptional control, translational control, cell-adhesion, enzyme regulation and apoptosis
All the new array elements were detected in Bpp5, from which the novel sequences were originally identi- fied, as well as in two other strains from sheep in New Zealand (Bpp3 and
In order to prove the theoretical analysis of this phenomena, the simulation of designed circuits has been introduced and developed utilizing two negative resistance
