http://www.sciencepublishinggroup.com/j/pamj doi: 10.11648/j.pamj.20170606.11
ISSN: 2326-9790 (Print); ISSN: 2326-9812 (Online)
Prediction of Petroleum Price Using Back Propagation
Artificial Neural Network Based on Chaotic Self-Adaptive
Particle Swarm Algorithm
Mengshan Li
1, Genqin Sun
2, Huaijin Zhang
1, Keming Su
1, Bingsheng Chen
1, Yan Wu
11
College of Physics and Electronic Information, Gannan Normal University, Ganzhou, China
2Library of Gannan Normal University, Gannan Normal University, Ganzhou, China
Email address:
[email protected] (Mengshan Li)
To cite this article:
Mengshan Li, Genqin Sun, Huaijin Zhang, Bingsheng Chen, Yan Wu. Prediction of Petroleum Price Using Back Propagation Artificial Neural Network Based on Chaotic Self-Adaptive Particle Swarm Algorithm. Pure and Applied Mathematics Journal. Vol. 6, No. 6, 2017, pp. 154-159. doi: 10.11648/j.pamj.20170606.11
Received: September 18, 2017; Accepted: October 11, 2017; Published: November 14, 2017
Abstract: Petroleum price are affected by some uncertainties and nonlinear factors, how to predict the price effectively is the
focus of the present study. In this paper, a 3 layers back propagation artificial neural network model based on particle swarm optimization algorithm combined with chaos theory and self-adaptive weight strategy is developed, the model structure is 7-13-1, and used to predict the petroleum price. By comparing with the other models, it shows that the model proposed in this paper has good prediction performance, the prediction accuracy and correlations are better.Keywords: Petroleum Price, Prediction Model, Particle Swarm Optimization, Neural Network
1. Introduction
In the entire system of the international petroleum industry, the change of petroleum price is affected by many complex factors, with an uncertain tendency and regularity. How to efficiently and accurately predict the petroleum prices has important significance in the petroleum industry, and researchers are increasingly paying attention to this field [1-3]. Traditionally, there are three main methods for predicting petroleum price [4-6]: the first one is based on the idea of optimal exploitation of resources. For example, Kurz [7] studies petroleum prices from the perspective of classical energy consumption; the second one is the time series analysis method. Robert [8], Yang [9], Salah and Hamid [10]use time series to analyze petroleum prices; the third one is based on Ulph [11]through the exploration of exhaustible resources, that is, starting from the petroleum market structure. Affected by various uncertain factors, the accuracy and adaptability of the model are poor through traditional prediction methods, and the deviation from the actual value is not satisfactory. In order to efficiently and accurately grasp the tendency and regularity of petroleum price change, it is one of the future research focuses in the petroleum industry system to study a
feasible, efficient and high-precision price forecasting model. From the view of the influence factors of petroleum price, the change shows a complex nonlinear relationship to a great extent. The large amount of information noise collected and acquired is very large and non numerical. These nonlinear features lead to relatively difficult for traditional research methods. In recent years, artificial neural network is widely used in solving complex nonlinear problems, the researchers also proposed some neural network prediction model based on the price of petroleum [12], such as Wong and Mohaghegh [13] using the ANN model in the petroleum storage, and achieved good results; Chaudhuri [14] using ANN algorithm established the petroleum purity appraisal model, and the forecast effect is better. Although the prediction effect of these models is better, the defects of BP algorithm, such as easy to fall into local optimization, make the model convergence speed and approximation is not very satisfactory.
particle swarm algorithm[20, 21]) are applied to ANN network training [22, 23], and a hybrid neural network model (HANN) is obtained. HANN has become a hot topic for researchers in petroleum price forecasting.
Through the above literature analysis, we can see that the improvement through BP and ANN and the application of the petroleum price prediction in the field still has more room for development [24]. For this reason, this paper want to avoid the particle swarm algorithm into local minima by improving particle swarm optimization algorithm through the use of chaos theory and adaptive weight adjustment strategy. Then applying the improved particle swarm optimization algorithm to train BP ANN, so that the convergence precision and convergence speed of the model can be improved. And applying the model to the field of petroleum price prediction to discuss its prediction accuracy and reliability.
2. Model
2.1. Chaotic Adaptive Particle Swarm Optimization Algorithm
Particle swarm optimization (PSO) is a classical group evolution algorithm. It has many advantages and has been applied to many fields. In the optimization process of algorithm, each particle represents a feasible solution to the problem of particle, it adjust its speed and position by three factors--the inertia speed, local extremum and global extremum, the formula is as follows:
ω
k +1 k k k k k
i,d i,d 1 i,d i,d 2 g,d i,d
v = v + c (p - x ) + c (p - x ) (1)
k +1 k k +1 i,d i,d i,d
x = x + v (2)
In the formula, ω is the inertia factor; C1 and C2 are the learning factors; rand () is the random number between (0, 1),
k i,d
v and xki,d are the velocity and position of the particle,
k i,d
p is the position of the individual pole of the particle, and
k g,d
p is the position of the global pole of the group.
In order to overcome the problems of the PSO algorithm easily falling into local extremum, this paper, which is based on adaptive strategy to realize the adjustment of the parameter of chaotic sequence, obtained chaotic adaptive particle swarm algorithm (CASPSO) through optimizing the chaotic sequences generated by the learning factors C1 and C2 using
chaotic maps. The adjustment formula of inertia weight factor
ω is:
max max min) k/kmax
ω ω= - Pgbest(k) / Plbestave - (ω −ω × (3)
In the formula, ωmax and ωmin represents the maximum and minimum values of inertia weight respectively; Pgbest(k)
represents the k iteration of the global optimal particle; the average value of particle local optimum is Plbestave; the current iteration number is K; the maximum number of
iterations is expressed as kmax;
Adjusting the learning factors C1, C2 by the Lorenz 's
equation generated by the chaotic sequences, the formula is as follows:
( )
dx
a x y dt
dy
rx y xz dt dz xy bz dt = − − = − − = − (4)
The control parameters in the formula are parameters a, b
and r, and the values are 10, 8/3, 28. The learning factor (C1,
C2) is defined as a formula:
1
2
( )
( )
c x t
c y t
= =
(5)
Because the chaotic variable has three characteristics of randomness, ergodicity and regularity, the diversity of the algorithm can be maintained, the premature convergence problem is effectively overcome, and the global search performance is improved.
2.2. Hybrid ANN Model
Combining the CSAPSO algorithm gained in this paper with BP algorithm applied in the ANN training process to optimize the network structure and weights. The model mainly uses CSAPSO to train the network, if it satisfies the local search conditions, that is, if the fitness function value changes little or no change in the iteration process, the local fast search is performed, and the BP algorithm is executed at this time. If the particle adaptation is better than the existing one in the local process, the particle swarm fitness is used to update the global optimum, and then the CSAPSO algorithm is repeated until the condition is satisfied. The CSAPSO-BP ANN performs the following steps:
(1) To initialize the particle group and BP value.
The position and velocity of particles in PSO algorithm are initialized. The initial position and velocity of the particles are generated randomly. The current position of each particle is used as the particle individual extremum, and the optimal value of the individual extremum is selected as the global optimal value.
(2) To calculate the adaptive value of group particles. (3) The adaptive value of each particle is compared with the adaptive value of the best position it has passed. If it is better, the current position is the best position of the particle.
(4) The adaptive value of each particle is compared with the adaptive value of the global best position, and if it is better, the current position is the global best position.
(5) The learning factor C1, C2 and inertial weight
ω
wereobtained respectively, and the velocity and position of the particles were updated and optimized
global best position is the optimal solution, saving the result and ending. Otherwise return to Step (2).
3. Experimental Model
3.1. Experimental Data
In this paper, the experimental data are derived from West Texas medium crude oil at an average monthly price of WTI,
which are shown in table 1. Factors have a major influence on the petroleum WTI crude oil price has 7 kinds, which are: OPEC crude oil supply; U.S. crude oil inventories; U.S. crude oil consumption demand; OECD petroleum consumption; OECD petroleum supply; China crude oil supply; China crude oil consumption. After screening and simplifying the experimental data, an experimental database containing 66 sets of data is established.
Table 1. Experimental Data (Unit: Petroleum Price is US Dollar / Barrel; the Others are Millions of Barrels).
ID
OPEC crude oil supply
U.S. crude oil inventories
U.S. crude oil consumption demand OECD petroleum consumption OECD petroleum supply China crude oil supply
China crude oil consumption
WTI price
Price time
1 33.38 1770 18.82 21.34 46.71 3.93 7.85 45.04 09.3
2 33.33 1795 18.72 21.26 46.05 3.92 7.65 50.37 2009.4
3 33.48 1812 18.67 20.95 44.97 3.99 8.7 55.77 2009.5
4 33.57 1829 18.21 20.66 43.39 3.97 8.17 68.63 2009.6
5 33.74 1839 18.83 20.63 45.09 4.02 8.78 64.82 2009.7
6 34.15 1842 18.63 21.28 45 3.99 8.39 69.43 2009.8
… … … …
62 34.75 1823 18.83 21.26 44.26 4.19 8.91 73.73 2010.6
63 35.05 1839 19.31 20.62 45.87 4.26 9.57 75.86 2010.7
64 35.03 1853 19.28 20.96 46.02 4.21 8.85 78.3 2010.8
65 35.14 1857 19.69 20.69 46.44 4.25 8.79 74.15 2010.9
66 34.82 1857 19.51 20.9 47.12 4.33 9.04 81.89 2010.10
The experimental data are divided into three subsets with different functions: training set, verification set and test set. First, the training set is used to train the network, the purpose is to optimize network parameters; secondly, using the validation set to verify the reliability of the network; finally, the actual test data set by simulation. In order to make the network generalization ability is guaranteed, there will be about 75% (50 group) data in the database to optimize the training of the network, and the data of the 16 groups of the rest divided into two sets, respectively, for the validation set and test set.
In this paper, the average absolute error (AAD), the standard deviation (SD) and the square correlation coefficient (R2) are used to evaluate the performance of the model in the prediction of the petroleum price of the HANN model. The accuracy of the evaluation by AAD and SD evaluation parameters, the evaluation parameter represents the size of the error between the predicted and actual values; the evaluation of the reliability of the R2 index, the evaluation index indicating the correlation between the predicted and actual values. Among them, AAD and SD are defined as formulas (6) and formulas (7):
1
Pr ( ) ( ) 1
( )
N
i
e i Exp i AAD
N = Exp i
−
=
∑
(6)2 1 1
(
)
N i SDN =
x
ix
=
∑
−
(7)In the upper model, N represents the number of samples, Exp(i) represents the actual value of the input model, and Pre(i) represents the model output prediction value, while x
represents the average value of the sample data xi.
According to the practical significance of the index, the smaller the accuracy evaluation parameters of AAD and SD,
the better the reliability index R2, which means that the performance of the prediction model is better.
3.2. Experimental Model
In this paper, using the classical 3 layer structure, aiming at specific problems of the oil price forecast, set up the network input node is 7, representing the 7 price impact index, namely OPEC crude oil supply, Chinese crude consumption, OECD petroleum supply, Chinese crude oil supply, OECD petroleum consumption, U.S. crude oil demand and U.S. crude oil inventories. Output layer output is WTI crude oil price, that is to say, the number of nodes in the output layer is 1. This paper adopts heuristic optimization method of hidden layer contains the number of nodes is analyzed, assuming that the number of hidden nodes set increased from 7 to 20, by 14 CSAPSO-BP heuristic optimization method ANN model, evaluate the parameter calculation of the 14 models obtained by the calculation results are shown in Table 2, the evaluation parameters through the table the good you can determine the number of hidden nodes.
Table 2. Statistical Data for Optimizing Network Structure.
Hidden node AAD R2 SD Fitness
7 0.0096 0.966 0.0966 4.72E-04
8 0.0089 0.9625 0.0975 4.12E-05
9 0.0080 0.9645 0.0943 3.23E-06
10 0.0074 0.9777 0.0911 4.57E-06
11 0.0064 0.9742 0.0910 5.83E-06
12 0.0068 0.9778 0.0898 4.31E-06
13 0.0062 0.9812 0.0788 6.11E-07
14 0.0077 0.9713 0.0891 7.45E-06
Hidden node AAD R2 SD Fitness
16 0.0092 0.9656 0.0963 9.82E-05
17 0.0977 0.9596 0.0965 7.78E-05
18 0.0098 0.9464 0.0953 9.37E-04
19 0.0099 0.9363 0.0942 8.64E-04
20 0.0102 0.9211 0.0955 9.88E-02
From table 2, it can be concluded that the network has the least error and the correlation coefficient is higher than that of the hidden layer when the node is 13. Therefore, the network model is optimal when the number of hidden layer nodes is 13.
4. Results and Discussion
In this paper, a hybrid ANN model (CSAPSO-BP ANN) with 3 layers of 7-13-1 structure is established. The model is trained by the experimental data, and the training data are trained by using 50 sets of training data in the database. The training results are shown in Figure 1. An ideal model in which the line represents the predicted value equal to the actual value, and the star type represents the predictive value of the model.
Figure 1. Correlations Between the Prediction Results and Experimental Data for Training Set.
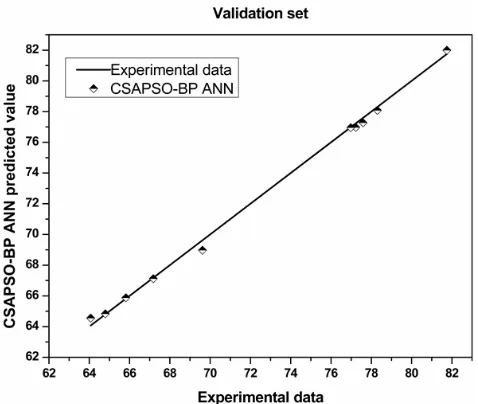
From the graph, it can be concluded that the training effect of CSAPSO-BP ANN model is good, and the predicted value and actual value of the model are relatively good. By training the set of trained models, the reliability of the model is verified by the set of independent sets. The model after verification should reach to two goals through the verification set: first, to verify the accuracy and reliability of the model; second, to achieve better performance of the model by reseting the network. The model validation results are shown in Figure 2. By further verification of the set, the CSAPSO-BP ANN model shows a good agreement between the predicted and experimental values, and improves the error and correlation of the model greatly.
Figure 2. Correlations Between the Prediction Results and Experimental Data for Validation Set.
CSAPSO-BP ANN model is relatively perfect obtained by training and testing of the network, to put forward the simulation ability of the model for the test by using the test set predicting simulation of CSAPSO-BP ANN model, the results are shown in Figure 3, the curve is the sample experimental data, the asterisk is the model predictive value.
Figure 3. Correlations Between the Prediction Results and Experimental Data for Testing Set.
As can be seen from Figure 3, the predictive value of the CSAPSO-BP ANN model is in good agreement with the experimental values in the test sample, so it can reflect the good simulation ability of the CSAPSO-BP ANN model.
shown in Figure 4, shows that the prediction accuracy of this model is higher and the comprehensive performance is better.
Figure 4. Correlation Between Predicted Values and Experimental Data of Each Model.
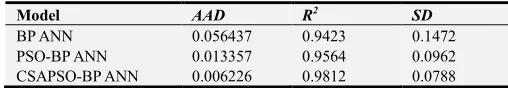
Comparing the statistical results as shown in Table 3. By comparing AAD and SD, we can conclude that the precision of CSAPSO-BP ANN model is the highest relative to the other two models. Comparing R2, we can conclude that the correlation of CSAPSO-BP ANN model is better than the other two.
Table 3. ARD, R2 and SD for Each Comparison Model.
Model AAD R2 SD
BP ANN 0.056437 0.9423 0.1472
PSO-BP ANN 0.013357 0.9564 0.0962
CSAPSO-BP ANN 0.006226 0.9812 0.0788
5. Conclusion
This paper establishes a hybrid neural network model (CSAPSO-BP ANN) based on CSAPSO algorithm, which is used to predict petroleum price. The prediction results of the model are in good agreement with the actual results, and the relative satisfactory prediction results are achieved. The simulation experiments show that CSAPSO-BP ANN can predict petroleum price. It has the advantages of stronger prediction ability, simple operation and lower prediction cost. It can provide a new solution for many engineering application problems.
Acknowledgements
The authors gratefully acknowledge the support from the National Natural Science Foundation of China (Grant Numbers: 51663001).
References
[1] M. Kendix, Walls, W. D. Estimating the impact of refinery outages on petroleum product prices. Energy Economics, 2010, 32(6): 1291-1298.
[2] J. Y. Seo Diversification of Crude Oil Import Sources as
Determinant Factors in the Pricing of Petroleum Products.
Energy Sources Part B-Economics Planning and Policy, 2013, 8(4): 320-327.
[3] D. Hosken, Silvia, L., Taylor, C. Does Concentration Matter? Measurement of Petroleum Merger Price Effects. American Economic Review, 2011, 101(3): 45-50.
[4] S. Wlazlowski, Giulietti, M., Binner, J., Milas, C. Price dynamics in European petroleum markets. Energy Economics, 2009, 31(1): 99-108.
[5] C. Hendrickson Petroleum prices and transportation engineering. Journal Of Transportation Engineering-asce, 2008, 134(9): 359-360.
[6] S. H. Kang, Yoon, S. M. Modeling and forecasting the volatility of petroleum futures prices. Energy Economics, 2013, 36: 354-362.
[7] H. D. Kurz, Salvadori, H. Classical economics and the problem of exhaustible resources Metro economica, 2001, 52(3): 282-296.
[8] P. Robert The long-run evolution of energy prices. The energy journal, 1999, 20(2): 1-27.
[9] C. W. Yang, Wang, M. J., Huang, B. N. An analysis of factors affecting price volatility of the US oil market. Energy Economics, 2002, (24): 107-119.
[10] A. Salah, Hamid, B. On the predictive accuracy of crude oil future prices. Energy Policy, 2004, (32): 1389-1394.
[11] A. M. Ulph, Folie, G. M. Exhaustible resource and cartels: an intertemporal nash-cournot model. The Canadian journal of economics,, 1980, 13(4): 645-658.
[12] N. I. Al-Bulushi, King, P. R., Blunt, M. J., Kraaijveld, M. Artificial neural networks workflow and its application in the petroleum industry. Neural Computing & Applications, 2012, 21(3): 409-421.
[13] S. Mohaghegh, Arefi, R., Ameri, S., Aminiand, K., Nutter, R. Petroleum reservoir characterization with the aid of artificial neural networks. Journal Of Petroleum Science And Engineering, 1996, 16(4): 263-274.
[14] U. R. Chaudhuri, Ghosh, D. Modeling & Simulation of a Crude Petroleum Desalter using Artificial Neural Network. Petroleum Science And Technology, 2009, 27(11): 1233-1250.
[15] S. Arefi-Oskoui, Khataee, A., Vatanpour, V. Modeling and Optimization of NLDH/PVDF Ultrafiltration Nanocomposite Membrane Using Artificial Neural Network-Genetic Algorithm Hybrid. ACS Combinatorial Science, 2017, 19(7): 464-477.
[16] A. S. Ghareb, Abu Bakar, A., Hamdan, A. R. Hybrid feature selection based on enhanced genetic algorithm for text categorization. Expert Systems With Applications, 2016, 49: 31-47. [17] M. A. Mohiuddin, Khan, S. A., Engelbrecht, A. P. Fuzzy particle swarm optimization algorithms for the open shortest path first weight setting problem. Applied Intelligence, 2016, 45(3): 598-621.
[19] N. Netjinda, Achalakul, T., Sirinaovakul, B. Particle Swarm Optimization inspired by starling flock behavior. Applied Soft Computing, 2015, 35: 411-422.
[20] K. R. Harrison, Engelbrecht, A. P., Ombuki-Berman, B. M. Inertia weight control strategies for particle swarm optimization. Swarm Intelligence, 2016, 10(4): 267-305. [21] H. R. Ahmed, Glasgow, J. I. The Agile particle swarm
optimizer applied to proteomic pattern matching and discovery.
Soft Computing, 2016, 20(12): 4791-4811.
[22] Y. J. Zheng, Chen, S. Y. Cooperative particle swarm
optimization for multiobjective transportation planning.
Applied Intelligence, 2013, 39(1): 202-216.
[23] M. W. Li, Kang, H. G., Zhou, P. F., Hong, W. C. Hybrid optimization algorithm based on chaos, cloud and particle swarm optimization algorithm. Journal of Systems Engineering and Electronics, 2013, 24(2): 324-334.