http://www.sciencepublishinggroup.com/j/ajrs doi: 10.11648/j.ajrs.20170502.11
ISSN: 2328-5788 (Print); ISSN: 2328-580X (Online)
Avalanche and Falling Rock Measurement Using
Piezoelectric Dynamics and Static Sensors
Nobuhiro Shimoi
1, *, Kazuhisa Nakasho
2, Carlos Cuadra
1, Masahiro Saijo
3, Hirokazu Madokoro
11Department of Machine Intelligence and Systems Engineering, Akita Prefectural University, Akita, Japan 2
Division of Electrical, Electronic and Information Engineering Graduate School of Engineering, Osaka University, Osaka, Japan
3Department of Development Planning, OYO Corporation, Ibaraki, Japan
Email address:
shimoi@akita-pu.ac.jp (N. Shimoi), nakasho@comm.eng.osaka-u.jp (K. Nakasho), carlos@akita-pu.ac.jp (C. Cuadra), madokoro@akita-pu.ac.jp (H. Madokoro)
*Corresponding author
To cite this article:
Nobuhiro Shimoi, Kazuhisa Nakasho, Carlos Cuadra, Masahiro Saijo, Hirokazu Madokoro. Avalanche and Falling Rock Measurement Using Piezoelectric Dynamics and Static Sensors. American Journal of Remote Sensing. Vol. 5, No. 2, 2017, pp. 10-15.
doi: 10.11648/j.ajrs.20170502.11
Received: June 20, 2017; Accepted: July 26, 2017; Published: August 25, 2017
Abstract:
Under certain weather conditions, avalanches can occur because of snow cover on a steep slope. Such avalanches can reach snow fences that are arranged as countermeasures. Furthermore, traffic is completely blocked when fences collapse and snow falls on a road. Therefore, prediction of avalanche occurrence is important, but such predictions are considered difficult. To resolve this difficulty, this study assessed measurement of the danger degree by measuring the risk to the avalanche fence at the time of snowfall and falling rock according to changes in the load and the impact of voltage proportional to the avalanche barrier deformation. This measurement system has fixed sensors attached with mounting brackets to a dedicated avalanche prevention measurement fence. It measures the pressure and vibration measurement of the snowfall at the time of avalanche or rock fall occurrence at the main structure of the fence. Furthermore, this fence made of lumber from thinned timber is useful as a defensive barrier countermeasure against avalanches and falling rock. It is designed to withstand a snow load of 3–5 [t / m2] during an avalanche.Keywords:
Insert Smart Sensor, Piezo Electric Sensor, Snow Accumulation Measurements Fence1. Introduction
In Japan, especially in snowy areas of the Hokuriku and Tohoku districts, avalanche disasters have occurred continually since ancient times. Such catastrophes caused many deaths and injuries in 1981, 1884, 1887, and 2005 and 2006 [1]. Currently, avalanche prevention fences and avalanche prevention forest countermeasures are arranged on steep slopes that have undergone avalanches in the past and which present high risks near major arterial roads. In addition, many places on steep slopes of coastal and mountain roads in our country require countermeasures against falling rock at limestone quarries that have used open-cut mining, crushed stone mining sites, and others. The necessary strength and the placement of protective walls and protective fences against falling rock must be estimated as accurately as possible to
sensors [4] [5], and image recognition systems are also being implemented [6].
2. New Measurement Technology Using
Measurement Fence
An avalanche detection system for road networks requires investigation of the following matters. To prohibit the entry of traffic vehicles by an alarm device and to signal a forced evacuation of local residents, it is necessary to detect avalanche occurrence reliably, even in harsh environments. Moreover, because many related locations are steep mountainous areas, concerns regarding on-site construction and security problems are cumulative. Additionally, it is difficult to secure budgets for avalanche problems. Huge investments are necessary to secure driver safety and to secure temporary storage facilities for evacuees when carrying out road closure and evacuation. To address these problems, realization of a safe and secure society that respects human life requires a simple and inexpensive measuring system that entails low construction expenses.
2.1. Comparison with Similar Measurement Methods
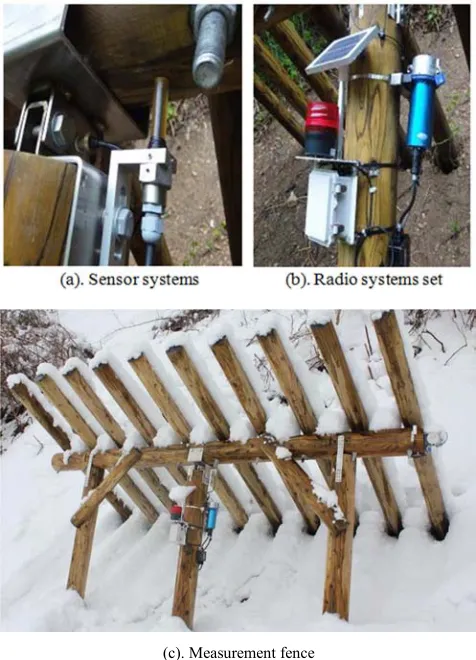
As similar observation methods used for avalanches, a sheet-like material (MFC) obtained by processing lead titan ate zircon ate (PZT) ceramics into a fiber shape and sandwiched between films can be used. Correlation between shock load and output voltage is strong, so measurements are possible. Moreover, output differences are small even in cold districts. Piles used for avalanche measurements used in the report have been implemented in attempts to bond this MFC to the interior of a polyurethane cylinder and to detect the avalanche impact load [7]. However, when using this method, depending on the avalanche occurrence area and location, it is necessary to prepare at least 50–100 measurement piles and to process data from individual measurement piles with a logger. The greatest difficulty is expected to arise in time series processing of large volume data and priority ordering of risks. As shown in the fence laying situation of Fig. 1, a measurement fence using lumber from thinned timber devised for this research is approximately 3360 mm long × 3800 mm wide × 3350 mm high. The equipment installation situation shown in Figure 1(a) depicts one set of a piezo-limit sensor and piezo vibration sensor fixed in the central part with dedicated metal fittings in Figure 1(b). Radio communication equipment for data transmission is arranged in the lower part of Figure 1(c). When transmitting the measurement result, the threshold value is set by the microcomputer from a value obtained from destructive testing of the measurement fence and its components. Information communication of unnecessary sensor output voltages is not set. In addition, because the sensor itself outputs voltage in proportion to the magnitude of the measurement result by shock or vibration, this sensor requires no power supply for measurements. As communication equipment, sensors (i-SENSOR; Applied Geology Co., Ltd.) that have been proven for outdoor
observations were used. As a data communication feature, transmission is performed only for output voltages exceeding a set threshold value. About one year of communication is guaranteed considering the large capacity communication and power consumption. An important shortcoming is the measurement fence size and weight, but the fence is designed to allow simplification and transportation by assembly work, so it is useful even in mountainous areas.
(c). Measurement fence
Figure 1. Avalanche fence for peril measurements.
2.2. Construction of Measurement Technology
details of the piezo limit sensor used for measuring static load. The piezoelectric limit sensor shown in Figure is a piezo film (DT-2-028k / L; Tokyo Sensor Co. Ltd.), which is fixed tightly in a rigid glass tube using ultraviolet curing (UV) urethane resin. After inserting the lead wire with a hole in the rubber stopper of the packing rubber, a connector is added for connection to the external cable. This glass tube is inserted into the metal holder with a gap for tolerance. The holder used for the sensor exterior can be changed to aluminum, brass, iron, or a similar material depending on the object to be measured. For sensors used in this test, a brass exterior was selected [8].
(a). Piezoelectric cable vibration sensor
(b). Structure of piezoelectoric cable
(c). Piezoelectric limit sensor
Figure 2. Characteristics structure of piezoelectric vibration sensor and piezoelectric limit sensor.
Figure 3 presents the magnitude of the vibration of the piezo vibration sensor and the measurement result of the output relation. Fixing the sensor to the vibration machine and changing the amplitude of the vibration from 0.25 to 1 mm and recording the relation between the frequency and the sensor output confirmed an extremely good proportional relation. These measurement results indicate the possibility of obtaining reliability in field tests using this sensor [9]-[11].
Figure 3. Relationship of frequency and vibration by sensor output.
2.3. Outline of Test Method
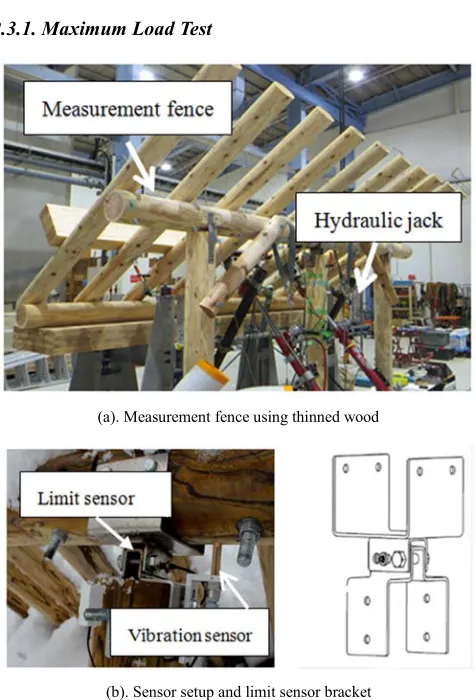
2.3.1. Maximum Load Test
(a). Measurement fence using thinned wood
(b). Sensor setup and limit sensor bracket
Figure 4. Measurement fence and sensor bracket shape.
deformation of each joint part and beam. As shown in Figure 4(b), the sensor mounting bracket and the piezo-limit sensor were inserted and fixed in the sensor holder portion, which is a dedicated metal fitting of the center post connecting portion. Loading force was applied in the retracting direction using the hydraulic jack to the test the measuring fence fixed to the frame. The relation of the piezo-limit sensor output and the loading force and displacement was measured.
2.3.2. Maximum Impact Test
To evaluate the detection characteristics such as falling rocks in the early stages of snowfall, the measurement fence shown in Figure 5(a) was tested indoors. The sensor was fixed to the metal fitting shown in Figure 5(b). Then measurements were conducted in the state of Figure 5(c). To simulate falling rocks, approximate measurements by impact energy were attempted when a sandbag collided with the central part of the measurement rail. Similarly to the static loading test, the impact vibration at the junction detection surface at the center of the rafter when the sand bag (weight 30 kg) is dropped from the upper 3.5 m of the fixed test measurement fence was measured by the acceleration sensor and the piezo vibration sensor. The measurement performance and characteristics of both sensors were compared and investigated.
3. Measurement Fence Performance
Evaluation Results
3.1. Result of Load Tests
(a). Sensors set on the fence
Figure 5. Experiment of falling energy test.
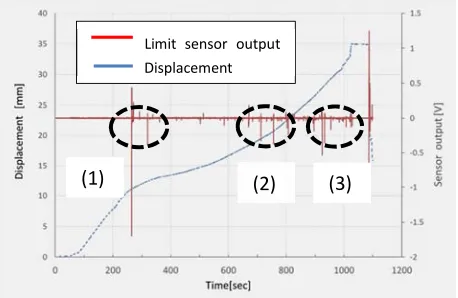
(a) Relation displacement between limit sensor out puts: (1) Beginning of destruction, (2) Complete destruction warning, and (3) Complete destruction.
(b). Relation loading weight between limit sensor out puts: (1) Beginning of destruction, (2) Complete destruction warning, (3) Complete destruction.
Figure 6. Result of measurement fence for destruction test.
The measurement fence is calculated from the maximum snowfall load of 1 [m2], which is the maximum snowfall measured in Niigata Prefecture. From this numerical value, it was designed and manufactured so that the maximum allowable load is destroyed completely at a load of 50–70 [kN]. Figure 6(a) depicts the relation between displacement and the piezo-limit sensor output. Figure 6(b) shows the relation between applied force and the piezo-limit sensor output. According to the test results, the beam displacement occurred as the load increased. The first large voltage output was recognized from the piezo-limit sensor at about 20 [kN] near the elliptical part shown in Figure 6(a). Because the rafter displacement at the central part at this time measures deformation of about 10–15 mm, it is regarded as the moment when the first destruction occurred within the design permission in the measurement fence. Next, in the vicinity of the ellipse (2) in the figure, the second large voltage output is recognized when it is about 45 [kN]. At this time, the displacement of the rafter shows deformation of about 18–20 mm. When it is about 70 [kN] near the elliptical part (3) in this drawing, which is complete destruction, the sensor shows the
Limit sensor output Displacement
third large output and the rafter displacement in the center shows a large value of 30–35 [mm], and the measurement fence is completely destroyed. The piezo limit sensor is a structure in which a glass tube and a piezo element are combined and inserted into a metallic protective tube. Because the piezo element sealed in the glass tube is fixed (normal condition), the sensor output is not measured. However, if displacements or static loads are greater, the glass tube will be partially damaged by the load applied to the glass tube. The voltage is output from deformation of the piezo element caused by the impact and the displacement of the metal fitting. From these results, it was inferred that this sensor can notify users of a dangerous situation for the measurement fence in three stages in real terms. In other words, prompt attention is necessary with the first output. Immediate danger is signaled if the second output is detected. Furthermore, the sensor output can be demonstrated within the numerical value of the maximum permissible load at the time of designing the initial measurement fence.
3.2. Results of Maximum Impact Test
Figure 7. Comparison of impact test by accelerometer and piezo vibration sensor.
Results of the drop impact test shown in Figure 7 are the results of estimation of impact energy by the piezo vibration sensor in the figure and the three-axis accelerometer by the mark. The left vertical axis represents the output of the accelerometer. The right vertical axis represents the output voltage and the approximation of the drop energy calculated from the outputs of the accelerometer and the piezo vibration sensor. Because the detection results of both sensors have a proportional relation and because the relation of the sensor output according to the magnitude of the impact vibration of the measurement fence is shown, the impact energy of the fall directly transmitted to the measurement fence was measured. It is regarded as the result. From these verifications, it is possible to detect shock vibrations such as falling rocks using measurement fences. It is considered that the size and frequency of falling objects such as falling rocks can be detected using piezo vibration sensors. However, it was judged difficult to ascertain the relation between detailed conditions such as the number and weight of falling rocks and the sensor output quantitatively. Future studies will incorporate mounting tests in the field based on results of this
test and verify the falling stone impact measurement on the slope. It is necessary to reconsider the level of the falling stone condition that can be detected and the setting threshold value of the piezo vibration sensor while checking the accelerometer output and the piezo vibration sensor.
We have devised a measurement fence system that combines both countermeasures and measurement for unprotected steep slopes where countermeasures such as avalanches and falling rocks are not feasible. This system can support observation of the occurrence of avalanches and falling rocks autonomously using effective utilization of thinned timber and an inexpensive measurement system and invite attention to the residents and vehicles in the vicinity.
Acknowledgements
This research was partially supported by JSPS KAKENHI Grant No. 16K12856, for which we express our appreciation.
References
[1] B. Hacarar, F. Bolo and R. Hagar, Bodies falling down on different slopes dynamic studies, Ninth International Conference Soil Mech. and Engineering, Vol. 2, pp. 91–95 (1977).
[2] O. Hangr and S. G. Evans, Engineering evaluation of fragmental rock fall hazard, Proc. of Fifth Int. Symposia. On Landslides, Lausanne, pp. 685–690 (1988).
[3] S. Iskura, K. Kawashima, T. Endou, T. Huskii, Snow avalanche detection and alarm systems using a vibration sensor, The Journal of the Japanese Society of Snow and Ice, Vol. 6, No. 4, 367–374 (2000).
[4] B. Leprettre, J.-P. Navarre, J. M. Panel, F. Touvier, A. Taillefer, and J. Roulle: Prototype for operational seismic detection of natural avalanches, Annals of Glaciology, Vol. 26, 313–318 (1998).
[5] K. Kawashima, Y. Kurihara, and K. Izumi: Investigation of collapse accidents of snow patches in Japan report on accident at Mt. Arasawa on August 1, 2004, and casualty analysis for the past 40 years, Japanese Society of Snow and Ice of Journal, Vol. 71, No. 6, 455–469 (2009).
[6] R. Sato, D. Takahashi, and S. Iikura: Development of portable type avalanche detector, RTRI Report, Vol. 30, No. 3, 17–22 (2016).
[7] V. Chritin, M. Rossi, and R. Bolognesi, Acoustic detection system for operational avalanche forecasting, Proc. International Snow Science Workshop, pp. 129–133 (1996).
[8] N. Shimoi, C. H. Cuadra, H. Madokoro and M. Saijyo: Vibration Analysis of Wooden Traditional Frames Using Finite Element Method and Measurements with a Simple Piezoelectric Cable Displacement Sensor, Transactions of the Japan Society of Mechanical Engineers (c), Vol. 79, No. 806, 3442–3453 (2013).
[10] T. Yamashita, T. Takamatsu, H. Tamai, Y. Takemoto and A. Matsumoto: Experimental study of rehabilitation technique of exposed column-base subjected to brace axial force, Proc. of Constructional Steel, Vol. 19, pp. 133–140 (2011).