Published online April 2, 2013 (http://www.sciencepublishinggroup.com/j/jeee) doi: 10.11648/j.jeee.20130101.13
An effective simulation technique to evaluate loss of load
expectation
Nahid-Al-Masood, Md. Khurram Monir Rabby, Mamun Rabbani, Mafruha Ahmed, Proteeti
Peya
Department of Electrical and Electronic Engineering, Bangladesh University of Engineering and Technology, Dhaka-1000, Bangladesh
Email address:
[email protected] (N. -Al-Masood), [email protected] (Md. K. Monir Rabby)
To cite this article:
Nahid-Al-Masood, Md. Khurram Monir Rabby, Mamun Rabbani, Mafruha Ahmed, Proteeti Peya. An Effective Simulation Technique to Evaluate Loss of Load Expectation. Journal Electrical and Electronic Engineering. Vol. 1, No. 1, 2013, pp. 29-34.
doi: 10.11648/j.jeee.20130101.13
Abstract
:
Risk index of loss-of-load expectation is traditionally used to determine generation adequacy. However, be-cause responsibility of generation installation and demand increases with different entities, both generation and load need to be examined to evaluate the resource adequacy of today’s deregulated power systems. An electric utility’s main concern is to plan, design, operate and maintain its power supply to provide an acceptable level of reliability to its users. This clearly requires that standards of reliability be specified and used in all three sectors of the power system, i.e., generation, trans-mission and distribution. Reliability indices have been defined for the three sectors separately as well as for the bulk power system. Reliability criteria may be determined at the selected load points in the system for different combination of genera-tors and transmission line failures. This paper presents an effective simulation method for the reliability assessment of re-liability index, loss-of-load expectation (LOLE). This method is applied to Bangladesh Power System (BPS). BPS has a total installed capacity of around 6550 MW. The maximum demand of BPS is about 5700 MW. The relevant data of the generators and hourly load profiles are collected from the National Load Dispatch Center (NLDC) of Bangladesh and relia-bility index ‘LOLE’ is assessed for the last six years.Keywords:
Installed Capacity, Recursive Method, Forced Outage Rate (FOR), Bangladesh Power System (BPS), Prob-ability Density Function (PDF), LOLE1. Introduction
The optimal design of composite power system expan-sion planning is an important part of the overall planning task of electric power system under competitive electricity market environments. One of main keys of the successful generators and grid expansion planning comes from optim-al reliability level/criteria decision. A methodology of tak-ing the decision of the optimal reliability criteria (LOLE) for an optimal composite power system expansion planning is used considering generation and transmission systems simultaneously [1]. Hence, risk-based planning and market decision makings have to address both generation and transmission jointly. A procedure is used to combine both dynamic optimization and Monte Carlo simulation to gen-erate a vector space of solution, from which optimal solu-tions for different objectives can then be easily obtained. Determining locational capacity and transmission require-ments serves the example of such an application [2].
30 Nahid-Al-Masood et al: An effective simulation technique to evaluate loss of load expectation
in the development and utilization of wind-based distri-buted generation (DG) work with a new implementation of the islanding mode of operation in the assessment. The results are used to make the comparison the outcomes of the two proposed techniques; however, MCS requires much longer computational time. Moreover, the effect of island-ing appears in the improvement of the loss of load expecta-tion (LOLE) and loss of energy expectaexpecta-tion (LOEE) [6]. In paper [7], Southwest Power Pool’s (SPP) experience in analyzing generation adequacy is presented and this analy-sis is conducted by examining a common reliability index, Loss of Load Expectation (LOLE). According to North American Electric Reliability Corporation (NERC), smart grid reliability is defined by resource adequacy and opera-tional security and such level of reliability is often meas-ured by the Loss of Load Expectation (LOLE) with the typical criterion of 1 day in 10 years [8]. The optimum cal-culation of battery size when used as energy storage in standalone systems with renewable energy resources focus in this analysis is on the effect of battery charg-ing/discharging characteristics on system reliability and cost. The Loss of Load Expectation (LOLE) index to eva-luate the reliability of a standalone system consisting of wind turbines and battery storage system by taking the charging efficiency and discharge rate into consideration, the resulted LOLE is lower than what is expected [9]. In [10], the loss-of-load-expectation (LOLE) is considered as a good working group for the bulk power system operation and analysis. The reliability impacts of various levels of wind power penetration are investigated and compared with conventional power generation units. In this analysis, the percentage of penetration level is used to consider the corresponding LOLE situation LOLE [11]. An intermittent generation adequacy assessment including wind energy conversion systems (WECS) at multiple locations is de-scribed in [12]. In this analysis effective load-carrying ca-pabilities (ELCC) obtained using the loss of load expecta-tion (LOLE) and the loss of load frequency (LOLF) for a power system containing WECS are illustrated and com-pared. In the stochastic unit commitment, loss-of-load-expectation (LOLE) is included as a constraint for calculat-ing the cost of supplycalculat-ing the reserve [13]. In the analyses of ISO New England that has developed several means of presenting information that summarizes the need for future system development by market participants, loss of load expectation (LOLE), operable capacity, fuel diversity, envi-ronmental emissions, and congestion projections have been included [14]. As a basis of CBM calculation LOLE is ana-lyzed in [15, 16]. Aging characteristics of system compo-nents may impact the calculation of commonly used relia-bility indices such as loss of load expectation (LOLE) are described in [17]. The effect of islanding appears as an improvement of the loss of load expectation (LOLE) and loss of energy expectation (LOEE) [18]. A new method has been proposed in [19] to determine the capacity credit for renewable resource in the framework of resource adequacy. For this reason, optimization model is developed first to
calculate the minimum resource procurement based on the system LOLE (Loss of Load Expectation) criterion [19]. According to the load growth of various types of customers, the loss of load expectation (LOLE) of the study distribu-tion system is analyzed by the integradistribu-tion of probabilistic PV power generation model and the risk model of main transformer outage [20].
Reliability index ‘LOLE’ is assessed for the crisis of electrical demand in Bangladesh which is increasing rapid-ly due to population and industrial growth. LOLE gives the probable idea of any loss of load occurring in Bangladesh power system due to the scarcity of available generation. In this paper LOLE of BPS is evaluated for last six years to determine the reliability of the system.
2. Generator and Load Model of BPS
2.1. Generator Model
Simply, a generating unit for continuous operation is a Run-Fail-Repair-Run cycle that states that every generator has two states. They are— i) Unit availability and ii) Unit unavailability or forced outage rate (FOR). The unit availa-bility means the long term probaavaila-bility that the generating unit will reside in on state and unit unavailability or FOR means the long term probability that the generating unit will reside in off state.
Mathematically FOR can be defined as,
r
m
m
q
+
=
(1)Where, q = FOR
r= average run time of the generator
m= average down time of the generator
Unit availability of a generating unit (p) can be defined as,
r
m
r
p
+
=
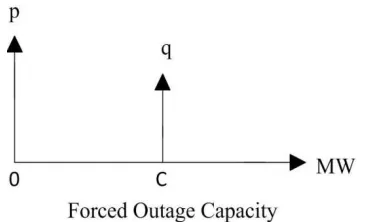
(2)For a generating unit with capacity = C MW and FOR = q and unit availability = p, the probability density function (PDF) of forced outage capacity is shown in Figure 1.
BPS has a total installed capacity of
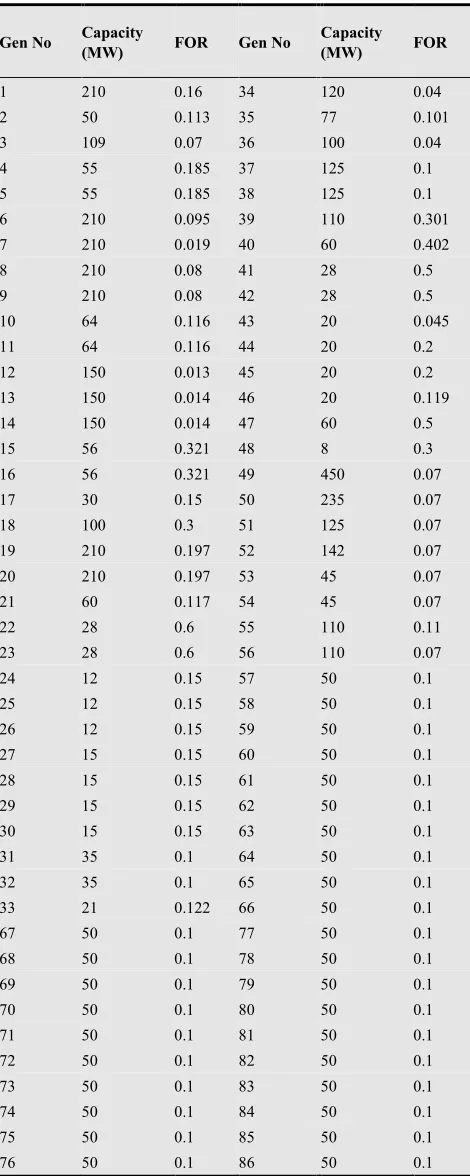
The individual capacity and FOR of the generators are shown in Table 1.
Table 1. capacity and for of the generators o
Gen No Capacity
(MW) FOR Gen No
1 210 0.16 34
2 50 0.113 35
3 109 0.07 36
4 55 0.185 37
5 55 0.185 38
6 210 0.095 39
7 210 0.019 40
8 210 0.08 41
9 210 0.08 42
10 64 0.116 43
11 64 0.116 44
12 150 0.013 45
13 150 0.014 46
14 150 0.014 47
15 56 0.321 48
16 56 0.321 49
17 30 0.15 50
18 100 0.3 51
19 210 0.197 52
20 210 0.197 53
21 60 0.117 54
22 28 0.6 55
23 28 0.6 56
24 12 0.15 57
25 12 0.15 58
26 12 0.15 59
27 15 0.15 60
28 15 0.15 61
29 15 0.15 62
30 15 0.15 63
31 35 0.1 64
32 35 0.1 65
33 21 0.122 66
67 50 0.1 77
68 50 0.1 78
69 50 0.1 79
70 50 0.1 80
71 50 0.1 81
72 50 0.1 82
73 50 0.1 83
74 50 0.1 84
75 50 0.1 85
76 50 0.1 86
2.2. Load Model and Load Duration Curve (LDC)
BPS has a total installed capacity of around 6550 MW. The individual capacity and FOR of the generators are
capacity and for of the generators of BPS
Capacity (MW) FOR
120 0.04
77 0.101
100 0.04
125 0.1
125 0.1
110 0.301
60 0.402
28 0.5
28 0.5
20 0.045
20 0.2
20 0.2
20 0.119
60 0.5
8 0.3
450 0.07
235 0.07
125 0.07
142 0.07
45 0.07
45 0.07
110 0.11
110 0.07
50 0.1
50 0.1
50 0.1
50 0.1
50 0.1
50 0.1
50 0.1
50 0.1
50 0.1
50 0.1
50 0.1
50 0.1
50 0.1
50 0.1
50 0.1
50 0.1
50 0.1
50 0.1
50 0.1
50 0.1
Load Duration Curve (LDC)
In order to calculate the load model of BPS, daily peak loads are collected from National Load Dispatch Center (NLDC) of Bangladesh. The occurrence probability of a specific load is then calculated for a specific ye probability of occurrence of a specific load is calculated as,
P
Where,
Pg= Probability of occurrence of a load
Ng= No. of occurring days of that load in the observ
tion period of 1 year
Nt= Total no. of days in the observation period
Figure 2 shows the load vs. % time plot of BPS of year 2012.
Figure 2. Load vs. % time
3. Analysis Technique
3.1. Capacity Outage Probability
The COPT is a table contains all the cap
ascending order of outages magnitude. Each outage (capa ity state) is multiplied by its probability. If the system co tains identical units, Binomial distribution can be used. If the units are not identical, the procedure deals with all states.
3.1.1. Recursive Algorithm
In case of large system, more practical approach is r cursive technique which is described in what follows
The recursive expression for a state of X MW on forced outage after the addition of a generating unit of
MW with forced outage rate U is given by,
X p X
p( )= ′( )(1−
Where, p(X) = the individual state probability. If X is less than C,
In order to calculate the load model of BPS, daily peak loads are collected from National Load Dispatch Center (NLDC) of Bangladesh. The occurrence probability of a specific load is then calculated for a specific year. The probability of occurrence of a specific load is calculated as,
t g g
N
N
P
=
(3)= Probability of occurrence of a load
= No. of occurring days of that load in the
observa-Total no. of days in the observation period
2 shows the load vs. % time plot of BPS of year
vs. % time curve of BPS
Technique
Capacity Outage Probability Table (COPT)
The COPT is a table contains all the capacity states in an ascending order of outages magnitude. Each outage (capac-ity state) is multiplied by its probabil(capac-ity. If the system con-tains identical units, Binomial distribution can be used. If the units are not identical, the procedure deals with all the
case of large system, more practical approach is re-cursive technique which is described in what follows
The recursive expression for a state of X MW on forced outage after the addition of a generating unit of capacity C MW with forced outage rate U is given by,
u C X p
u)+ ′( − )
− (4)
32 Nahid-Al-Masood et al: An effective simulation technique to evaluate loss of load expectation
0 ) ( − =
′ X C
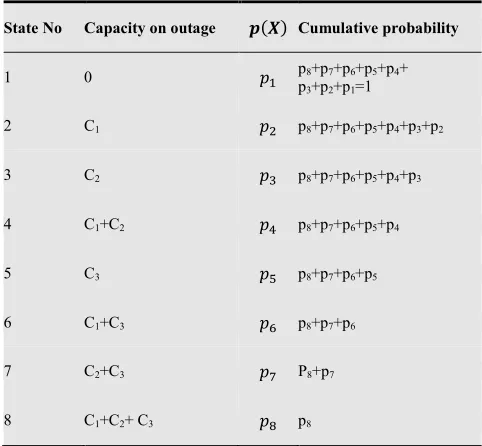
p (5) Consider a power system with three generators of capac-ity C1, C2 and C3. Unit’s availability is a1, a2 and a3,
respec-tively and FOR is u1, u2 and u3, respectively. The steps of
recursive algorithm for this small system are presented below in tabular format.
Table 2 1st unit is added
State No Capacity on outage
1 0 1 1 0
2 C1 0 1 1
Table 3 2nd unit is added
State No Capacity on outage
1 0 1 0
2 C1 1 0
3 C2 0 1
4 C1+C2 0 1
Table 4 3rd unit is added
State No Capacity on outage
1 0 1 0
2 C1 1 0
3 C2 1
4 C1+C2 1
5 C3 0 1
6 C1+C3 0 1
7 C2+C3 0 1
8 C1+C2+ C3 0 1
This is apparent from above calculation that for n ma-chine there will be 2n states to calculate. But in practical case it is improbable to find 2n number different states. If any two or more states have similar values their probability will be added under same state. As for an example, in table 4, if C1= C2 then state 2 and 3, 6 and 7 will be equal. In that case at state 2 value of probability is similar to at state 3. Similarly at state 6, probability is similar to at state 7. Thus there is no need to have state 3 and 7 for further con-sideration. Numbers of states are reduced to 6. This method is applied in every step of unit addition. As a result total numbers of states reduce by a considerable number.
After considering all the states, they are sorted in as-cending order and cumulative probabilities are calculated. A sample calculation is shown in Table 5.
Table 5. sample calculation of cumulative probability
State No Capacity on outage Cumulative probability
1 0 p8+p7+p6+p5+p4+
p3+p2+p1=1
2 C1 p8+p7+p6+p5+p4+p3+p2
3 C2 p8+p7+p6+p5+p4+p3
4 C1+C2 p8+p7+p6+p5+p4
5 C3 p8+p7+p6+p5
6 C1+C3 p8+p7+p6
7 C2+C3 P8+p7
8 C1+C2+ C3 p8
3.2. Loss of Load Expectation (LOLE)
The LOLE risk expectation index is the most widely ac-cepted and used probabilistic method in system reliability evaluation for generating systems. Two models are required and employed. One is the previously studied Load Dura-tion Curve (LDC), and the other is the COPT. These two models are convolved (combined) in the process. The units of the LOLE are in days per year (d/y).
LOLE can be calculated as,
(
)
∑
>
=
L
Capacity
y
d
p
t
LOLE
k k max (6)Where, pk is the probability of kth capacity-in, tk is the
duration that load demand exceeds the kth capacity-in and n is the number of state of capacity-in.
A sample calculation is shown in Table 6
Table 6. sample calculation of lole
Cap on out (1)
Probability (2)
Time, ti (%)
(3)
Loss of load expected (2 3)
0 0 0
C1 0 0
C2 t3
Cn tn
= 1.0000 = ∑,,
so loss of load expectation is found.
If 100% of time represents 365 days, the LOLE will be,
(
pt
)
(
d
y
)
LOLE
/
100
365
×
=
∑
(7)4. Results
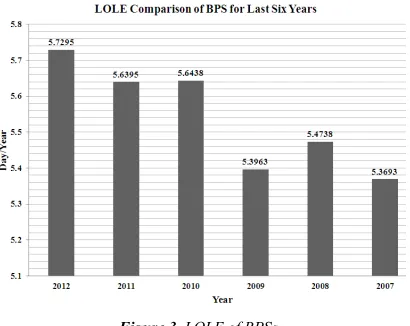
BPS has a total installed capacity of around 6550 MW. Using the analysis technique presented in this paper, LOLE of BPS is evaluated from year 2007 to 2012. Table 7 presents the results.
Table 7. LOLE of BPS
Year LOLE (d/y)
2012 5.7295
2011 5.6395
2010 5.6438
2009 5.3963
2008 5.4738
2007 5.3693
Graphically the results are shown in Figure 3.
Figure 3. LOLE of BPSs
Reliability of a system is good if LOLE is low. With the increasing of demand, if the generation of the system is not increased then LOLE will be further increased which indi-cate the overall system instability. From Figure 2, in 2007 LOLP was 5.3693 (d/y) which is considerably high. The following year in 2008 LOLE increased as demand in-creased but capacity remains almost same. In the very next year new generators were added and total capacity in-creased. Thus LOLE decreased to 5.3963 (d/y) in 2009. This capacity was same for next year so that LOLE in-creased with on-going power demand. With that amount of generation, LOLE didn’t fall significantly because demand increased extensively due to the development in rural areas, industries and communication sector. In 2011 total capacity increased with the increasing generators. So LOLE im-proved comparatively. But in 2012, due to the development
of industrialization and also the extension of urbanization, the demand of electrical energy has been increased signifi-cantly with respect to the increase in generators. As a result, the value of LOLE increased significantly.
5. Conclusions
Application of the reliability analysis techniques that have been widely used and accepted by the power industry allows for meaningful calculation of the effective capacity of variable generation resources. The impact of probabilis-tic power generation and the corresponding peak demands by power systems to the capacity expansion planning of main transformers is to meet the service reliability. A prob-abilistic reliability criterion, LOLE is used in this study. The system LOLE over the study years is determined by considering the growth rate of area peak loading and the available generation capacity. The procedure is used to compare the relative contributions and tradeoffs between transmission and generation to achieve a certain system risk for a particular period of time. The risk index deli-neates outages from transmission and generation inadequa-cy. The simulation results show a considerably high LOLE (5.7295 d/y in 2012) that indicates the poor reliability of the power system of Bangladesh. Lower reliability level causes the probability of loss continuity of the power sys-tem. To overcome this situation, system maintenance need to be high and loss of distribution need to be minimized. Additional generator association with the defaulted system can improve the overall system reliability. For the future further work, these reliability modeling and analysis tools can eventually be used to propose a new methodology of assessing the capacity credit of renewable generators and possibly the capacity credit of other intermittent energy sources.
References
[1] Jaeseok Choi; Thomas, R.; Zhifang Wang; El-Keib, A.; Billinton, R.; , "A study on probabilistic optimal reliability criterion determination in composite power system expan-sion planning," Power Engineering Society General Meet-ing, 2005. IEEE , vol., no., pp. 1277- 1284 Vol. 2, 12-16 June 2005
[2] Rau, N.S.; Fei Zeng; , "Dynamic optimizations of Monte Carlo simulation to assess locational capacity, transmission, and market parameters," Power Systems, IEEE Transactions on , vol.21, no.1, pp. 34- 42, Feb. 2006
[3] Scott Brown; William K. Marshall;, "Maritimes Area Wind Integration Study," Electrical and Computer Engineering, 2006. CCECE '06. Canadian Conference on , vol., no., pp.670-675, May 2006
34 Nahid-Al-Masood et al: An effective simulation technique to evaluate loss of load expectation
[5] Miller, N.W.; Jordan, G.A.; , "Evaluating wind capacity value in New York and California," Power and Energy So-ciety General Meeting - Conversion and Delivery of Elec-trical Energy in the 21st Century, 2008 IEEE , vol., no., pp.1-7, 20-24 July 2008
[6] Atwa, Y.M.; El-Saadany, E.F.; Guise, A.-C.; , "Supply Ade-quacy Assessment of Distribution System Including Wind-Based DG During Different Modes of Operation," Power Systems, IEEE Transactions on , vol.25, no.1, pp.78-86, Feb. 2010
[7] Al-Alawi, Ameer; Nagle, Makarand; Zhu, Jinxiang; , "Uti-lizing reliability indices to study generation adequacy," Transmission and Distribution Conference and Exposition, 2010 IEEE PES , vol., no., pp.1-5, 19-22 April 2010 [8] Litvinov, E.; "What is reliable smart grid?" Power and
Energy Society General Meeting, 2011 IEEE , vol., no., pp.1-2, 24-29 July 2011
[9] Delavaripour, H.; Karshenas, H.R.; Bakhshai, A.; Jain, P.; , "Optimum battery size selection in standalone renewable energy systems," Telecommunications Energy Conference (INTELEC), 2011 IEEE 33rd International , vol., no., pp.1-7, 9-13 Oct. 2011
[10] Ford, Andrew P.; Heath, Brandon; , "LOLE best practices working group," Power and Energy Society General Meet-ing, 2012 IEEE , vol., no., pp.1-5, 22-26 July 2012
[11] D'Annunzio, C.; Santoso, S.; , "Wind power generation reliability analysis and modeling," Power Engineering So-ciety General Meeting, 2005. IEEE , vol., no., pp.35-39 Vol. 1, 2005
[12] Wangdee, W.; Billinton, R.; , "Considering load-carrying capability and wind speed correlation of WECS in genera-tion adequacy assessment," Energy Conversion, IEEE Transactions on , vol.21, no.3, pp.734-741, Sept. 2006 [13] Lei Wu; Shahidehpour, M.; Tao Li; , "Cost of Reliability
Analysis Based on Stochastic Unit Commitment," Power
Systems, IEEE Transactions on , vol.23, no.3, pp.1364-1374, Aug. 2008
[14] Henderson, M.; Wong, P.; Platts, J.; Burke, R.; , "Planning for reliability, economics, and the environment in a deregu-lated market," Power and Energy Society General Meeting - Conversion and Delivery of Electrical Energy in the 21st Century, 2008 IEEE , vol., no., pp.1-9, 20-24 July 2008 [15] M. M. Othman, A. Mohamed, and A. Hussain, “Available
transfer capability assessment using evolutionary program-ming based capacity benefit margin,” Int. J. Elect. Power Energy Syst., vol. 28, no. 3, pp. 166–176, Mar. 2006. [16] Ramezani, M.; Haghifam, M.-R.; Singh, C.; Seifi, H.;
Mog-haddam, M.P.; , "Determination of Capacity Benefit Margin in Multiarea Power Systems Using Particle Swarm Optimi-zation," Power Systems, IEEE Transactions on , vol.24, no.2, pp.631-641, May 2009
[17] Hagkwen Kim; Singh, C.; , "Reliability Modeling and Si-mulation in Power Systems With Aging Characteristics," Power Systems, IEEE Transactions on , vol.25, no.1, pp.21-28, Feb. 2010
[18] Atwa, Y.M.; El-Saadany, E.F.; Salama, M.M.A.; Seethapa-thy, R.; Assam, M.; Conti, S.; , "Adequacy Evaluation of Distribution System Including Wind/Solar DG During Dif-ferent Modes of Operation," Power Systems, IEEE Transac-tions on , vol.26, no.4, pp.1945-1952, Nov. 2011
[19] Songzhe Zhu; Yi Zhang; Chowdhury, A.A.; , "Capacity credit of wind generation based on minimum resource ade-quacy procurement," Industry Applications Society Annual Meeting (IAS), 2011 IEEE , vol., no., pp.1-6, 9-13 Oct. 2011