Copyright © 2012 (Balázs Bodó & Zoltán Lakatos). Licensed under the Creative Commons Attribution Non-commercial No Derivatives (by-nc-nd). Available at http://ijoc.org.
Theatrical Distribution and P2P Movie Piracy:
A Survey of P2P Networks in Hungary Using Transactional Data
BALÁZS BODÓ
Budapest University of Technology and Economics (Hungary)
ZOLTÁN LAKATOS
Eötvös Loránd University (Hungary)
This article examines what appears to be the most important factor shaping file sharing: the failure of traditional cultural markets to efficiently supply the demand in the online environment. Its findings are based on tracking the traffic of movies on three Hungarian P2P networks. This dataset is then matched with cinematic distribution data of the films tracked in P2P transactions. Central to our analysis is the assessment of two piracy paradigms: substitution and shortage, that is, whether pirated content is available through legal or only illegal channels. Shortage-driven downloaders are found to outnumber those downloading only current theater releases. Nonetheless, the supply of films available for downloading is more affected by parameters of cinematic distribution than it is by box office success. Therefore, part of the sales effort directly contributes to propping up piracy.
Introduction
Although the unauthorized reproduction of someone else’s creative output for fame or for profit is as old as creativity itself (Alford, 1995; Lendvai, 2008), it was the advent of the technologies of mass reproduction that has made it an everyday, large-scale phenomenon. Even though the reasons that
brought pre-Internet pirates into existence vary greatly (Bodó, 2011a, 2011b) there is one thing that is common to all of them: their love of, and quest for, profit.
Online, peer-to-peer file swapping is unique in the sense that many of those who participate in it are not driven by the prospect of direct monetary gains. If monetary incentives do not explain P2P file sharing, we have to examine other factors that drive this activity. This article examines what appears to be the most important factor shaping online file sharing: the failure of traditional markets1. It seeks to
determine which factors under the control of well-established institutions engaged in the marketing, distribution, retailing, and lending of cultural goods leave a sizeable demand in the market unserved. We also identify specific points of failure that foster the emergence of do-it-yourself solutions that are, in this case, also piratical.
With the identification of such failures, we hope to serve several aims. First, to explain why P2P file sharing is so popular. Second, to urge the traditional actors to improve the aspects of their businesses that most contribute to these market failures. Third, to help policy makers devise a consumer- and citizen-friendly policy environment in which consumers and citizens in cultural markets are not prosecuted and punished for P2P file sharing if the traditional actors do not, or—perhaps due to structural deficiencies— simply cannot take appropriate action.
The Focus and Scope of the Study
This article presents our findings from measuring the traffic of movies on three Hungarian, BitTorrent2-based, file-sharing networks between May and June 2008. During this observation period, we
tracked new titles that appeared on these networks, the location of individual users, and the instances of users downloading, seeding, and uploading these titles. Therefore, we are able to tell who downloaded what from where and for how long. We compare this dataset to another set of databases that tracks the market performance of a traditional movie distribution system—cinemas.3
1 In economics, market failure is a sign of the inefficient allocation of goods. It can be caused by
information asymmetries, non-competitive markets, externalities or public goods, all of which are relevant in the case of cultural markets. In the context of the article we interpret market failure as the demand that could be, but is not legally supplied.
2 BitTorrent is a peer-to-peer file-sharing technology that makes the distribution of large files among a
large number of individuals fast and efficient.
3 The main reasons for focusing on movies rather than on music are: the lack of data on the legal markets
The Transformation of Film Markets
New Logics of Distribution
New gadgets, new middlemen, and new business models transform the way cultural works are distributed and exhibited in the digital world. The most radical transformation of the distribution of audiovisual content has occurred in television and in video rental markets. In the model of what Csigó (2009) calls “convergent television,” the producers of audiovisual content attempt to surpass the closed garden approach of content distribution by making their content available on many different online channels—from the pay-per-download iTunes store to the ad-supported website hulu.com. This enables content to resurface and circulate in contexts defined by viewers and not by the producers or professional middlemen responsible for contextualizing and programming traditional content flows. The logic of convergent television relies on the activity and loyalty of fans in the distribution process, meaning that users can create program flows and repackage programs to meet their own tastes and preferences.
Such a transformation of the legal distribution logic is hardly noticeable in the movie industry. The online multichannel availability of cinematic works is still characterized—at least in Hungary and other less developed and less important markets—by many limitations:
• Format scarcity. Offline distribution channels offer titles in a wide variety of formats from the IMAX format to DVD rental. Such a variety is missing from online distribution.
• Pricing problems. Rightsholders’ revenue expectations limit online pricing options, with the choice often being between a single pay-per-view price and the free black market.
• The size of the legal catalog is limited. A significant chunk of the back catalog, as well as local titles, niche works, older titles, and midlist titles (to borrow a term from the publishing industry), are not yet available via online channels. In Hungary, online video rental services typically offer films within the small window of the three to four months that follows the three- to six-month period after the DVD release. This results in a limited, constantly changing—and therefore unpredictable and unreliable—online supply.
• Timing problems. In the case of new releases, consumers from around the globe are exposed to the marketing aimed at the most important Western markets. This exposure inevitably generates demand on local, non-Western markets that in most cases need to wait a considerable amount of time before the producers are willing to sell their wares there.
In each of these dimensions, P2P networks have the competitive edge over legitimate online services, meaning that it is not only access options that compete (free vs. non-free, legal vs. illegal, with or without digital rights management, etc.), but distribution logics as well. This latter dimension is usually missing from the analysis of P2P networks.
Changes in the Hungarian Movie Distribution Infrastructure
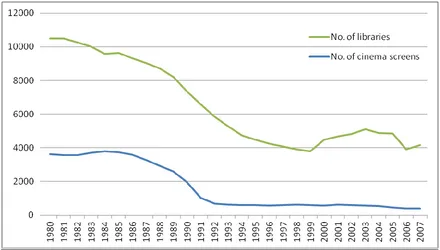
[image:4.612.80.520.314.564.2]To put the current state of the movie distribution infrastructure in Hungary into perspective, one needs to return to the decade before 1989. Due to seemingly limitless state sponsorship and to the ruling party elite’s strong cultural drive (György, 2005), Hungary enjoyed a dense network of libraries, cinemas, and other cultural institutions. Most villages had some kind of a multifunctional institution, a small cultural center that served as a concert or meeting hall, but that also could be converted into a screening hall. The high number of cinema screens (and libraries) during the 1980s reflects this situation.
Figure 1. The decline of the number of libraries and cinema screens after the post-communist transition.
As it is shown in Figure 1, with the collapse of the planned economy in 1989, the financing of this network came to a close with dramatic consequences:
The number of screens shrank by 90% during the 1990s.
The remaining screens relocated to bigger urban centers leaving (in 2006) as much as 99% of villages and 70% of (small) towns without a cinema screen. On another level, 57% of settlements within Hungarian statistical regions do not have a cinema (Borsos, 2007).
The screens in urban centers are increasingly located in shopping malls and operated by a handful of U.S.-based companies. In the year of our study, such multiplexes controlled 49% of all screens and 50% of all seats, they sold 76% of all tickets, and they claimed 84% of all revenues. It goes without saying that multiplexes have a fundamental effect on what is being shown in cinemas, skewing movie supply toward popular U.S. titles.
Public subsidies aimed at reconstructing smaller art house cinemas (that show movies outside of the mainstream culture) did nothing to change the uneven distribution of cinemas; rather, it resulted in upgrading already established cinema institutions without developing new ones. (Borsos, 2007)
In the last two decades, movie theaters, along with other cultural retailers, have receded into urban centers where effective, solvent demand was to be found.
The quick change in the economic and legal environment eroded the basic cultural supply. This is true in qualitative, content-wise terms, in terms of the physical state of infrastructure, in the costs of operation, and in human resources, which is an especially serious problem because due to their cheap accessibility these institutions were mostly used by lower income social groups in need for access to cultural goods. (Bárdosi, Lakatos, & Varga, 2004, p. 10)
This process of regression proved to be a fatal one: The lack of solvent demand and adequate funding ruined the distribution infrastructure, and its collapse left that market demographic unserved, one that could have paid for these services, though it was not large enough to constitute an economically viable market.
The shift from independent cinemas to multiplexes also transformed the content projected on screens. Multiplexes focus on the few most profitable titles, while those institutions that could serve midlist titles have all but vanished. The lack of cinemas is a problem in itself, but it also generates another one: the lack of diversity in titles.
Hungarian film piracy must be understood in this context.
Data Sources
We have decided to track three of the most popular Hungarian BitTorrent trackers: BitHUmen,4
nCore,5 and Independence.6 We made these choices based on reputation, stability, number of users/peers,
number and type of titles, and access. Information on these dimensions was based on interviews with and recommendations by file sharers.
We tracked them by crawling7 their Web interfaces, saving every bit of information that the
server makes public to individual users. As a result, we had access to user and torrent profiles. Through the lists of seeders, leechers, and downloaders, we were also able to reconstruct every torrent’s traffic history. According to our estimates, using this method we were able to reconstruct torrent traffic with 99% precision.
4 BitHUmen service is the oldest Hungarian tracker with a solid reputation and a committed community. It
is also the world’s 26th most-sought-after tracker in terms of the number of invitation requests found on the Internet (Sharky, 2008). It is relatively free of ads, suggesting a nonprofit operation.
5 NCore ranks 40th in the same list by Sharky (2008) and is an ad-based service. Its specialty is that it
accepts releases from outside “the scene,”—the unofficial circle of trusted release groups. Anyone can release on nCore, giving users access to a wider variety of titles, but that degree of access sometimes also translates to lower quality and lower download speeds.
6 Independence is a relative newcomer compared with the other two BitTorrent services. Any user can
register on the site; however, registration is not free. Independence reaches out to users who cannot get access to the other more reclusive trackers, offering them a chance to buy themselves into an exclusive world. This, and the site’s strong emphasis on monetizing its user base, appeared to create a bad reputation for the site and for its owner among Hungarian file sharers, who seem to deem such an unabashedly commercial approach objectionable. Nevertheless, due to its relative openness, it was included in our study.
7 To achieve a nonintrusive, difficult-to-detect monitoring of closed hubs, we developed the appropriate
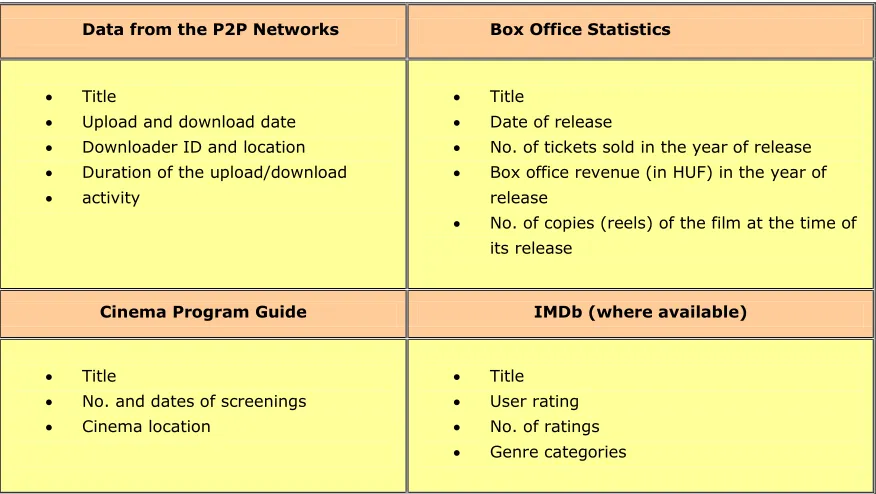
We have matched this dataset with three other data sources: (a) a program guide, including the time and place of every movie screening in Hungary since 2000; (b) the Hungarian box office statistics for new releases; and (c) ratings and genre classification information from the Internet Movie Database (IMDb). (See Table 1 for a detailed set of variables used in the analysis.)
Table 1. Data Used in the Analysis.
Data from the P2P Networks Box Office Statistics
Title
Upload and download date Downloader ID and location Duration of the upload/download activity
Title
Date of release
No. of tickets sold in the year of release Box office revenue (in HUF) in the year of
release
No. of copies (reels) of the film at the time of its release
Cinema Program Guide IMDb (where available)
Title
No. and dates of screenings Cinema location
Title User rating No. of ratings Genre categories
Descriptive Statistics of P2P Movie Black Markets
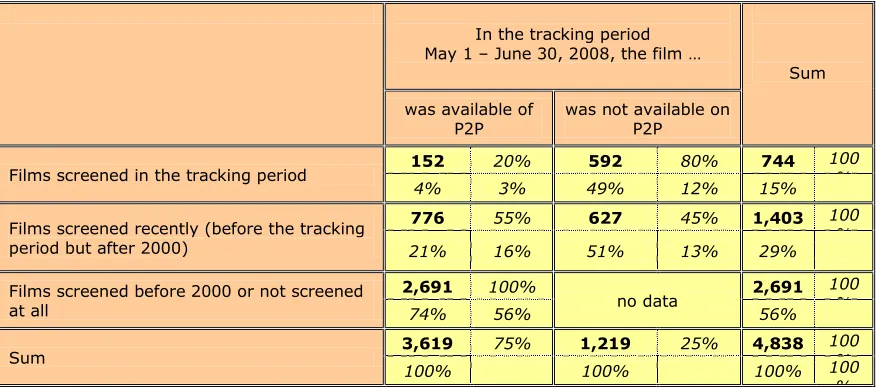
market or in cinemas. As we do not know anything about these films, we did not analyze this category. The distribution of films among the categories is shown in Table 2.
Table 2. Content Categories According to P2P and Cinematic Availability.
(The numbers in each cell: top left, bold: the number of films in the category; top right: row %; bottom left: column %; bottom right: total %.)
In the tracking period May 1 – June 30, 2008, the film …
Sum was available of
P2P was not available on P2P
Films screened in the tracking period 152 4% 20% 3% 49% 592 80% 12% 15% 744 100%
Films screened recently (before the tracking period but after 2000)
776 55% 627 45% 1,403 100
%
21% 16% 51% 13% 29%
Films screened before 2000 or not screened at all
2,691 100%
no data 2,691 100%
74% 56% 56%
Sum 3,619 100% 75% 1,219 100% 25% 4,838 100% 100100%
%
We found that nearly 75% of all the P2P available films are in the not screened category. Such a high proportion could be an indicator of the importance of peer-to-peer networks in the diffusion of cinematic content, as it suggests that one of the main motivations for downloading is scarcity of titles in the legitimate market. Before accepting this conclusion, though, we should note that we lack conclusive data on DVD (sales and rental), television (broadcast, cable, satellite, and IPTV) and legitimate online distribution channels. Therefore, we cannot readily accept or reject the scarcity model on the content side.
One might be surprised to see that only 20% of the screened films since 2000 were available through P2P networks during the time frame of our study. On one hand, the explanation for this phenomenon is that the studios successfully curb piracy. On the other hand, we see a trend that brings the release dates in different countries closer together (as a response to piracy), with the data suggesting that—at least in the case of American films—the P2P market needs to wait longer and longer for the first high quality pirate copy.8
The descriptive statistics of films in our study (Table 3) explain some of the dynamics of the P2P black market. The life span of the films in category 1 (in cinemas + on P2P) is twice as long as that of those in category 3 (not in cinemas + on P2P): The difference is nearly 40 days, indicating that the new releases are more interesting for downloaders than are older releases. This conclusion is further supported by the number of downloads in these categories where the ratio is more than 5 to 1: While a new release gets 1,042 downloads on average, an older, not in cinema title receives only 190. While new releases get disproportionally more downloads, the overall download volume is more balanced due to the high number of films in the not screened categories. Category 5 (not screened at all + on P2P) has the highest download volume (347.000, see Table 3) indicating a strong demand for back catalog titles.
For those who stress the destructiveness of P2P film sharing, the data on the overall downloads versus the number of total tickets sold might point to smoking gun evidence. The table, however, contains the audience size for the entirety of the films’ life span. If we want to compare legal and illegal audiences, we need to narrow the number of sold tickets to the time frame of downloading activity. In that case, we find that for 1,650,000 tickets sold, there are 157,000 downloads, making the impact of the black market equivalent to slightly less than 10% of tickets sold. While the usual caveats apply here—we underestimate the number of P2P users, as well as the number of downloads—this 1:10 ratio is far from the apocalypse that content owners like to suggest in their rhetoric.
It seems that films with more screenings have a higher chance to be downloaded. There is a category of films (with around 400 screenings) that do not even make it to the black market. The same applies to the number of cinemas where a film is available: Wider distribution goes hand in hand with a higher probability of black market availability. Films available on the black market have higher audiences and higher box office revenues as well.
8 According to Baio (2009), in the case of Oscar-nominated films, the time between the theatrical release
Table 3. Descriptive Statistics of the Films in our Study. (Data for the cinematic distribution are for the entire life span of the films and thus not
limited to the tracking time frame.)
Films screened in the tracking timeframe
Films screened before tracking time frame, but after
2000
Films not screened (or only before
2000) Sum
Available on P2P Not available on P2P Available on P2P Not available on P2P Available on P2P
Torrent life span (days)
Mean 79 0 40 0 24 22
Maximum 617 0 439 0 440 617
Σ 11,970 0 30,998 0 65,771 108,739
Std Dev. 99 0 41 0 33 39
No. of downloads
Mean 1,042 0 190 0 129 135
Maximum 9,108 0 2,579 0 6,736 9,108
Σ 158,358 0 147,357 0 346,844 652,559
Std Dev. 1,874 0 247 0 335 461
Theatrical life span (days)
Mean 110 126 103 102 . 110
Maximum 418 417 409 410 . 418
Σ 16,757 74,525 79,959 63,955 . 235,196
Std Dev. 137 136 108 107 . 118
No. of screenings
Mean 2,636 434 1,785 1,487 0 615
Maximum 12,588 11,789 14,008 11,284 0 14,008
Σ 400,623 256,689 1,384,916 932,073 0 2,974,301
Std Dev. 2,735 1,161 2,356 2,196 0 1,604
No. of cinemas screening
Mean 63 19 69 60 0 23
Maximum 249 286 301 301 0 301
Σ 9,635 11,087 53,533 37,326 0 111,581
Std Dev. 49 35 72 69 0 50
Box office revenue (million HUF)
Mean 93 20 68 58 0 10
Maximum 676 405 686 556 0 686
Σ 8,270 2,340 14,613 8,367 0 33,590
Std Dev. 126 47 96 91 0 46
No. of tickets sold (pcs)
Mean 99,064 27,107 78,673 68,703 0 11,928
Maximum 853,926 501,098 826,129 610,135 0 853,926
Σ 8,816,665 3,144,467 16,914,660 9,961,981 0 38,837,773
Std Dev. 149,989 58,240 116,819 106,648 0 53,849
Tickets per screenings (pcs)
Mean 24 17 23 21 . 21
Maximum 121 55 101 70 . 121
Σ 2,136 1,921 4,895 3,095 . 12,046
Std Dev. 17 8 13 11 . 13
No. of copies
Mean 18 7 17 16 0 2
Maximum 41 41 43 43 0 43
Σ 1,690 828 2,917 1,773 0 7,208
Std Dev. 11 8 9 10 0 7
Time between the theatrical release & the first day of the tracking period (wks)
Mean 104 122 239 244 . 199
Maximum 410 410 410 410 . 410
Σ 15,882 72,239 185,246 153,205 . 426,572
Std Dev. 138 135 129 124 . 142
Time between the last theatrical screening & the first day of the tracking period (wks)
Mean 0 0 136 143 . 91
Maximum 0 0 408 409 . 409
Σ 0 0 105,420 89,353 . 194,773
These descriptive statistics support our preliminary hypothesis that file sharing has both a substitution and a shortage aspect, both of them significant. On one hand, the sheer number of films not available in cinemas, and the volume of downloads they generate suggest a huge, unmet demand that is being supplied by film sharers themselves.
On the other hand, it is clear that new releases have the highest number of downloads per film. Knowing the process of black market releases—where high quality P2P copies usually appear after the cinematic release—we can exclude that option from the hypotheses that P2P popularity would cause high cinema attendance. Instead, the logic works the other way: The marketing of new releases also generates demand on the black markets while older titles are not marketed, thus lowering their online popularity.
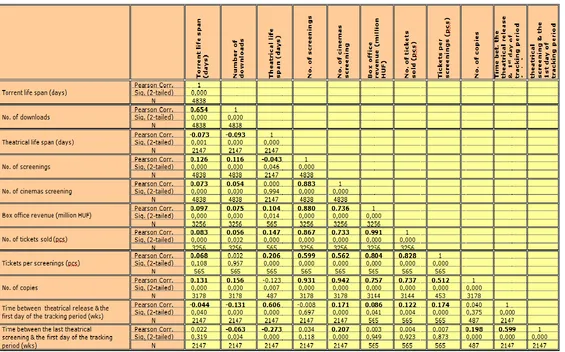
These findings are further detailed by the correlations between the different variables. (Table 4. Correlation of Variables for all Films in the Analysis.) There is a statistically significant correlation between the number of downloads and certain variables of the cinematic distribution for all films in the analysis. Nevertheless, these correlations are weak: Even the strongest connection between downloads and the number of copies is only 0,116. The number of downloads does show a slightly positive correlation to cinema attendance and a slightly negative correlation to time since the cinematic release. This suggests that recent, mass appeal films have higher downloads. In this same selection, the strongest connection (0,6) is between cinematic life span and time between the cinematic and P2P release. Films that are screened for a longer period enter the black markets later than do those titles that quickly disappear from the cinemas. However, longer cinematic life span does not necessarily translate to larger audiences, as the weak correlation (0,174) between life span and ticket sales shows.
P2P Sharing in the Substitution versus Shortage Dichotomy
So far, films are our units of analysis. Now, we turn to users to further understand substitution and shortage dimensions. More than half of all film downloads were of releases absent from Hungarian cinemas after 2000. We interpret this as a sign of the shortage paradigm, but how does this picture look from the perspective of the users?
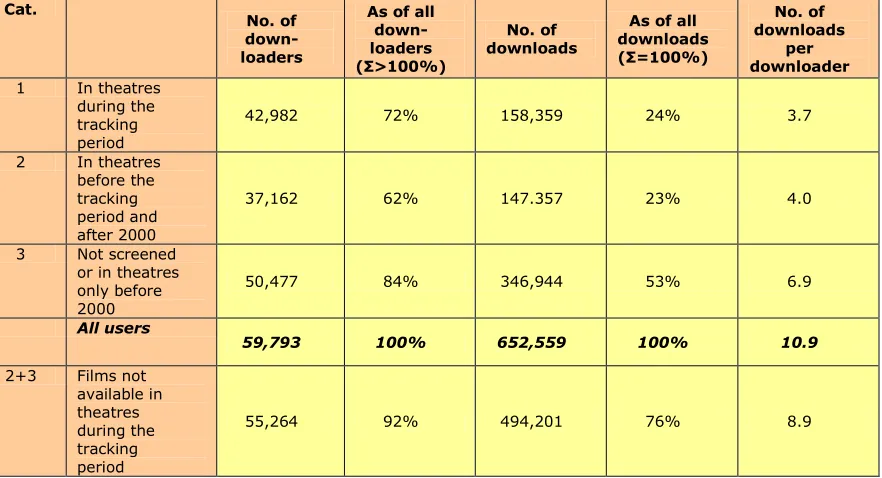
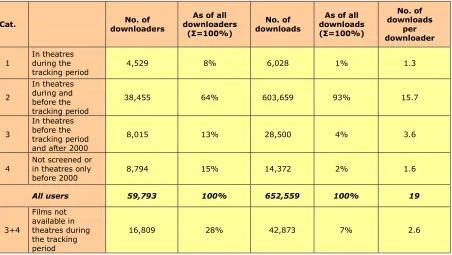
We found little surprise here. As the data in Table 7 suggests, nearly two-thirds of users download both new and older titles. Only 10% of our users downloaded only new releases, that is, films also available in cinemas at time of download. On the other hand, nearly 30% of users ignored such films and downloaded only older titles. This could support the shortage paradigm, but if we turn to Table 6, it becomes obvious that the reality is a bit more complex. While only a small minority of users downloads only new releases, nearly 3 of every 4 users download such films occasionally. While the bulk of piracy is of older titles—92% download such titles—new releases also fall prey to illegal downloading.
We found further evidence to support the shortage paradigm when we examined how many titles users downloaded in each category during the tracking period. While those who downloaded only new releases downloaded 1.3 films on average, those who exclusively downloaded older titles downloaded 2.6 films. These are not the typical users though. Those who download old and new films alike download a whopping 16 films on average (2 films per week).
Table 6. Number and Share of Downloaders and Downloads According to Theater Availability of Films. (One user can belong to multiple categories.)
Cat.
No. of down-loaders
As of all down-loaders (Σ>100%)
No. of downloads
As of all downloads (Σ=100%)
No. of downloads
per downloader 1 In theatres
during the tracking period
42,982 72% 158,359 24% 3.7
2 In theatres before the tracking period and after 2000
37,162 62% 147.357 23% 4.0
3 Not screened or in theatres only before 2000
50,477 84% 346,944 53% 6.9
All users
59,793 100% 652,559 100% 10.9
2+3 Films not available in theatres during the tracking period
Table 7. Number and Share of Downloaders and Downloads According to Theater Availability of Films. (One user belongs to one category only.)
Cat. downloaders No. of downloaders As of all (Σ=100%)
No. of downloads
As of all downloads (Σ=100%)
No. of downloads
per downloader
1 In theatres during the
tracking period 4,529 8% 6,028 1% 1.3
2
In theatres during and before the tracking period
38,455 64% 603,659 93% 15.7
3
In theatres before the tracking period and after 2000
8,015 13% 28,500 4% 3.6
4 Not screened or in theatres only
before 2000 8,794 15% 14,372 2% 1.6
All users 59,793 100% 652,559 100% 19
3+4
Films not available in theatres during the tracking period
16,809 28% 42,873 7% 2.6
Film Supply and Demand on the P2P Marketplace
Studies on the interconnections between legal sales and piracy typically focus on the impact of downloading on sales, especially in the case of the music industry (e.g., see Oberholzer-Gee & Strumpf, 2007). This is a logical approach in the study of markets where the years since 2000 have seen legal sales plummet and P2P piracy rise. Understandably, researchers are formulating their questions partly by addressing the claims of industry representatives on the alleged negative impact on sales because of piracy, most significantly file sharing.
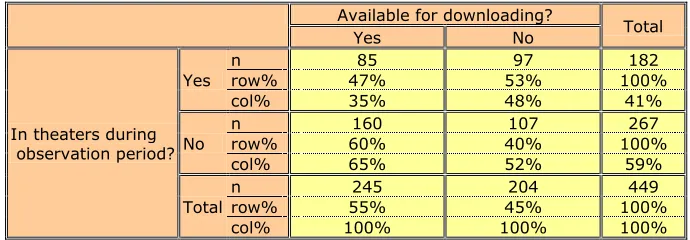
alternatives to legal purchases (substitution) and compensating for market failures (shortage reduction)―calls for an investigation of the factors that drive these very mechanisms. Second, that our data on the legal marketplace come exclusively from cinematic distribution implies a stock of available legal products (i.e., theater-viewing opportunities) that is considerably narrower than for recorded content. Consumption of theater-screened content is delimited in space and time: People will see only those films that are playing in theaters. At the same time, the spectrum of films available via file sharing is considerably larger—59% vs. 41% for the films analyzed in this section (see Table 8)—partly due to the short two-month observation period. If we concentrate only on how sales of movie theater tickets are affected by piracy, we will dismiss valuable information regarding the bigger picture. Our perspective would, of course, be different if more data on the legal marketplace―particularly, DVD sales figures by titles―were available. In that case, the question of how piracy impacts sales of recorded content would be prominent. Finally, and perhaps most important, even for those films that played in theaters during the observation period, this availability is merely theoretical. While every film in that segment had at least one movie theater screening in Hungary, it is not known which of those films played in theaters where the users effectively had access to view―that is, the theater was located within a reasonable distance from where they live or go about their daily activities. Only a fraction of users divulged their place of residence (doing so was optional) in the personal data on the user interface of the P2P services whose transactions were tracked in our data collection, so we could not use this information for the overwhelming majority of the films observed. Therefore, information relating to how any film “received theater play in Hungary during the tracking period” is hardly sufficient to be considered as an actual option.
Table 8. Films Included in the Analysis of Demand and Supply.
Available for downloading? Total
Yes No
In theaters during observation period?
Yes
n 85 97 182
row% 47% 53% 100%
col% 35% 48% 41%
No n row% 60% 160 40% 107 100% 267
col% 65% 52% 59%
Total
n 245 204 449
row% 55% 45% 100%
col% 100% 100% 100%
The explanatory models of supply and demand use different sets of observations and different methods In the case of supply, the question is: What factors explain that a film is shared on P2P networks? Accordingly, the analysis is performed on films both available and unavailable for downloading. Pertaining to the specificity of P2P piracy―content can be supplied with relative ease and then multiplied ad infinitum, even if only one original copy is shared―the suitable dependent variable of P2P supply is dichotomous: shared versus not shared. In the case of demand, the question is: What factors explain the number of completed downloads a film generates on P2P networks? Here, the analysis is restricted to the pool of films that were shared for downloading; the dependent variable is the quantity of downloads per film during the tracking period.
These distinctions regarding the universe of reference for the two separate analyses are crucial. Taking the example of book publishing, the question of what gets published and what factors affect book sales requires not only different statistical models but also different sets of observations. Just as one can only buy a book that has been published, one can only download a film that has been transformed into a digital copy and made available to the P2P community. Emphasizing this issue in the case of P2P content piracy is less trivial than it might seem at first glance and further underscores the significance of research conducted on real-time transaction data. Had we relied on data from indirect observations (e.g., questionnaire surveys), we would not have been able to make such distinctions. We would know only what films the individuals in our sample have downloaded during this or that period, but we wouldn’t have any information on P2P supply, that is, which titles were actually available for them to download. Lack of knowledge about these references would also complicate the definition of demand. Having already pointed out the importance of the role played by releasers and site administrators in determining what content is shared on P2P networks, we can also say that copy releasing and uploading perform the same function in P2P piracy as publishing does in the book industry. As direct observation of transactions is the only method to differentiate between supply and demand in P2P piracy, the models presented subsequently in this article provide insight into hitherto unexplored mechanisms.
All Observed Films
This section discusses supply and demand in the case of all films whose distribution parameters were collected, regardless of whether they did or did not receive theater play during the observation period. The dependent variable for the supply model is the availability for downloading: A film may be either available (coded 1) or missing from the network (coded 0). To explain the availability of films on P2P networks, we use the parameters of their cinematic distribution. As noted earlier, this is possible because few films get released onto P2P networks before their theater premiere, and high (near DVD) quality copies usually take some time to appear. The other argument in favor of their inclusion in explanatory models is that these variables are key indicators of the sales effort and hence indispensable for an analysis of the interconnections between legal and illicit markets.
available.9 The set also includes the IMDb rating, which is an average of ratings given by users of the
IMDb website on a 10-point scale10 and genre categories (based on IMDb).11 As with all subsequent
models, each regression is presented in two versions: one without (Version A) and one with genre categories (Version B).
In Supply Model 1A (Table 9), the combined effects of the five parameters of cinematic distribution, plus the IMDb score, explain 9% of the P2P supply. Although this might not seem very high, it is instructive to examine the two variables having a significant impact on which films appear on P2P networks.12 The effect of the number of copies distributed to theaters is 3 times more than that of
theatergoers. It is legitimate to presume that the number of copies in theaters is also a proxy for the sales effort by the distributor, as films showing in multiple theaters are obviously accompanied by more intense campaigns than are those with fewer copies. Therefore, the higher impact of copies suggests that the publicity generated by theater distribution is itself more important in influencing which content will be subject to piracy than is the number of actual theatergoers—a finding also found in other subsequent models.13 This is most likely because, as intense sales efforts generate attention among targets, this
attention will in turn also materialize in the form of a higher likelihood of P2P availability of content. What is crucial in this perspective is less the attention of ordinary downloaders than it is the judgment of P2P releasers and site administrators who act as filters in determining which content will be offered for users.
9 Because not all of these variables are available for the totality of titles, the number of titles included in
the regressions (N=449) is lower than the total of titles whose P2P circulation was observed.
10 These rankings come from mostly non-Hungarian audiences, except for Hungarian-produced films with
no international distribution. We chose to include this variable as a proxy for audience appeal or popularity that may or may not be reflected in box office revenues.
11 As the number of original genre categories would be difficult to handle for regression models, genres
were categorized. Any film can―and most of the films analyzed here do―belong in several genres. Using principal-components analysis, we isolated five metagenres, which together explain 57% of the variance of 14 genres included in the analysis: family (family, animation, adventure, fantasy), escapism (action, sci-fi), violence (horror, thriller, mystery), high culture (war, history, drama), and light entertainment (romance, comedy). Variables corresponding to these categories were entered in the form of principal-component scores, which in practical terms means that a film belonging in several subgenres of any category enters the equation with a higher score than those films belonging in only one such genre.
12 With the exception of principal-component scores for genre categories, all continuous variables
(including the dependent variable in linear models) enter the regressions in their logarithmic form. To facilitate the comparison of effects in logistic regressions, we have also calculated the standardized regression coefficient (β) on the basis of the original B coefficients. These should be interpreted in the same way as are the β coefficients of linear regression.
13 To avoid multicolinearity, independent variables are entered in their residual forms resulting from
The addition of genre information in Supply Model 1B results in a spectacular increase of explained variance (16%). Moreover, three genres have a bigger impact on P2P availability than does audience size. The fact that violent and escapist content is attracting more attention is hardly surprising. More counterintuitive is the positive impact of family-oriented films, which suggests a hitherto less discussed aspect of P2P piracy worth exploring in future research. It may be that P2P gatekeepers are especially responsive to the demands of parents with small children―and perhaps also children above a certain age―looking for this type of content (many releasers may also themselves fall into these categories). Finally, light entertainment content is less likely to be offered for downloading.
In comparison with the determinants of supply, the regressions of demand (Table 10) reveal a more complex set of effects. Indeed, 4 of the 5 factors of cinematic distribution are significant predictors of downloaded quantity. The impact of each variable is also informative. In broad terms, there is an indication that audience appeal (or reaction) plays a more important role in shaping P2P demand than does supply. This is demonstrated by the reduced impact of distributed copies matching that of audience size, but most important, by the more significant and bigger impact of viewer rating—a measure of popularity. The implication is that the sales effort has a bigger relative influence on what is shared by P2P gatekeepers than on what ordinary network users are actually looking for. The latter rely less on marketing impulses than they do on peer evaluation, though it is obviously impossible to ascribe each of our independent variables entirely to either the sales effort or audience appeal.14 Given the proliferation of
online media discussing a variety of cinema topics, the major channels of audience reaction are most likely to be review articles and even user-generated content (forums, blogs, etc.) rather than word of mouth.
Demand for a film among P2P pirates is also heavily influenced by novelty: time since the premiere has the biggest impact on how often a film is downloaded, even when controlling for genre (Demand Model 1B). The genre effect is less pronounced than it is in the case of supply: Escapism is more sought after among downloaders while light entertainment is less so.
14 The number of tickets sold variable enters the model as a residual, that is, the part of the original
Table 9. Explanation of P2P Supply of all Observed Films
(Logistic regression, dependent variable is downloaded [1] vs. not downloaded [0].
B (Std error) ß Exp(B) B (Std error) ß Exp(B)
-0.103 (0.075) -0.066 0.902 -0.149* (0.078) -0.092 0.862
0.639*** (0.108) 0.292 1.895 0.652*** (0.108) 0.285 1.918
0.190* (0.101) 0.087 1.209 0.208** (0.106) 0.091 1.232
0.049 (0.101) 0.022 1.050 0.048 (0.106) 0.021 1.049
0.069 (0.099) 0.031 1.071 0.074 (0.102) 0.032 1.077
Family 0.262** (0.105) 0.120 1.299
Escapism 0.328*** (0.114) 0.140 1.388
Violence 0.352*** (0.112) 0.154 1.423
High culture -0.088 (0.105) -0.038 0.915
Light entertainment -0.177* (0.103) -0.078 0.838
0.598* (0.310) 1.818 0.799** (0.326) 2.224
OLS R2
N 449
Time between premiere and observation window in weeks (logged)
Copies in theaters (logged) Tickets sold (logged) Theatrical life span (logged) IMDb viewer rating (logged)
Constant
*p<0.1 **p<0,05 ***p<0,01 Supply Model 1b
Supply Model 1a
0.10 0.16
449
M
ai
n
ge
nr
Table 10. Explanation of P2P Demand for all Observed Films Available for Downloading During Tracking Period.
(Linear regression, dependent variable is logged number of downloads.)
Films in Theaters
Tables 11 and 12 restrict the preceding analyses by focusing on films that played in theaters during the observation period (May-June 2008). This segment includes only films, which in theory were also available through legal channels and whose online piracy therefore meets the broadest definition of
B (Std error) ß t B (Std error) ß t
-0.392*** (0.064) -0.359 -6.102 -0.368*** (0.064) -0.337 -5.728
0.210* (0.110) 0.112 1.906 0.276** (0.111) 0.147 2.489
0.175* (0.092) 0.111 1.908 0.168* (0.091) 0.107 1.848
0.069 (0.095) 0.042 0.725 0.060 (0.093) 0.037 0.644
0.254*** (0.094) 0.158 2.707 0.252*** (0.093) 0.156 2.717
Family -0.047 (0.079) -0.035 -0.593
Escapism 0.217** (0.084) 0.151 2.596
Violence 0.045 (0.089) 0.030 0.510
High culture -0.139 (0.097) -0.084 -1.431
Light entertainment -0.158* (0.085) -0.108 -1.865
6.580*** (0.265) 24.854 6.457*** (0.263) 24.525
OLS R2
N 245
Time between premiere and observation window in weeks (logged)
Copies in theaters (logged) Tickets sold (logged) Theatrical life span (logged) IMDb viewer rating (logged)
M
ai
n
ge
nr
es
Constant
*p<0.1 **p<0,05 ***p<0,01 Demand Model 1b
Demand Model 1a
0.17 0.20
“substitution.”15 Compared with the supply models of all observed films, the significantly increased
explained variance and the higher number of significant variables indicate a closer connection between P2P supply and theater distribution for content that is currently available in cinemas. This also means an increased impact of audience judgment, as demonstrated by the coefficients of tickets sold and IMDb viewer rating. In this sense, the supply of current releases is reminiscent of the demand for all observed films. However, as in the case of Supply Model 1, the number of copies distributed is still the most important factor in determining which content appears on P2P networks. More recent content is more likely to get pirated online (Supply Model 2a), although this relationship disappears when controlling for genre (Supply Model 2b). With the exception of high culture, all genre categories are significant predictors of which films appear in the P2P supply. Interestingly, the impact of light entertainment is again negative. Family-oriented, escapist and violent content catches the attention of P2P gatekeepers more quickly than do other genres.
Given the especially high explanatory power of Supply Models 2a and 2b, these findings underscore the definitive impact that both cinematic sales effort and audience appeal exert on P2P supply of current films. Films supported by heavy marketing investment are more likely to appear on P2P networks. Leaks to P2P networks are further facilitated by their popularity with audiences. Ironically, the sales effort by distribution channels translates into supporting not only legal consumption but also the substitution paradigm.
In marked contrast, P2P demand for the pool of current theatrical releases is much less complex. It is essentially a matter of “freshness,” with downloader interest being highest for the newest releases and declining afterward. The lower explained variance of Demand Models 2a and 2b also indicates that production and distribution parameters fail to capture much of what actually drives demand in this segment. Furthermore, given that proximity to premiere date is the only significant predictor of downloads, downloader interest for new releases is rather generic and perhaps also superficial. The addition of genres in Demand Model 2b somewhat shades this suggestion: It is indeed fresh and/or violent content that gets downloaded in higher numbers. However, as downloading does not necessarily mean actual consumption (on which we have no information), this should not be interpreted as a lack of focus. Nevertheless, the contrast between supply driven by cinematic distribution and audience response on one hand and demand mostly unaffected by these factors on the other is highly instructive on the mechanisms shaping the P2P marketplace in the segment where options of legal consumptions are (theoretically) available.
15 See our earlier caution, against considering theatrical availability, without information on proximity to
Table 11. Explanation of P2P Supply of Films in Theaters During Tracking Period.
(Logistic regression, dependent variable is downloaded [1] vs. not downloaded [0].)
B (Std error) ß Exp(B) B (Std error) ß Exp(B)
-0.241* (0.124) -0.164 0.786 -0.163 (0.148) -0.082 0.850
1.005*** (0.196) 0.432 2.733 1.171*** (0.233) 0.375 3.227
0.521** (0.207) 0.212 1.683 0.593** (0.256) 0.180 1.810
0.150 (0.264) 0.049 1.162 -0.399 (0.406) -0.098 0.671
0.449** (0.224) 0.150 1.567 0.452* (0.273) 0.112 1.572
Family 0.575** (0.247) 0.176 1.778
Escapism 1.304*** (0.441) 0.316 3.683
Violence 1.125*** (0.391) 0.212 3.080
High culture -0.339 (0.242) -0.088 0.712
Light entertainment -0.472* (0.246) -0.129 0.623
0.627* (0.368) 1.872 1.250*** (0.453) 3.490
OLS R2 N
*p<0.1 **p<0,05 ***p<0,01 Supply Model 2b
Supply Model 2a
0.30 0.46
182 182
Time between premiere and observation window in weeks (logged)
Copies in theaters (logged) Tickets sold (logged) Theatrical life span (logged) IMDb viewer rating (logged)
M
ai
n
ge
nr
es
Table 12. Explanation of P2P Demand for Films in Theaters and Available for Downloading During Tracking Period.
(Linear regression, dependent variable is logged number of downloads.)
Films Not in Theaters
The picture is again very different for the supply of films beyond their theatrical lifecycle (Table 13). With low explained variance, cinematic distribution has but a small influence on what is shared from this stock.16 The two significant predictors in both models nonetheless provide some insights into the way
P2P supply operates in this segment. On one hand, there is a “fading memory effect”: As films age, they are less likely to appear in the P2P supply. On the other hand, this is compensated by a “learning effect”:
16 As with all previous models, explanatory power (the R2 coefficient) would likely be higher with the
inclusion of DVD distribution data.
B (Std error) ß t B (Std error) ß t
-0.411*** (0.112) -0.427 -3.673 -0.372*** (0.122) -0.386 -3.045
0.104 (0.209) 0.052 0.496 0.362 (0.221) 0.181 1.638
0.294 (0.194) 0.168 1.517 0.291 (0.194) 0.166 1.499
0.184 (0.207) 0.096 0.888 -0.016 (0.231) -0.009 -0.071
0.031 (0.235) 0.015 0.133 -0.012 (0.232) -0.006 -0.051
Family 0.114 (0.146) 0.088 0.783
Escapism 0.280 (0.175) 0.172 1.601
Violence 0.604** (0.239) 0.270 2.526
High culture -0.235 (0.204) -0.121 -1.150
Light entertainment -0.160 (0.171) -0.097 -0.935
6.576*** (0.342) 19.237 6.429*** (0.340) 18.920
OLS R2
N 85
Time between premiere and observation window in weeks (logged)
Copies in theaters (logged) Tickets sold (logged) Theatrical life span (logged) IMDb viewer rating (logged)
M
ai
n
ge
nr
es
Constant
*p<0.1 **p<0,05 ***p<0,01 Demand Model 2b
Demand Model 2a
0.13 0.20
Films with a longer theatrical presence—a likely proxy for higher consumer awareness—have an increased chance to become available for online piracy after theaters stop playing them. Put differently, while much of the impact of the cinematic sales effort goes into underpinning the P2P supply of current releases, it also has some residual effect on older releases in the form of wider P2P availability of films getting longer theater play. On the demand side (Table 14), however, there is still a noticeable effect of both sales effort and audience appeal. Perhaps more interestingly, a film’s age does not affect its P2P demand once theaters stop playing it.
Table 13. Explanation of P2P Supply of Films Beyond Their Theatrical Life Cycle During Tracking Period.
(Logistic regression, dependent variable is downloaded [1] vs. not downloaded [0].)
B (Std error) ß Exp(B) B (Std error) ß Exp(B)
-0.622*** (0.239) -0.168 0.537 -0.639*** (0.243) -0.165 0.528
0.189 (0.146) 0.078 1.208 0.213 (0.150) 0.085 1.238
0.142 (0.138) 0.063 1.153 0.129 (0.139) 0.055 1.138
0.239* (0.127) 0.114 1.270 0.236* (0.131) 0.108 1.266
-0.020 (0.119) -0.010 0.981 -0.021 (0.119) -0.010 0.980
Family 0.030 (0.124) 0.014 1.031
Escapism 0.106 (0.128) 0.050 1.112
Violence 0.224* (0.118) 0.118 1.252
High culture -0.013 (0.123) -0.006 0.987
Light entertainment -0.009 (0.124) -0.004 0.991
3.247*** (1.092) 25.723 3.286*** (1.112) 26.734
OLS R2
N 267
Time between premiere and observation window in weeks (logged)
Copies in theaters (logged) Tickets sold (logged) Theatrical life span (logged) IMDb viewer rating (logged)
M
ai
n
ge
nr
es
Constant
*p<0.1 **p<0,05 ***p<0,01 Supply Model 3b
Supply Model 3a
0.04 0.06
Table 14. Explanation of P2P Demand for Films Beyond Their Theater Life Cycle and Available for Downloading During Tracking Period.
(Linear regression, dependent variable is logged number of downloads.)
B (Std error) ß t B (Std error) ß t
-0.308 (0.188) -0.130 -1.635 -0.228 (0.188) -0.096 -1.218
0.253* (0.128) 0.150 1.975 0.294** (0.129) 0.174 2.268
0.080 (0.113) 0.055 0.703 0.026 (0.114) 0.018 0.227
0.020 (0.113) 0.014 0.175 0.078 (0.112) 0.053 0.693
0.356*** (0.102) 0.268 3.498 0.360*** (0.101) 0.270 3.558
Family -0.118 (0.102) -0.090 -1.162
Escapism 0.239** (0.097) 0.190 2.451
Violence -0.077 (0.091) -0.063 -0.844
High culture -0.101 (0.110) -0.071 -0.921
Light entertainment -0.168* (0.097) -0.130 -1.741
6.198*** (0.842) 7.358 5.853*** (0.839) 6.978
OLS R2
N 160
Time between premiere and observation window in weeks (logged) Copies in theaters (logged) Tickets sold (logged) Theatrical life span (logged) IMDb viewer rating (logged)
M
ai
n
ge
nr
es
Constant
*p<0.1 **p<0,05 ***p<0,01 Demand Model 3b
Demand Model 3a
0.09 0.13
Implications for Small Local Markets
This article’s findings have some specific implications for the film industry of small countries and also, to a certain extent, for European film production. Owing to its limited market influence, the film industry in small countries typically relies on government subsidies and tax deductions. Most of the films produced in this context fall into the art house category, with niche audiences and limited mass appeal. The funding schemes leave little room and budget to support anything beyond production; marketing and distribution costs are usually left uncovered. This situation leaves these productions without significant theater audiences. But as the models demonstrate, these factors also negatively impact their accessibility on P2P markets. If we believe that free availability has the potential to turn at least a fraction of pirates into customers of legitimate (recorded) content, we wonder what further damage this limited P2P availability does to the already limited profitability of these productions. It will take further and more pointed research to quantify the distribution and marketing potential of local P2P marketplaces for films that have difficulty competing successfully in the global cinema marketplace. We presume that P2P marketplaces do not have a direct negative impact on the size of theater audiences of films produced in small countries (partly due to them being limited anyway). Therefore, P2P piracy poses little (if any) threat to producers of such content. But as P2P networks are clearly capable of delivering additional audiences to producers, a well-defined policy could use P2P markets to support film distribution rather than consider them as liabilities.
Conclusions
This article has attempted to investigate the interconnections of cinematic distribution and the illegal P2P marketplace. Thanks to the matching of market statistics with transactional data, our study provides insight into hitherto unexplored aspects of online piracy. While its findings are specific to one type of cultural goods (movies) and one single local market (Hungary), its implications are broader and show directions for future research.
P2P Supply
Our findings suggest that the shortage paradigm may indeed play a stronger role in the evolution of P2P black markets than does substitution of legal purchase options. Research indicates that 3 out of every 4 films available via the P2P networks surveyed were no longer in theatrical circulation at the time of data collection. Also, those downloading films from dated catalogs outnumber those downloading content currently playing in movie theaters. We should emphasize that this study could not fully address the issue of shortage versus substitution due to the unavailability of data on DVD, TV, and VOD consumption of the titles whose P2P circulation was observed.
sales effort of legal distributors while audience appeal plays a secondary role. In contrast, the sales effort has no significant effect on the P2P availability of the films not playing in theaters, which is influenced instead by age and earlier theater life span. These observations are also related to the varying propensity of different genres to appear on P2P networks.
P2P Demand
P2P demand for films playing in cinemas is a function of novelty rather than investment in marketing: In this segment, whatever film in theaters is closer to its premiere date is downloaded in higher quantities than are those that have been playing in theaters longer. Our data do not allow further conclusions, as parameters of theater distribution account for only a small fraction of the variance of a film’s downloads while still in theaters. Therefore, we can only speculate on what this means. One possibility is that attention to current theatrical releases among P2P pirates is generic because it is superficial and related to a behavior that has the appearance of omnivorousness, but in reality is no more than purposeless rambling amid the confusing amount of options offered by an endless stream of new content.
Interestingly, the impact of distributors’ sales efforts only becomes a significant predictor of P2P demand once a film is beyond its theatrical life cycle. It is also during this later theatrical life span stage that audience judgment exerts a significant effect on the quantity of downloads a film generates.
These observations seem to fit general trends and thus are not specific to the Hungarian market. In the case of new releases, it is worth mentioning that the phenomenon of “0-day” releases, that is, the continuous competition between different release groups on who first gets to release an illegal copy clearly shows the importance of freshness that is a measure of not only the competence of releasers but also that of the demand for such titles. Furthermore, data from weekly top P2P download charts17 suggest that the
most downloaded movies on P2P networks are recent (a few days or at most one or two weeks old) releases and the survival rate on such a list is very low: Nearly two-thirds of the movies featured on the torrentfreak.com-compiled weekly lists of the most downloaded films in 2011 stayed on the lists for three weeks or less.18 For older titles, Smith and Telang (2008) show that TV broadcasts of movies, which can
be interpreted as a form of marketing of older titles, generate considerable demand both on Amazon.com (in the form of DVD sales) and on P2P channels (in the form of downloads).
The P2P Model of Content Consumption
The unique modus operandi of P2P file sharing suggests that the traditional logics, channels, and institutions of film distribution are challenged by factors other than the oft-quoted factors of price, availability, and format. This article substantiates the assumption that the contexts of content
17 Such a chart is published weekly by http://torrentfreak.com/
18 Walls (1998) shows that the survival rates in Hong Kong movie distribution are even more skewed:
References
Alford, W. P. (1995). To steal a book is an elegant offense: Intellectual property law in Chinese civilization. Stanford, CA: Stanford University Press.
Baio, A. (2009, February 7). Pirating the 2009 Oscars. Retrieved from http://waxy.org/2009/01/pirating_the_2009_oscars
Bárdosi, M., Lakatos, G., & Varga, A. (2004). A kultúra helyzete Magyarországon [The state of culture in Hungary]. Budapest, Hungary: Magyar Művelődési Intézet.
Becker, J. U., & Clement, M. (2003). Generation Napster - Analysis of the economic rationale to share files in peer-to-peer-networks. Wirtschaftsinformatik, 45, 261–271.
Bodó, B. (2011a). Coda: A short history of book piracy. In J. Karaganis (Ed.), Media piracy in emerging economies (pp. 399–413). New York: Social Science Research Council.
Bodó, B. (2011b). A szerzői jog kalózai.[Copyright Pirates]. Budapest, Hungary: Typotex.
Borsos, Á. (2007, 2009. September 1.). Tudatos fejlesztés vagy spontán folyamatok? A magyar
mozihálózat az új évezredben [Conscious development of spontaneous processes? The Hungarian network of movie theatres in the new millennium]. Fejlesztés és Finanszírozás. Retrieved from https://ffdf.mfb.hu/repository/10398-a033
Condry, I. (2004). Cultures of music piracy: An ethnographic comparison of the U.S. and Japan. International Journal of Cultural Studies, 7(3), 343–363.
Cooper, J., & Harrison, D. M. (2001). The social organization of audio piracy on the Internet. Media Culture Society, 23, 71–89.
Cooper, M. N. (2005, March). Time for the recording industry to face the music: The political, social and economic benefits of peer-to-peer communications networks. Fellow paper at Stanford Law School Center for Internet and Society. Retrieved from http://cyberlaw.stanford.edu
Csigó, P. (2009). A konvergens televíziózás. Web, tévé, közösség [A convergent television. Web, TV, community]. Budapest, Hungary: L'Harmattan.
Giesler, M., & Pohlmann, M. (2003). The social form of Napster: Cultivating the paradox of consumer emancipation. Advances in Consumer Research, 30, 94–100.
Huang, C. Y. (2005). File sharing as a form of music consumption. International Journal of Electronic Commerce, 9, 37–55.
Hunter, S. D., & Spitz, D. (2003). Contested codes: The social construction of Napster. (MIT Sloan Working Paper No. 4445-03).
Keenan, D. (2008). Burning Chrome. The Wire Magazine – Adventures in Sound and Music, 297.
Lendvai, Z. (2008). Szerzői jog az ókorban [Authors’ rights in ancient times]. Iparjogvédelmi és Szerzői Jogi Szemle, 3(113), 57-79.
Manuel, P. L. (1993). Cassette culture: Popular music and technology in north India. Chicago: University of Chicago Press.
Marshall, L. (2004). The effects of piracy upon the music industry: A case study of bootlegging. Media Culture & Society, 26, 163–181.
Oberholzer-Gee, F., & Strumpf, K. (2007). The effect of file sharing on record sales: An empirical analysis. Journal of Political Economy, 115, 1–42.
Rojek, C. (2005). P2P leisure exchange: Net banditry and the policing of intellectual property. Leisure Studies, 24, 357–369.
Sharky. (2008, December 17). Invites: The top 50 most requested private trackers. Retrieved from http://filesharefreak.com/2008/12/17/invites-the-top-50-most-requested-private-trackers
Smith, M. D., & Telang, R. (2008). Competing with free: The impact of movie broadcasts on DVD sales and Internet piracy. Pittsburgh, PA: Carnegie Mellon University, H. John Heinz III School of Public Policy and Management.
Strahilevitz, L. J. (2003). Charismatic code, social norms, and the emergence of cooperation on the fileswapping networks. Virginia Law Review, 89, 505–595.