www.ann-geophys.net/24/1551/2006/ © European Geosciences Union 2006
Annales
Geophysicae
Sensitivity studies of the E region neutral response to the
postmidnight diffuse aurora
H. F. Parish and L. R. Lyons
Department of Atmospheric and Oceanic Sciences, University of California Los Angeles, Los Angeles, CA 90095-1565, USA Received: 10 August 2005 – Revised: 6 April 2006 – Accepted: 15 May 2006 – Published: 3 July 2006
Abstract. Measurements of the neutral thermosphere within
the postmidnight substorm recovery phase diffuse aurora show very large horizontal winds, and strong vertical struc-ture. Rocket, satellite, and ground based observations dur-ing the ARIA (Atmospheric Response in Aurora) campaigns, and earlier dawn side rocket observations, indicate neutral winds of up to 200 m/s, and a characteristic jet-like wind maximum around 110 to 120-km altitude, with strong shears above and below. The observed wind magnitudes are found to have a dependence on geomagnetic activity level, but re-cent modeling studies suggest that tides which propagate up from the troposphere and stratosphere may play an important role in generating the strong vertical variations in the neu-tral winds. The relative importance of auroral and tidal forc-ing in producforc-ing the measured wind structure is not known, however. Simulations have been performed using a three di-mensional (3-D) high resolution limited area thermosphere model to understand the processes which generate the ob-served neutral structure within the postmidnight diffuse au-rora. Parameters measured during the ARIA I observational campaign have been used to provide auroral forcing inputs for the model. Global background winds and tides have been provided by the CTIP (Coupled Thermosphere Iono-sphere PlasmaIono-sphere) model. The sensitivity of the response of the neutral atmosphere to changes in different parame-ters has been examined. Variations in the amplitudes and phases of the propagating tides in the background winds are found to have significant effects on the neutral structure in the E region, and the wind structure below around 110 km is found to be mainly produced by tidal forcing. Changes in the electric field and ion density affect the winds above around 120 km, and the importance of auroral forcing is found to depend on background winds. Variations in the orientation of the aurora relative to the background field, which may be
Correspondence to: H. F. Parish
caused by changes in the interplanetary magnetic field, are also found to modify the wind structure. When both auroral forcing and propagating tides are included, many of the basic characteristics of the wind structure are displayed, although the great strength of the wind shears is not well reproduced. The strength of the shears may be related to a currently un-modeled process, or to different types of waves.
Keywords. Meteorology and atmospheric dynamics
(Ther-mospheric dynamics; Waves and tides) – Magnetospheric physics (Auroral phenomena)
1 Introduction
1552 H. F. Parish and L. R. Lyons: Sensitivity studies of the E region neutral response
|___|
|___| |___|
|___| |___|
|___|
Zonal wind Meridional wind
__
---| |___
| |___
| |___
| |___ ___|
|
|___|
| |___
| |___ | |___ ___| |
[image:2.595.52.285.62.237.2]m/s Figure 1
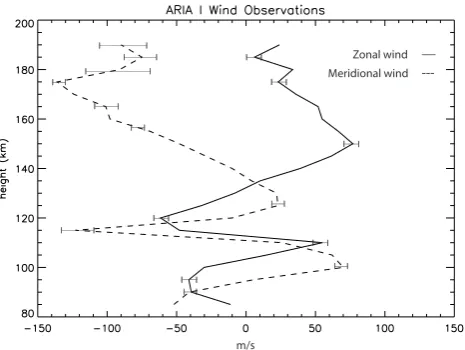
Fig. 1. Neutral winds observed during the ARIA I Campaign on
3 March 1992.
enhanced coupling to the neutrals, and enhanced Joule heat-ing. However, the presence of E region winds of the observed magnitudes is not well explained in terms of auroral acceler-ation processes alone. The mechanisms which generate this strong vertical structure are not completely understood, and the dynamical impact of the strong winds and shears and the effects of their dissipation on the neutral atmosphere and the general circulation are not well known. The enhanced auro-ral precipitation and electric fields at high latitudes associ-ated with the diffuse aurora may have impacts at lower lat-itudes, as well as in the auroral zone, and may cause com-position changes (Parish et al, 1994), and generate gravity waves which propagate to lower and higher latitudes (Parish et al., 1997; Walterscheid and Lyons, 1989; Richmond and Matsushita, 1975). In this work we investigate the factors that affect the E region neutral winds in the region of the postmidnight diffuse aurora.
The origins of the strong vertical structure which is ob-served are not well known, but may be associated with the ef-fects of auroral forcing or the influence of background winds. Within the diffuse aurora the neutral winds are driven by ion drag forcing and Joule heating, which depend on the magni-tude and structure of ion densities and electric fields. These ion densities and electric fields are enhanced within the dif-fuse aurora during periods of enhanced convection. The di-rection of the ion drag forcing varies with altitude in the E region, due to changes in densities and neutral-ion colli-sions, tending towards the direction of the electric fieldEat lower altitudes, and tending to follow theE×B drift direc-tion (for magnetic field,B) at higher altitudes. The chang-ing magnitude and direction of auroral forcchang-ing with height during geomagnetic disturbances may therefore be a possi-ble source of shears in the neutral wind profile. The accel-eration of the neutral winds in the auroral region is also af-fected by the background winds. Cross arc winds tend to
reduce the acceleration due to ion drag driven forcing, since each parcel of the neutral atmosphere spends less time within the region of acceleration if it is displaced by the cross arc wind (Walterscheid and Lyons, 1989; Fuller-Rowell, 1985). The effects of cross arc winds may vary with height due to changes in the direction of the background winds with alti-tude. One source of variation in the direction of the back-ground winds with height could be propagating tides within the background winds. As propagating tides travel upwards the wind vector rotates, which may produce changes in the ion drag driven neutral flow with height, and may also help to generate shears.
Previously, two dimensional (2-D) models have been used to simulate the acceleration of neutral winds and small scale features in the auroral region (e.g. Fuller-Rowell, 1984; St. Maurice and Schunk, 1981; Richmond and Matsushita, 1975). However, features which vary rapidly in the zonal di-rection, such as the strong zonal winds and shears observed in the ARIA measurements, are not well simulated within 2-D models. More recent simulations with 2-2-D models suggest that large neutral winds of around 200 m/s, and even super-sonic winds, may be generated in the auroral zone (scheid et al., 1985; Fuller-Rowell, 1985; Lyons and Walter-scheid, 1985; Walterscheid and Lyons, 1989) although the magnitude of these winds could be reduced by the effects of cross arc winds. Brinkman et al. (1995) aimed to simulate the ARIA I observations using a high resolution 2-D model, making use of values measured during the campaign to give aurora forcing parameters, and they compared the simulated neutral winds with those observed during the campaign. The results of these simulations produced some general agree-ment with the observations, but the magnitudes, strong verti-cal structure and wind shears were not well reproduced.
and showed that the observed winds are not well repro-duced if only auroral forcing processes are present. However, Parish et al. (2003) found that the best agreement with obser-vations within the postmidnight diffuse aurora was produced by a combination of propagating tides and auroral forcing. Observations from the four ARIA campaigns also show that the wind maxima are larger when the geomagnetic activity level is higher (Larsen et al., 1997), suggesting that auroral forcing is important in producing the observed structure. In this paper we will examine the relative significance of prop-agating tides, and the effects of the electric field and ion den-sity structures within the region of the diffuse aurora, in pro-ducing the observed neutral response.
Earlier investigations suggest that changes in the phases of the tidal variations in the background winds may be im-portant (Parish et al., 2003). Several studies have generated climatologies for the amplitudes and phases of propagating tides in the thermosphere (e.g. Manson et al., 2002; Forbes et al., 1994; Forbes and Vial, 1991), but propagating tides show great day to day variability in amplitude and phase (e.g. Pancheva et al., 2000; Beard et al., 1999; Canziani, 1994; Phillips and Briggs, 1991), so the amplitude and phase of the tides for a specific day and location is not well known, in the absence of direct measurements. The sensitivity of the neu-tral response to these changes in the amplitudes and phases of the propagating tides in the background winds is there-fore explored in this paper, as well as the sensitivity of the response to the time when propagating tides are introduced relative to the time at which the auroral forcing becomes im-portant.
It is known that the strength and structure of the large scale convection at high latitudes can be strongly influenced by the orientation of the interplanetary magnetic field (IMF), as has been shown in many satellite and ground based investiga-tions (e.g. Weimer, 1995, 1996; Holt et al., 1987; Heppner and Maynard, 1987). Changes in the high latitude convec-tion pattern may influence the orientaconvec-tion of the auroral arc relative to the global scale background winds, and previous studies suggest that the magnitude of the neutral winds ac-celerated by auroral forcing can be significantly affected by the direction of the large scale background winds, depending on whether the winds are directed along or across the auro-ral arc (Walterscheid and Lyons, 1989; Fuller-Rowell, 1985). The effects of changes in the orientation of the aurora rela-tive to the background wind field, such as those which may be caused by changes in the IMF, will also be investigated below.
2 Observations
In this paper, we make use of measurements within the post-midnight diffuse aurora made during the ARIA I campaign (Anderson et al., 1995; Larsen et al., 1995). The ARIA I campaign took place on 3 March 1992, and consisted of
coor-dinated rocket, ground-based and satellite observations made at Poker Flat, Alaska (65.1◦N, 212.5◦E geographic) during, and in the recovery phase of, a substorm which had an onset time of 10:00 UT. A rocket was launched during the cam-paign at 14:06 UT, making a trimethyl aluminate (TMA) re-lease, which allowed the winds between 90 and 190-km al-titude to be observed. Ion densities and electric fields were inferred from the measurements made throughout the cam-paign (see Brinkman et al., 1995). Four time intervals were defined, i.e. 10:00–11:30, 11:30–12:10, 12:10–13:20, and 13:20–14:10 UT, with different ion density and electric field structures for each interval (see Brinkman et al., 1995; Parish et al., 2003), and these values were used to provide auro-ral forcing inputs for the high resolution model. Zonal and meridional neutral winds measured during the ARIA I cam-paign are shown in Fig. 1 (see also Larsen et al., 1995, 1997).
3 Model
1554 H. F. Parish and L. R. Lyons: Sensitivity studies of the E region neutral response
4 Sensitivity studies
In order to determine the importance of auroral and tidal forcing in generating the strong neutral structure observed, the sensitivity of the neutral response to changes in auroral forcing and tidal forcing parameters has been investigated. The effects of changes in the amplitudes and phases of the different propagating tidal modes in the background winds, for given auroral electric fields and ion densities are dis-cussed in Sect. 4.1. The effects of modifications in the time when the background winds are introduced, are investigated in Sect. 4.2. Section 4.3 examines the effects of changes in the orientation of the aurora relative to the background wind field. The effects of changing the auroral electric field and ion density magnitudes and structures for a given background wind field are described in Sect. 4.4. The relative importance of different forcing mechanisms is discussed in Sect. 5. 4.1 Varying tidal amplitudes and phases in the background
winds
Our earlier study suggested that changes in the phase of the tides in the background wind field in the region of the post-midnight diffuse aurora may have significant effects on the neutral response (Parish et al., 2003). Propagating tides typ-ically show significant day to day variability, but the effects of changes in the amplitudes and phases of the tides within the background wind field on the neutral response within the postmidnight diffuse aurora are not well known. The sensi-tivity of the neutral response to changes in the amplitude and phase of propagating tides in the CTIP background winds has been determined using model simulations, for constant auroral forcing parameters. The electric field and ion density structures are those inferred from measurements made during the ARIA I campaign, as described in Parish et al. (2003) and Brinkman et al. (1995), and simulations run from 10:00 to 14.10 UT for the day of the ARIA I campaign, 3 March 1992, corresponding to the period over which coordinated observa-tions were made. Our previous results (Parish et al., 2003) suggest that higher order (2,5) and (2,6) semidiurnal propa-gating tidal modes are most important in generating vertical structure with features similar to those observed during the ARIA I campaign. Changes in the amplitudes and phases of the (2,5) and (2,6) tidal modes are therefore examined here. 4.1.1 (2,5) tidal mode
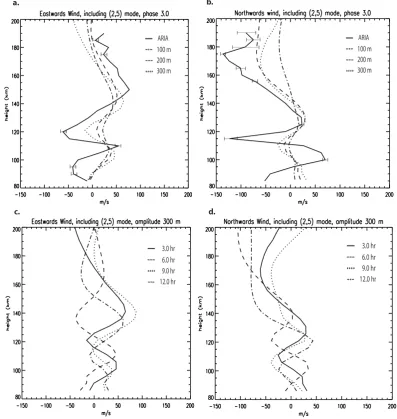
Figures 2a and 2b show examples of the effects of chang-ing the amplitude of the (2,5) tidal mode within the back-ground winds, whilst keeping the auroral forcing parame-ters constant, where the auroral forcing is based on the val-ues observed during the ARIA I campaign, and where back-ground winds are introduced at the start of the first interval. The direction of the background wind is given by the direc-tion of the global winds and tides in the CTIP model,
ro-tated into magnetic coordinates, for CTIP background condi-tions appropriate for the ARIA I measurements. The original ARIA observations are included in this figure for comparison (solid lines). The ranges of amplitudes for the (2,5) mode were based on values found previously to produce reason-able agreement with the ARIA I wind observations (Parish et al., 2003), and to be consistent with values measured in recent satellite and ground based observations (e.g. Hecht et al., 1998; Karpov 1996; Dao et al., 1995). In this example, the amplitude of the geopotential height variation of the (2,5) tidal mode in the background winds has been varied between 100 m and 300 m, for a tidal phase of 3.0 h LT, where prop-agating tides are forced at the lower boundary of the CTIP model at 80-km altitude. As the tidal amplitude is increased the magnitude peaks in the vertical structure stay at the ap-proximately the same height, and the winds directions remain the same, but the magnitudes increase as the tidal amplitude is increased. The magnitude and strength of the shears is not as large as that found in the observations around 110 to 120 km, especially in the case of the meridional wind.
Figures 2c and d show the effects of changing the phase of the (2,5) tidal mode in the background winds, between 0.0 to 12.0 h LT, in increments of 3 h, whilst keeping the same tidal geopotential amplitude constant at 300 m, and with the same auroral forcing parameters, based on the ARIA I dawn side observations. The ARIA observations are not included in this and subsequent figures for clarity. Changing the phase has significant effects on the vertical structure. The heights of the wind maxima and their directions change as the phase of the tidal mode is varied, and the magnitude at a given height may also change, although the strength of the wind shears around 110 to 120 km is still smaller than that observed. 4.1.2 (2,6) tidal mode
---....
_
- -.
3.0 hr 6.0 hr 9.0 hr 12.0 hr
---....
_
- -.
3.0 hr 6.0 hr 9.0 hr 12.0 hr
a. b.
d. c.
100 m 200 m 300 m
---....
_
- -.
ARIA 100 m200 m 300 m
---....
_
- -.
ARIA___
___
___ ___
___
___ ___
___ ___
| | |___|
|___| |___|
|___| |___|
|___|
| |
| |
| |
| |
| |
| |
| |
| |
| |
Fig. 2. (a), (b) Response of the neutral winds to changes in the (2,5) mode tidal amplitude in the background winds compared with ARIA I
observations, and (c), (d) response of the neutral wind to changes in (2,5) mode tidal phase in the background winds.
4.2 Effects of modifying the time when background winds are introduced
Background winds and tides appear to have important ef-fects on the wind structures, and tides are also known to vary significantly (e.g. Pancheva et al. 2000; Beard et al., 1999; Canziani, 1994; Phillips and Briggs, 1991). Experi-ments were performed to determine the effects of introducing background winds and tides at different times relative to the time at which the auroral forcing is introduced, to investigate the effects of changes in the background winds in the pres-ence of auroral forcing. As discussed above, four time inter-vals were defined for the ARIA I measurements (Brinkman et al., 1995; Parish et al., 2003), with different ion density
[image:5.595.97.495.66.486.2]1556 H. F. Parish and L. R. Lyons: Sensitivity studies of the E region neutral response
100 m 200 m 300 m
---....
_
100 m200 m 300 m
---....
_
---....
_
- -.
2.0 hr 5.0 hr 8.0 hr 11.0 hr---....
_
- -.
2.0 hr 5.0 hr 8.0 hr 11.0 hrFigure 3
a. b.
c. d.
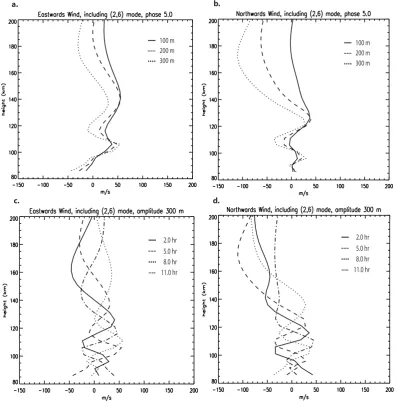
Fig. 3. (a), (b) Response of the neutral winds to changes in the (2,6) mode tidal amplitude in the background winds, and (c), (d) response of
the neutral wind to changes in (2,6) mode tidal phase in the background winds.
especially above around 120-km altitude. The general shape of the vertical wind structure remains the same, but the mag-nitude of the wind at a given height, as well as the altitude of the peak, varies. Wind changes are seen in the E region of around 10 to 20 m/s up to 120-km altitude, for wind mag-nitudes in the range of 10 to 40 m/s, and changes of up to 50 m/s in the zonal wind and 20 m/s in the meridional wind are seen around 130-km altitude. Previous studies (Walter-scheid and Lyons, 1989; Fuller-Rowell, 1985) suggest that background cross auroral winds tend to reduce the accelera-tion of the winds within the auroral arc, and the results shown here suggest that the longer the time that strong background winds, which have a cross arc component, are present, the weaker is the acceleration of the resulting wind structure due to auroral forcing. This suggests that the time history of the background winds as well as the strength of the aurora
forc-ing can be important in shapforc-ing the neutral wind response in the region of the diffuse aurora.
4.3 Changes in orientation of background winds
[image:6.595.100.497.65.468.2]angle 45 angle 35 angle 25 angle 15 angle 5
o
o o o
o
__
....
- -.
---angle 45 angle 35 angle 25 angle 15 angle 5
o
o o o
o
__
---....
- -.
__
...
---interval 1 interval 2 interval 3
- -.
interval 4__
...
---
interval 1interval 2interval 3
- -.
interval 4c. d.
a. b.
- -.. - -..
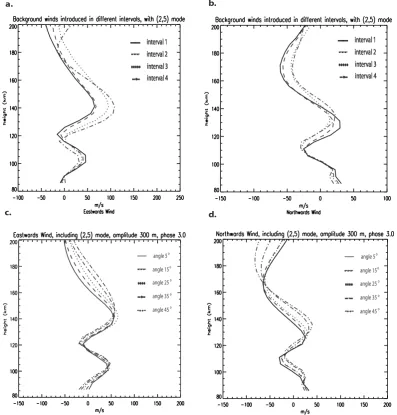
Fig. 4. (a), (b) Effects of introducing background winds including the (2,5) mode at the beginning of different intervals, and (c), (d) effects
of changing the angle between the aurora and the background wind field.
by auroral forcing can be influenced by whether background winds are oriented along or across the auroral arc (Walter-scheid and Lyons, 1989; Fuller-Rowell, 1985).
Figures 4c and d show the effects of varying the angle between the diffuse aurora and the background wind field. Results are shown for a range of values of eastwards angle between 5 deg and 45 deg, where the range of values are per-turbations of 10 to 20 deg around an angle of 25 deg which approximates the angle between the diffuse aurora and the background wind field for the ARIA I observations, based on the angle between geographic and magnetic coordinates at Poker Flat during the ARIA I campaign (given by e.g. NOAA Geophysical Data Center). The chosen range of variations in the orientation of the diffuse aurora for the dawn sector is estimated from statistical studies of the effects of changes in
[image:7.595.99.497.65.481.2]1558 H. F. Parish and L. R. Lyons: Sensitivity studies of the E region neutral response
a. b.
[image:8.595.101.495.65.558.2]d. Figure 5
___ ___
___ ___
___ ___
| | |
| | | | |
| | | |
___
___
___ ___
___
___ ___
___ ___
| |
| |
| |
| | | |
| |
| |
| |
| |
__
...
---- ----.
- -..
x 0.5x 1.0 x 2.0 x 3.0ARIA
__
...
---- ----.
- -..
x 0.5x 1.0 x 2.0 x 3.0ARIA
__
...
---- ----.
x 0.5 x 1.0 x 2.0 x 3.0
__
...
---- ----.
x 0.5 x 1.0 x 2.0 x 3.0
c.
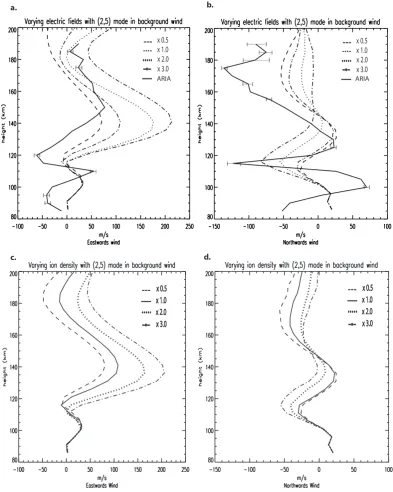
Fig. 5. (a), (b) Response of the neutral winds to varying electric field magnitude, with (2,5) tidal mode in the background winds. The ARIA I
observations are included for comparison. (c), (d) Response of neutral wind to varying ion density enhancement, with (2,5) tidal mode in the background winds.
aurora relative to the background wind field may produce up to around a 20% change in the peak neutral wind magnitudes in the E region.
4.4 Variation of auroral forcing parameters
Studies were also performed to determine the sensitivity of the neutral response to changes in auroral forcing parameters.
4.4.1 Electric field variations
__
...
---
efield *0.5 ions*0.5efield *2.0 ions*2.0 efield *1.0 ions*1.0
- -.
efield *3.0 ions*3.0 - -..ARIA
__
...
---efield *0.5 ions*0.5
efield *2.0 ions*2.0 efield *1.0 ions*1.0
- -.
efield *3.0 ions*3.0 - -.. ARIA___
___
___ ___
___
___ ___
___ ___
| ___
___ ___
___
___ ___ ___ ___ | | | |
| | | |
| | | | | |
| |
| | |
| |
| |
| |
| |
| |
| |
| |
a. b.
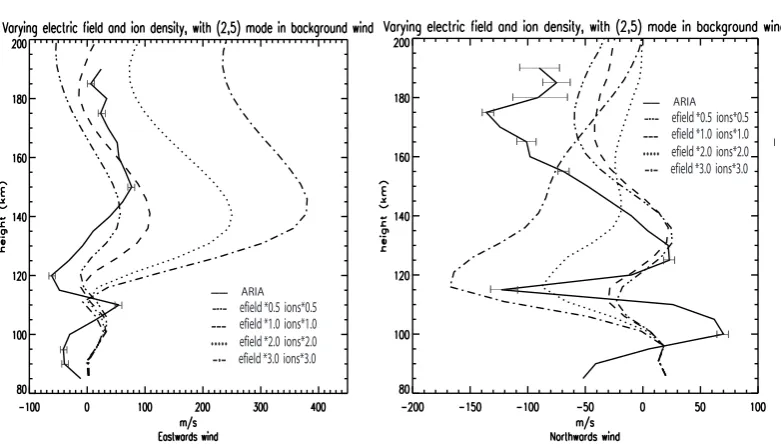
Fig. 6. (a), (b) Response of the neutral winds to varying electric field and ion density enhancement, with (2,5) tidal mode in the background
winds. The ARIA I observations are included for comparison.
between around 3 mV/m at 66 deg latitude during the first in-terval, to around 34 mV/m at 68 deg latitude, in the fourth interval. The maximum ion densities varied from around 1.5×10¹¹m−3at 120-km altitude during the first interval to around 4.0×10¹¹m−3 at 110-km altitude during the fourth interval. Background winds include the (2,5) tidal mode, with amplitude 300 m and phase 3.0 h. In these examples, background winds have been introduced at the start of the fourth interval. In this figure, the original ARIA observations (solid lines) are included for comparison. The electric field has been multiplied by factors between 0.5 and 3.0 relative to the original values estimated from the ARIA I measurements. As the electric field is increased the eastwards wind increases above 120 km, and the peak around 140 km increases signif-icantly, becoming much larger than that observed, but the magnitude of the westwards peak around 115 km is slightly reduced, and is still much smaller than observed. The south-wards wind peak increases around 120 km as the electric field is increased, but the peaks in the structure above that alti-tude are reduced in magnialti-tude. The magnialti-tude of the south-wards peak around 115 km is significantly increased, but is still smaller than the observed peak, and the shears above and below the peak are not as strong as those observed. 4.4.2 Ion density variations
Figures 5c and d show examples of the effects of changing the magnitude of the original ARIA I ion density enhance-ment, whilst the electric field from the same campaign and the background ion density estimated from the Chiu (1975)
model are kept the same. Background winds include the (2,5) tidal mode, with constant amplitude 300 m and phase 3.0 h, introduced at the start of interval four. As the ion density enhancement is increased from 0.5 to 3.0 times the original ARIA I values, the eastwards wind increases sig-nificantly above around 120 km. The southwards wind peak increases around 120 km, but the magnitudes of the peaks in the structure decrease above that altitude. The increase in the southwards wind around 120 km is larger for an increase in the electric field than for a corresponding increase in the ion density (Figs. 5b and d). Changes in the electric field and ion density have only small effects below around 110 km, where the structure appears to be mainly influenced by the tidal variations.
[image:9.595.101.492.77.301.2]1560 H. F. Parish and L. R. Lyons: Sensitivity studies of the E region neutral response
__
...
---interval 1 interval 2 interval 3
- -.
interval 4__
...
---
interval 1interval 2interval 3
- -.
interval 4__
...
---interval 1 interval 2 interval 3
- -.
interval 4__
...
---
interval 1interval 2interval 3
- -.
interval 4Figure 7
a. b.
c. d.
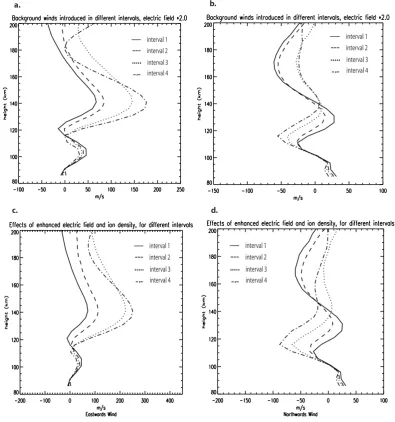
Fig. 7. (a), (b) Effects of multiplying the electric field magnitude by 2.0 for background winds introduced at the beginning of different
intervals. (c), (d) Effects of multiplying both the electric field and ion density enhancement by 2.0, for background winds introduced at the beginning of different intervals.
in magnitude relative to the values produced when either the electric field or ion density enhancement are increased sepa-rately. The southwards wind peak around 115 to 120 km in-creases in height and is enhanced substantially in magnitude when the electric field and ion density enhancement are in-creased together, whilst the northwards peak around 140 km is reduced in magnitude, or reverses direction and merges with the southwards peak around 120 km. Increasing the electric field and ion density enhancement together produces an eastwards peak around 140-km altitude which is larger than that observed, and tends to reduce the magnitude of the westwards peak around 110 to 120 km. The magnitude of the southwards peak around 115 km is increased to magnitudes
similar to those observed, but the peak is much broader in al-titude than in the observations, and the observed northwards peak around 130 km disappears.
[image:10.595.98.494.65.488.2]auroral forcing background winds
first interval fourth interval
__ ---... - -.
auroral forcing background winds
first interval fourth interval
__ ---... - -.
a. b.
d. auroral forcing
background winds first interval fourth interval
__
---... - -.
- -..
ARIA
auroral forcing background winds
first interval fourth interval
__
---... - -.
- -..
ARIA
c.
___
___
___ ___
___
___ ___
___ ___ ___
|
___
___
___
___ ___
___ | | | | |
| | | | | |
| |
| |
| |
| |
| |
| |
| |
| |
| |
| |
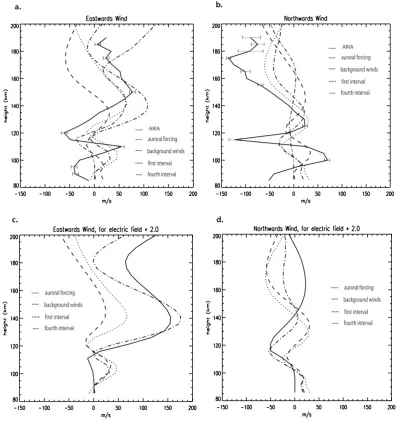
Fig. 8. (a), (b) Response of the neutral winds to different combinations of auroral forcing and background winds and tides, with ARIA I
observations included for comparison. (c), (d) Response of the neutral winds to different combinations of auroral forcing and background winds and tides, with the electric field multiplied by 2.0.
intervals, when the thermosphere has had more time to re-spond to the auroral forcing. The effects of changes in auro-ral forcing parameters, as shown in Figs. 5 and 6, are there-fore less pronounced for cases in which background winds are introduced earlier.
5 Relative importance of different forcing mechanisms
Figures 8a and 8b show the response of the eastwards and northwards winds to different combinations of auroral forc-ing and background winds and tides. The dash-double-dot lines show the effects of auroral forcing only based on the ARIA I observations, with no background winds. The dashed
[image:11.595.98.497.64.486.2]1562 H. F. Parish and L. R. Lyons: Sensitivity studies of the E region neutral response
auroral forcing background winds first interval fourth interval
__
---...
- -.
auroral forcing background winds first interval fourth interval
__ ---... - -.
auroral forcing background winds first interval fourth interval
__
---...
- -.
auroral forcing background winds first interval fourth interval
__ ---... - -.
Figure 9
a. b.
[image:12.595.101.496.64.514.2]c. d.
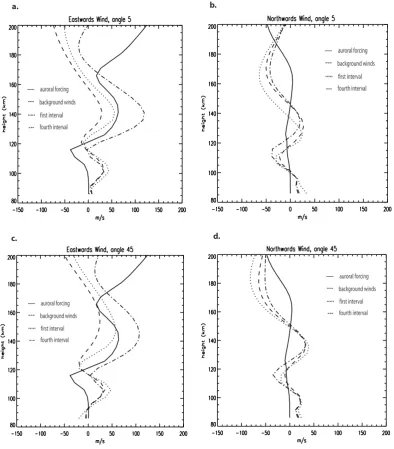
Fig. 9. Response of the neutral winds to different combinations of auroral forcing and background winds and tides, for different angles
between the background wind field and the auroral direction (a), (b) 5 deg, (c), (d) 45 deg.
winds are introduced in the first interval, the structure above 110 km tends to be more affected by tidal variations, for ex-ample in terms of the height of the westwards peak around 120 km, and the magnitude of the eastwards peak around 140 km. When background winds are applied later, the struc-ture above 110 km tends to be more strongly influenced by auroral forcing processes.
Figures 8c and d show the corresponding response of the eastwards and northwards winds for different combinations of auroral forcing and tidal forcing. The electric field in-ferred from the ARIA I measurements has been doubled, whilst maintaining the original ion density. The same (2,5)
show more similarities in structure to those observed during the ARIA I campaign when some tidal variations are present in the background winds, and auroral forcing alone does not produce good agreement with the observations.
If the angle of the background winds is changed relative to the auroral direction, the wind structure is modified as the an-gle changes, as discussed above, but the relative importance of auroral or tidal processes in generating the wind structure tends to show the same dependence on the time when the background winds are introduced, with auroral forcing af-fecting the structure more strongly when background winds are introduced later. For example, Figs. 9a to b and c to d show a comparison of the response of the winds to differ-ent forcing processes for angles of 5 deg and 45 deg, respec-tively. The response shows more similarities to the back-ground wind profile when the backback-ground winds are intro-duced in the first interval, in terms of the heights and magni-tudes of the wind peaks, and shows more similarities to the effects of auroral forcing alone when background winds are introduced in the fourth interval.
6 Discussion
Changes in input parameters for the tidal and auroral forcing can have significant effects on the neutral wind structure, and peak magnitudes similar to those observed can be produced for reasonable values of auroral and tidal forcing parameters. However, the strength of the observed shears, especially the shear between around 110 and 120-km altitude, is not well reproduced. One possible explanation may be the presence of vertical structure within the tides in the background winds, which is on smaller vertical scales than can be resolved with the CTIP model used to generate the background winds for these simulations (one scale height resolution). There may also be waves which are not currently included in the simu-lations, for example gravity waves. Gravity waves can prop-agate up into the lower thermosphere, and may be dissipated there. They tend to have smaller vertical wavelengths than tides, and are currently not included in the CTIP or high reso-lution models. Non-migrating semidiurnal tides may also be important at high latitudes (Portnyagin et al., 1998; Forbes et al., 1995), and are not currently included in the CTIP model. Nonlinear interactions between different kinds of waves, for example between different tidal modes, gravity wave and tides, or gravity waves and planetary waves, may also gen-erate secondary waves with different characteristics from the original variations (e.g. Pancheva et al., 2004; Isler and Fritts, 1996; Forbes and Miyahara, 1991).
In this investigation, higher order semidiurnal propagat-ing tidal modes, which have relatively small vertical wave-lengths, were included in the background winds. The prop-agating diurnal (1,1) tide also has a relatively short vertical wavelength, and does propagate up into the lower thermo-sphere, where it is soon dissipated. The short vertical
wave-length of the (1,1) mode suggests the possibility that this tidal mode could be associated with short scale size vertical vari-ations. However, when the (1,1) mode was included in the CTIP background winds, there were only minor effects on the neutral structure. This is consistent with the fact that the propagating (1,1) mode has a relatively low amplitude at high latitudes, with a peak amplitude around 20 to 30 deg latitude, and the (1,1) mode is also strongly dissipated above around 105-km altitude (e.g. Zhang and Shepherd, 2005).
7 Conclusions
1564 H. F. Parish and L. R. Lyons: Sensitivity studies of the E region neutral response 110 to 120-km altitude as large as that observed, but the
strength of the shears above and below the peak are smaller than those observed, and the magnitude of the westwards peak around 110 to 120 km is still too small relative to the observations. The importance of auroral forcing processes in shaping the neutral wind structure depends on the timing of the introduction of background winds and propagating tides. Background winds and tides, which include a cross arc com-ponent, tend to reduce the effectiveness of auroral forcing if they are introduced near the initiation of significant auroral forcing, when the thermosphere has not had much time to respond to the auroral forcing. This is consistent with previ-ous studies which suggest that cross auroral winds reduce the acceleration due to auroral forcing. This is also found to be true when the orientation of the background winds and tides relative to the auroral direction is varied. A combination of auroral forcing and tidal variations in the background winds reproduces the main features of the observed structure, but the very rapid change of magnitude with height found in the strongest shears is not well simulated, and may be related to a currently unmodeled process, or to various types of wave which are not currently simulated.
Acknowledgements. This work was supported by grant
ATM-0242292 from the National Science Foundation.
Topical Editor U.-P. Hoppe thanks S. Nozawa and another ref-eree for their help in evaluating this paper.
References
Anderson, P. C., Christensen, A. B., Sharber, J. R., Straus, P. R., Hecht, J. H., Larsen, M. F., Kayser, D. C., McEwen, D. J., Sharp, W. E., Koehler, J. A., Sivjee, G. G., Lyons, L. R., Gutierrez, D. J., and Winningham, J. D.: The ARIA I Rocket Campaign, J. Geophys. Res., 100, 17 265–17 284, 1995.
Bailey, G. J., Balan, N., and Su, Y. Z.: The Sheffield University plasmasphere ionosphere model – a review, J. Atmos. Solar-Terr. Phys., 59, 1541–1552, 1997.
Beard, A. G., Mitchell, N. J., Williams, P. J. S., and Kunitake, M.: Non-linear interactions between tides and planetary waves result-ing in periodic tidal variability, J. Atmos. Solar-Terr. Phys., 61, 363–376, 1999.
Brinkman, D. G., Walterscheid, R. L., Lyons, L. R., et al.: E Region Neutral Winds in the Postmidnight Diffuse Aurora During the Atmospheric Response in Aurora I Rocket Campaign, J. Geo-phys. Res., 100, 17 309–17 320, 1995.
Canziani, P. O.: On Tidal Variability and the Existence of Planetary Wave-Like Oscillations in the Upper Thermosphere, 1. Obser-vations of Tidal Variability, J. Atmos. Terr. Phys., 56, 901–912, 1994.
Chapman, S. and Lindzen R.S.: Atmospheric Tides, Thermal and Gravitational, D. Reidel, Dordrecht, Holland, pp. 130–138, 1970. Chiu, Y. T.: An improved Phenomenological Model of Ionospheric
Density, J. Atmos. Terr. Phys., 37, 1563–1570, 1975.
Dao, P. D., Farley, R., Tao, X., and Gardner, C. S.: Lidar Obser-vations of the Temperature Profile Between 25 and 103 km – Evidence of Strong Tidal Perturbation, Geophys. Res. Lett., 22, 2825–2828, 1995.
Forbes, J. M. and Vial, F.: Semidiurnal Tidal Climatology of the E-Region J. Geophys. Res., 96 (A2), 1147–1157, 1991. Forbes, J. M., Jun, G., and Miyahara, S.: On the interactions
be-tween Gravity-Waves and the Diurnal Propagating Tide, Plan. Space Sci., 39, 1249–1257, 1991.
Forbes, J. M., Manson, A. H., Vincent, R. A., et al.: Semidiurnal Tide in the 80–150 KM Region – an Assimilative Data-Analysis J. Atmos. Terr. Phys., 56, 1237–1249, 1994.
Forbes, J. M., Makarov, N. A., and Portnyagin, Y. I.: First results from the meteor radar at south pole: A large 12-hour oscillation with zonal wavenumber one Geophys. Res. Lett. Vol. 22, No. 23, 3247–3250, 1995.
Fuller-Rowell, T. J.: A Two-Dimensional, High Resolution, Nested-Grid Model of the Thermosphere, 1. Neutral Response to an Electric Field “Spike”, J. Geophys. Res., 89, 2971–2990, 1984. Fuller-Rowell, T. J.: A Two-Dimensional, High Resolution,
Nested-Grid Model of the Thermosphere, 2. Response of the Thermo-sphere to Narrow and Broad Electrodynamic Features, J. Geo-phys. Res., 90, 6567–6586, 1985.
Fuller-Rowell, T. J., Rees, D., Quegan, S., et al.: Interactions with Neutral Thermospheric Composition and the Polar Ionosphere Using a Coupled Ionosphere-Thermosphere Model, J. Geophys. Res., 92, 7744–7748, 1987.
Hecht, J. H., Walterscheid, R. L., Roble, R. G., Lieberman, R. S., Talaat, E. R., Howat, S. K. R., Lowe, R. P., Turnbull, D. N., Gardner, C. S., States, R., and Dao, P. D.: A comparison of atmo-spheric tides inferred from observations at the mesopause during ALOHA-93 with the model predictions of the TIME-GCM, J. Geophys. Res., 103, 6307–6321, 1998.
Heppner, J. P. and Maynard, N. C.: Empirical High Latitude Electric Field Models, J. Geophys. Res., 92, 4467–4489, 1987.
Holt, J. M., Wand, R. H., Evans, J. V., et al.: Empirical Models for Plasma Convection at High Latitude from Millstone Hill Obser-vations, J. Geophys. Res., 92, 203–212, 1987.
Isler, J. R. and Fritts, D.: Gravity wave variability and interaction with lower-frequency motions in the mesosphere and lower ther-mosphere over Hawaii J. Atmos. Sci., 53, 37–48, 1996. Johnson, R. M., Wickwar, V. B., Roble, R. G., and Luhmann, J. G.:
Lower-Thermosphere Winds at High Latitude: Chatanika Radar Observations, Ann. Geophys., 5, 383–404, 1987.
Karpov, I. V.: Mode Structure of Tides in the Lower Thermosphere by Wind Measurements on UARS, Geomag. Aeron., 36, 202– 206, 1996.
Larsen, M. F.: A Shear Instability Seeding Mechanism for
Quasiperiodic Radar Echoes, J. Geophys. Res., 105, 24 931– 24 940, 2000.
Larsen, M. F., Mikkelsen, I. S., Meriwether, J. W., et al.: Simul-taneous Observations of Neutral Winds and Electric Fields at Spaced Locations in the Dawn Auroral Oval, J. Geophys. Res., 94, 17 235–17 243, 1989.
Larsen, M. F., Marshall, T. R., Mikkelsen, I. S., et al.: Atmospheric Response in Aurora Experiment: Observations of E and F Region Neutral Winds in a Region of Postmidnight Diffuse Aurora, J. Geophys. Res., 100, 17 299–17 308, 1995.
of Unstable Atmospheric Shear Layers in the Lower E Region in the Postmidnight Auroral Oval, Geophys. Res. Lett., 24, 1915– 1918, 1997.
Larsen, M. F., Fukao, S., Yamamoto, M., Tsunoda, R., Igarashi, K., and Ono, T.: The SEEK Chemical Release Experiment: Ob-served Neutral Wind Profile in a Region of Sporadic E, Geophys. Res. Lett., 25, 1789–1792, 1998.
Lyons, L. R. and Walterscheid, R. L.: Generation of Auroral Omega Bands by Shear Instability of the Neutral Winds, J. Geophys. Res., 90, 12 321–12 329, 1985.
Manson, A. H., Meek, C., Hagan, M., et al.: Seasonal variations of the semi-diurnal and diurnal tides in the MLT: multi-year MF radar observations from 2–70 deg N, modelled tides (GSWM, CMAM), Ann. Geophys., 20, 661–677, 2002.
Mikkelsen, I. S. and Larsen, M. F.: A Numerical Modeling Study of the Interaction Between the Tides and the Circulation Forced by High-Latitude Plasma Convection, J. Geophys. Res., 96, 1203– 1213, 1991.
Mikkelsen, I. S., Jorgensen, T. S., Kelley, M. C., et al.: Neutral Winds and Electric Fields in the Dusk Auroral Oval, 1. Measure-ments, J. Geophys. Res., 86, 1513–1524, 1981.
Mikkelsen, I. S., Friis-Christensen, E., Larsen, M. F., Kelley, M. C., et al.: Simultaneous Measurements of the Thermospheric Wind Profile at Three Separate Positions in the Dusk Auroral Oval, J. Geophys. Res., 92, 4639–4648, 1987.
Pancheva, D., Mukhtarov, P., Mitchell, N. J., Beard, A. G., and Muller, H. G.: A Comparative Study of Winds and Tidal Variabil-ity in the Mesosphere/Lower-Thermosphere Region Over Bul-garia and the UK, Ann. Geophys., 18, 1304–1315, 2000. Pancheva, D., Mitchell, N. J., Manson, A. H., Meek, C. E.,
Ja-cobi, C., Portnyagin, Y., Merzlyakov, E., Hocking, W. K., Mac-Dougall, J., Singer W., et al.: Variability of the quasi-2-day wave observed in the MLT region during the PSMOS campaign of June–August 1999, J. Atmos. and Solar-Terr. Phys., 66, 539–565, 2004.
Parish, H. F., Fuller-Rowell, T. J., Rees, D., Virdi, T. S., and Williams, P. J. S.: Numerical Simulations of the Seasonal Re-sponse of the Thermosphere to Propagating Tides, Adv. Space Res., 10, 287–291, 1990.
Parish, H. F., Gladstone, G. R., and Chakrabarti, S.: Interpretation of Satellite Airglow Observations During the March 22, 1979, Magnetic Storm, Using the Coupled Ionosphere-Thermosphere Model Developed at University College London, J. Geophys. Res., 99, 6155–6166, 1994.
Parish, H. F, Robinson, T. R., Stocker, A. J., and Jones, T. B.: Evi-dence of Gravity Wave Structures in CUTLASS Radar Measure-ments, Adv. Space Res., 20, 1257–1260, 1997.
Parish, H. F., Walterscheid, R. L., Jones, P. W., and Lyons, L. R.: Simulations of the Thermospheric Response to the Diffuse Au-rora Using a Three-Dimensional High Resolution Model, J. Geo-phys. Res., 108(A4),1140, doi:10.1029/2002JA009610, 2003. Phillips, A. and Briggs, B. H.: The day-to-day Variability of Upper
Atomsphere Tidal Winds and Dynamo Currents, J. Atmos. Terr. Phys., 53, 39–47, 1991.
Portnyagin, Y. I., Forbes, J. M., Makarov, N. A., Merzlyakov, E. G., and Palo, S.: The summertime 12-h wind oscillation with zonal wavenumber s=1 in the lower thermosphere over the South Pole, Ann. Geophys., 16, 828–837, 1998.
Richmond, A. D. and Matsushita, S.: Thermospheric Response to a Magnetic Substorm, J. Geophys. Res., 80, 2839–2850, 1975. St.-Maurice, J.-P. and Schunk, R. W.: Ion-Neutral Momentum
Cou-pling Near Discrete High-Latitude Ionospheric Features, J. Geo-phys. Res., 80, 11 299–11 321, 1981.
Walterscheid, R. L. and Lyons, L. R.: The Neutral E Region Zonal WInds During Intense Postmidnight Diffuse Aurora: Response to Observed Particle Fluxes, J. Geophys. Res., 94, 3703–3712, 1989.
Walterscheid, R. L., Lyons, L. R., and Taylor, K. E.: The Perturbed Neutral Circulation in the Vicinity of a Symmetric Stable, J. Geo-phys. Res., 90, 12 235–12 248, 1985.
Wang, C.-P., Lyons, L. R., Chen, M. W., and Wolf, R. A.: Modeling the Quiet Time Inner Plasma Sheet Protons, J. Geophys. Res., 106, 6161, (2000JA000377), 2001.
Weimer, D. R.: Models of High-Latitude Electric Potentials De-rived with a Least Error Fit of Spherical Harmonic Coefficients, J. Geophys. Res., 100, 19 595–19 608, 1995.
Weimer, D. R.: A Flexible, IMF Dependent Model of High-Latitude Electric Potentials Having Space Weather Applications, Geo-phys. Res. Lett., 23, 2549–2552, 1996.
Weimer, D. R.: An improved model of ionospheric electric po-tentials including substorm perturbations and application to the Geospace Environment Modeling November 24, 1996, event, J. Geophys. Res., 106, 407, doi:10.1029/2000JA000604, 2001. Wing, S. and Newell, P. T.: Central Plasma Sheet Ion Properties as
Inferred from Ionospheric Observations, J. Geophys. Res., 103, 6785, doi:10.1029/97JA02994, 1998.
Yamamoto, M., Ono, T., Oya, H., Tsunoda, R. T., Larsen, M. F., Fukao, S., and Yamamoto, M.: Structures in Sporadic-E Ob-served with an Impedance Probe During the SEEK Campaign: Comparisons with Neutral-Wind and Radar-Echo Observations, Geophys. Res. Lett., 25, 1781–1784, 1998.