Biogeosciences, 10, 4073–4085, 2013 www.biogeosciences.net/10/4073/2013/ doi:10.5194/bg-10-4073-2013
© Author(s) 2013. CC Attribution 3.0 License.
EGU Journal Logos (RGB)
Advances in
Geosciences
Open Access
Natural Hazards
and Earth System
Sciences
Open AccessAnnales
Geophysicae
Open AccessNonlinear Processes
in Geophysics
Open AccessAtmospheric
Chemistry
and Physics
Open AccessAtmospheric
Chemistry
and Physics
Open Access DiscussionsAtmospheric
Measurement
Techniques
Open AccessAtmospheric
Measurement
Techniques
Open Access DiscussionsBiogeosciences
Open Access Open Access
Biogeosciences
DiscussionsClimate
of the Past
Open Access Open Access
Climate
of the Past
Discussions
Earth System
Dynamics
Open Access Open Access
Earth System
Dynamics
DiscussionsGeoscientific
Instrumentation
Methods and
Data Systems
Open Access
Geoscientific
Instrumentation
Methods and
Data Systems
Open Access DiscussionsGeoscientific
Model Development
Open Access Open Access
Geoscientific
Model Development
DiscussionsHydrology and
Earth System
Sciences
Open AccessHydrology and
Earth System
Sciences
Open Access DiscussionsOcean Science
Open Access Open Access
Ocean Science
Discussions
Solid Earth
Open Access Open Access
Solid Earth
DiscussionsThe Cryosphere
Open Access Open Access
The Cryosphere
Discussions
Natural Hazards
and Earth System
Sciences
Open Access
Discussions
Temperature effects on carbon-specific respiration rate and sinking
velocity of diatom aggregates – potential implications for deep ocean
export processes
M. H. Iversen1and H. Ploug2,3
1Faculty of Geosciences and MARUM, University of Bremen, Klagenfurter and Leobener Strasse, 28359 Bremen, Germany 2Alfred Wegener Institute for Polar and Marine Research, Am Handelshafen 12, 27570 Bremerhaven, Germany
3University of Gothenburg, Dept. of Biology and Environmental Sciences, P.O. Box 461, 40530 Gothenburg, Sweden
Correspondence to: M. H. Iversen ([email protected])
Received: 28 November 2012 – Published in Biogeosciences Discuss.: 8 January 2013 Revised: 28 March 2013 – Accepted: 17 April 2013 – Published: 20 June 2013
Abstract. Most deep ocean carbon flux profiles show low
and almost constant fluxes of particulate organic carbon (POC) in the deep ocean. However, the reason for the non-changing POC fluxes at depths is unknown. This study presents direct measurements of formation, degradation, and sinking velocity of diatom aggregates from laboratory stud-ies performed at 15◦C and 4◦C during a three-week exper-iment. The average carbon-specific respiration rate during the experiment was 0.12±0.03 at 15◦C, and decreased 3.5-fold when the temperature was lowered to 4◦C. No direct influence of temperature on aggregate sinking speed was ob-served. Using the remineralisation rate measured at 4◦C and an average particle sinking speed of 150 m d−1, calculated carbon fluxes were similar to those collected in deep ocean sediment traps from a global data set, indicating that temper-ature plays a major role for deep ocean fluxes of POC.
1 Introduction
Macroscopic aggregates with diameters larger than 0.5 mm are known as marine snow and formed from detritus, liv-ing organisms, and inorganic matter in both coastal zones and the open ocean (Alldredge and Silver, 1988). Sedimen-tation of marine snow and fecal pellets drives the export of organic matter from the surface to the deep ocean (Fowler and Knauer, 1986; Asper, 1987) and often occurs at sink-ing velocities exceedsink-ing 100 m day−1 (e.g. Alldredge and Gotschalk, 1988; Diercks and Asper, 1997; Asper and Smith,
2003). This is termed “the biological pump” (Volk and Hof-fert, 1985), which is characterised by continuous consump-tion and remineralisaconsump-tion of the settling aggregates, resulting in high attenuation of carbon fluxes with increasing depth in the euphotic and upper mesopelagic zone (e.g. Martin et al., 1987). The efficiency of the biological pump is mainly deter-mined by aggregate sinking velocities and degradation rates of the organic material within settling aggregates, with high export when sinking velocities are high and/or degradation rates are low.
Remineralisation of particulate organic carbon (POC) by heterotrophic organisms in the ocean is high, and often more than 90 % of the produced POC is solubilised and respired before settling through the euphotic zone (Hedges, 1992). Generally, there is strong attenuation of POC fluxes within the upper hundreds of metres in the open ocean, while the carbon fluxes at greater depths appear low and constant (Suess, 1980; Martin et al., 1987; Iversen et al., 2010). This indicates low remineralisation rates and/or increasing ag-gregate sinking velocities with depth. However, the impor-tance of sinking velocity versus remineralisation for the POC fluxes at depth is still unclear.
4074 M. H. Iversen and H. Ploug: Temperature effects on respiration and sinking velocity of diatom aggregates
pressure equivalent to 4000 m reduces the abundance, cell size, and activity for some strains, while others seem to have physiological pressure adaptations (Grossart and Gust, 2009; Tamburini et al., 2009; Nagata et al., 2010). Such adaptations might explain observations of living, active, surface-adapted, particle-associated bacteria at 6000 m depth (Eloe et al., 2011). Recent studies have observed limited exchange be-tween aggregate-attached and free-living microbes through the water column (Delong et al., 2006; Aristegui et al., 2009). This supports laboratory observations of bacteria which be-came permanently attached to aggregates after becoming em-bedded in the matrix within aggregates (Kiørboe et al., 2002). Therefore, a large fraction of the aggregate-associated micro-bial community at depth may be made up by surface-ocean-adapted microorganisms embedded within the aggregates.
Studies of the influence of elevated temperature on micro-bial activity showed increased micromicro-bial degradation of or-ganic matter when exposing microbes to temperatures higher than their natural range (Hoppe et al., 2008; Piontek et al., 2009). However, data for the influence of low temperature on the activity of particle-attached, surface-adapted microbes sinking to the deep ocean is limited, though this knowl-edge would greatly improve our understanding of deep ocean carbon fluxes. While pressure increases linearly with depth, temperature changes often occur over steep gradients in the upper few hundred meters at low and mid-latitudes. This re-sults in rapid temperature transitions over short time scales for aggregate-associated microbes sinking at 100 m per day or more, and, thus, transported from, e.g., 15◦C to 4◦C within days. Therefore, direct studies of how a rapid tem-perature transition from 15◦C to 4◦C affects the aggregate dynamics, activity of attached microbes, and aggregate sink-ing velocities are needed.
In the present study, we directly measured size-specific formation, degradation and sinking velocity of diatom aggre-gates over three weeks at 15◦C and 4◦C. Size, respiration rate, and sinking velocity of individual aggregates were mea-sured in a vertical flow system in which aggregate sinking velocity was balanced by an upward-directed flow velocity. The fluid motion and solute distribution in the vicinity of the aggregates under these experimental conditions were equiv-alent to those in the vicinity of an aggregate sinking through the water column at a velocity equal to the water flow veloc-ity (Kiørboe et al., 2001). The oxygen fluxes to such sinking aggregates were calculated from O2concentration gradients measured at the aggregate–water interface using an O2 mi-crosensor. These methods are non-destructive to the aggre-gates, which were afterwards collected for dry mass, POC, and PON analysis. We used our obtained laboratory data to calculate potential carbon fluxes in the deep cold ocean and compared them with those obtained from sediment traps in a global data set.
2 Material and methods
2.1 Algae cultures
Cultures of the diatom Skeletonema marinoi (formerly known as S. costatum; Sarno et al., 2005) from the North Sea were grown at 15◦C in 0.2 µm filtered seawater (salin-ity 32) enriched with nutrients according to f/2 medium (Guillard, 1975) with silicate added at a concentration of 106 µM. The cultures were kept in a 12 h light period at 150 µmol photons m−2s−1, and allowed a growth period of 13 days, after which stationary growth phase was reached.
2.2 Aggregate formation
The diatom cultures were diluted with GF/F-filtered seawa-ter (salinity 32) to a final concentration of 3×10⁵cells mL−1 and incubated in 1.15 L Plexiglas roller tanks with diame-ters of 14 cm and depths of 7.47 cm to form aggregates. In total, 20 roller tank incubations were rotated on rolling ta-bles at 3 rotations per minute (rpm) at 15◦C in darkness. Af-ter three days of incubation, the temperature was lowered to 4◦C for half of the roller tanks to imitate a rapid settling to the colder waters of the deep ocean. The aggregate dynamics were followed throughout the study by counting the aggre-gates within different size classes in each roller tank.
2.3 Sinking velocity
Individual aggregates were gently transferred with a wide-bore pipette from the roller tanks to a vertical flow system where the sinking velocity of each aggregate was measured (Ploug and Jørgensen, 1999; Ploug et al., 2010). Apart from being GF/F filtered, the water in the vertical flow system was similar to the water in the roller tanks (salinity 32), and the water temperature was adjusted accordingly to the treatment (15 or 4◦C). The flow was adjusted with a needle valve until the aggregate remained suspended at a distance of one ag-gregate diameter above the net, whereby the agag-gregate sink-ing velocity was balanced by the upward-directed seawater flow velocity (Ploug et al., 2010). The sinking velocity of an aggregate was calculated from the flow rate divided by the cross-sectional area of the flow chamber. Triplicate measure-ments of sinking velocity were made for each aggregate. The length of all three aggregate axes (x, y, and z direction) was measured in the flow system using a horizontal dissection microscope with a calibrated ocular. The aggregate volume was calculated by assuming an ellipsoid shape. For compari-son with other aggregate shapes we calculated the equivalent spherical diameter (ESD) of each aggregate.
2.4 Oxygen measurements
and calibrated at air-saturation and at anoxic conditions. The electrode current was measured on a picoamperemeter (Unisense, PA2000) and read on a strip chart recorder (Kipp and Zonen) at high resolution (2 µM O2cm−1). The tip di-ameter of the microsensor was 2 µm. The relative distance between the microelectrode tip and the aggregate surface was measured using a dissection microscope with a calibrated oc-ular micrometer. The 90 % response time of the electrode was<1 s and the stirring sensitivity<0.3 %. The aggregates were suspended by an upward-directed flow that balanced the aggregate’s sinking velocity in the same vertical net-jet flow system as used for estimating sinking velocities (Ploug and Jørgensen, 1999). All measurements were done at the steady state of the oxygen gradients. The water in the flow system (GF/F filtered seawater at 15 or 4◦C with a salinity of 32) was similar to the non-filter water in the roller tanks
2.5 Calculations of respiration rates
Oxygen fluxes and respiration rates were calculated from the oxygen gradients measured at the aggregate–water inter-face under steady-state conditions. The analytical solutions for oxygen distribution and diffusive fluxes at the aggregate– water interface were fitted to measured values by applying the solver routine of the spreadsheet program Excel ver-sion 2003 (Microsoft) as previously described (Ploug et al., 1997). We used temperature- and salinity-corrected oxygen diffusion coefficients of 1.22×10⁻⁵cm2s−1 for 4◦C and 1.72×10⁻⁵cm2s−1for 15◦C in the calculations (Broecker and Peng, 1974). The surface area of ellipsoids (Maas, 1994) was used to calculate total oxygen consumption. The oxygen consumption rate was converted to carbon respiration assum-ing a respiratory quotient of 1 mol O2to 1 mol CO2, as also used in previous studies of O2respiration and POC degrada-tion in diatom aggregates (e.g. Ploug and Grossart, 2000).
2.6 Aggregate dry weight and particulate organic carbon and nitrogen content
The aggregate dry weight (DW) was determined by filter-ing sfilter-ingle aggregates with known volumes onto pre-weighed 0.4 µm polycarbonate filters. Each filter contained one ag-gregate, which was gently washed with de-ionised water, to remove salt, and dried at 60◦C for 48 h before weighing on a Mettler Toledo (UMX 2) scale with a sensitivity of 0.1 µg.
The ratio of particulate organic carbon (POC) to DW was determined by filtering ∼50 aggregates onto pre-weighed 25 mm GF/F filters. The filters were gently rinsed with de-ionised water, and dried at 40◦C for 48 h before being re-weighed on a Mettler Toledo UMX2 balance (sensitivity: 0.1 µg). POC and PON contents of the aggregates on each fil-ter were measured on an EA mass spectromefil-ter (ANCA-SL 20-20, Sercon Ltd. Crewe, UK) with a precision of±0.7 µg C or 0.3 %. At each time point, when measurements were per-formed, a POC to DW ratio and a POC to PON ratio were
calculated for the measured treatment. This was calculated by dividing the amount of POC by the DW of the material on each filter and used to estimate POC content within the measured aggregate by multiplying its DW by the POC : DW ratio for that aggregate treatment and time point.
2.7 Density of aggregates
We used the Navier–Stokes drag equation to calculate the ex-cess density (1ρ) of our aggregates (Stokes, 1851):
1ρ=CDρww 2
4 3gESD
, (1)
whereCDis the dimensionless drag force defined in Eq. (2), ρwis the density of seawater (1.0237 and 1.0254 g cm−3, for a salinity of 32 at 15 and 4◦C, respectively),wis the mea-sured sinking velocity in cm s−1,gis the gravitational accel-eration of 981 cm s−2, and ESD is the equivalent spherical diameter in cm. We calculatedCD using the drag equation for Re>1 given by White (1974):
CD= 24
Re
+
6
1+Re0.5
+0.4, (2)
where Reynolds number (Re) was defined as Re=wESDρw
η , (3)
where η is the dynamic viscosity (1.2158×10⁻² and 1.6498×10⁻²g cm−1s−1, for a salinity of 32 at 15 and 4◦C, respectively).
2.8 Solid hydrated density of aggregate constitutes
4076 M. H. Iversen and H. Ploug: Temperature effects on respiration and sinking velocity of diatom aggregates
layer containing the aggregate was removed from the tube, and its weight was measured on a Mettler Toledo fine bal-ance. Assuming iso-osmotic conditions between the aggre-gate and the density solution, the density of the removed gra-dient layer represents the solid hydrated density of the aggre-gate having neutral buoyancy within it.
2.9 Transparent exopolymer particles (TEP) measurements
TEP concentrations within the aggregates were quantified us-ing the dye-bindus-ing assay for spectrophotometric measure-ments (Passow and Alldredge, 1995). At each measuring point during the incubation period, three nucleopore poly-carbonate filters (0.4 µm) were prepared with one aggre-gate of known volume gently filtered onto each filter. TEPs were stained on the filters for 30 seconds with 500 µL pre-calibrated 0.02 % aqueous solution of alcian blue (8GX) in 0.06 % acetic acid (pH 2.5). The filters were rinsed once with distilled water to remove excess dye, and were submerged in sulfuric acid to dissolve the dye. The TEP concentration (Xantan equivalents) within each aggregate was estimated by measuring one mL of the solvent on a spectrophotometer at 787 nm. The TEP concentration within each aggregate was determined via triplicate measurements of the solvent.
3 Results
3.1 Aggregate formation
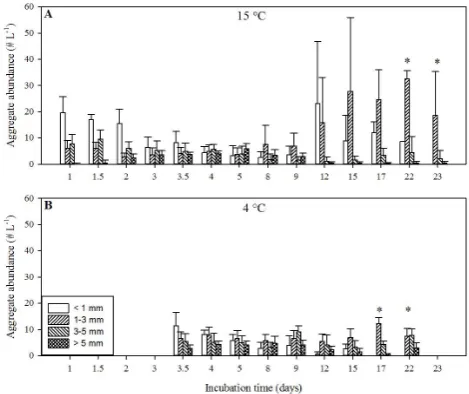
Initial cell concentrations of S. marinoi in all 20 roller tanks were 3×10⁵mL−1, and aggregates were formed within the first 19 h of incubation. A general trend of increasing abun-dance of larger aggregate sizes concurrent with decreas-ing abundance of small aggregate sizes over time was ob-served, indicating that the large aggregates scavenged the small aggregates over time (Fig. 1). However, the aggregates in the 15◦C treatment showed an increase in the abundance of small aggregates (<3 mm) and a decrease in the abun-dance of large aggregates (>3 mm) on day 12, indicating that disaggregation of large aggregates occurred between day 9 and day 12 (Fig. 1a). Thereafter, the small aggregates re-aggregated and/or were scavenged by the larger aggregates, which resulted in continuous increasing maximum aggregate size. The aggregates incubated at 4◦C did not show any in-dication of disaggregation, but had continuously increasing abundance of larger aggregates concurrent with decreasing abundance of small aggregates (Fig. 1b). This was due to constant scavenging of small aggregates by large aggregates throughout the study. We observed aggregates larger than 10 mm in the roller tanks at both temperatures, but those ag-gregates were very fragile and fell apart during sampling; therefore no measurements were performed on aggregates larger than∼7 mm.
31 Fig. 1. Iversen and Ploug
1
2
[image:4.595.310.545.63.260.2]3
Fig. 1. Aggregate evolution over time for the 15 and 4◦C treat-ments in the upper and lower panel, respectively. The aggregates in the 4◦C treatment were kept at 15◦C during the first 3 days of incu-bation. The aggregates were pooled into size classes and counted by eye (MHI) at the different time points during the whole incubation period, and should, thus, be viewed as semi-quantitative measure-ments. The results give good indications of disaggregation during the incubation period, but the actual aggregate abundances are not absolute values, especially not at high abundances. The asterisks at the last two measured time points in each treatments indicate that only replicate measurements were done, but standard deviations are still plotted to indicate the variation in size distribution in the two roller tanks.
3.2 Aggregate dry weight
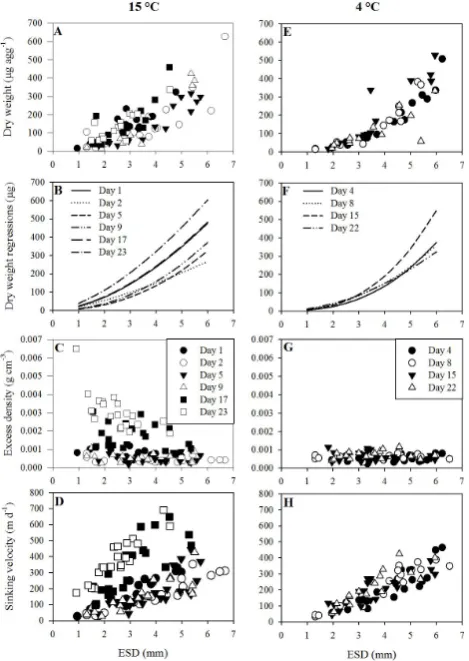
The dry weight (DW) increased with increasing aggregate size for both the aggregates incubated in the 15 and 4◦C treatments (Fig. 2a and e). A tendency of higher variation in size-specific aggregate DW over time was observed for the aggregates incubated at 15◦C compared to those trans-ferred to 4◦C. This was due to a tendency of higher size-specific DW for the 1-, 17-, and 23-day-old aggregates in the 15◦C treatment (Fig. 2b). No changes in size-specific DW over time were observed among the aggregates transferred to 4◦C with the exception of day 15 where aggregates seemed to have higher size-specific DW compared to the other time points in treatment 4◦C (Fig. 2f). However, this was mainly driven by one 3.5 mm aggregate weighing two times more than similarly sized aggregates measured on day 15 (Fig. 2e).
3.3 Aggregate excess density and hydrated solid density
M. H. Iversen and H. Ploug: Temperature effects on respiration and sinking velocity of diatom aggregates 4077
32 Fig. 2. Iversen and Ploug
1
2 3
Fig. 2. Aggregate dry weight (A, E), dry weight power regressions (B, F), excess density (C, G), and sinking velocity (D, H) plot-ted against aggregate equivalent spherical diameter (ESD) for the 15 and 4◦C treatments. The symbols for the day of the different measurements are given in the legends. The legend for the 15◦C treatment (A, B, C, D) is given in graph (C) and the legend for the 4◦C treatment (E, F, G, H) is given in graph (G).
last measurement on day 23 (Fig. 2c). The solid hydrated density of the aggregated material ranged between 1.10 and 1.18 g cm−3 and showed no significant differences within or between the 4 and 15◦C treatments (One Way ANOVA; p >0.38); we have therefore averaged the solid hydrated density of the aggregated material over the entire incuba-tion time for each treatment (Table 1). The constant solid hydrated density during the incubation period shows that the increasing size-specific excess density in the 15◦C treatment after day 17 (Fig. 2c) was not due to a density change of the composite particles within the aggregates, but rather due to an increased compactness of the aggregated material. This is also supported by the increase in size-specific DW after day 17 (Fig. 2a).
3.4 Aggregate sinking velocity
Sinking velocity increased nearly linearly with increasing ag-gregate size in both the 4 and 15◦C treatments (Fig. 2d and h). Lowering the temperature from 15◦C to 4◦C for half of the roller tanks after three days of incubation had no effect on the size-specific sinking speeds, and no significant differ-ence was observed in size-specific sinking speed between the 15◦C (day 2 and 5) and the 4◦C (day 4) treatments (one-way ANCOVA, p >0.1). The aggregates in the 4◦C treatment did not show any significant changes in size-specific sinking velocity over time (Fig. 2h; one-way ANCOVA, p >0.3). The 15◦C treatment had similar size-specific sinking speeds between day 2 and day 9, but we measured significantly in-creased size-specific sinking speeds on day 17 and day 23 (Fig. 2d; one-way ANCOVA, p <0.01). This increase in size-specific sinking speeds coincided with the increase in size-specific excess density (Fig. 2c) and size-specific DW (Fig. 2a) and occurred at the first sampling after the disag-gregation event on day 12 (Fig. 1a).
3.5 Particulate organic carbon and nitrogen content, and respiration rate
[image:5.595.50.285.64.395.2]4078 M. H. Iversen and H. Ploug: Temperature effects on respiration and sinking velocity of diatom aggregates
Table 1. Average (Av.) measurements for Xanthan equivalent (µg Xequv) TEP content to dry weight (DW) ratio, solid hydrated density of the composite particles within the aggregates, POC content to DW ratio, POC content to PON content ratio, and carbon-specific respiration rate (C-spec. deg.) for the 15 and 4◦C treatment over the whole incubation period. Standard deviations are presented together with average values. There were only significant differences in the average values for carbon-specific respiration rate between the two treatments.
Treatment Av. TEP : DW Av. solid hydr. density Av. POC : DW Av. POC : PON Av. C-spec. deg. (µg Xequv TEP µg Agg−1) (g cm−3) (µg POC µg Agg−1) (µg POC µg PON−1) (d−1)
15◦C 0.035±0.008 1.15±0.02 0.25±0.02 5.28±0.47 0.12±0.03∗
4◦C 0.036±0.005 1.14±0.02 0.25±0.01 5.02±0.21 0.03±0.01∗
∗Significant difference between the 15 and 4◦C treatment (Student’sttest;p=0.01).
Page 7, column 1, figure 4: The y-axis on subplot B says POC:PON ratios while the figure legend just says C:N ratios, please correct this to POC:PON ratios in the figure legend so it reads: “…to particulate organic nitrogen ratio (POC:PON ratios)…”
Page 7, column 2, line 24: is the comma after PON degradation correct, or should it rather read: “…POC and POC degradation and C:N ratios were measured…”
Fig. 3. Aggregate particulate organic carbon (POC) content is plot-ted against aggregate equivalent spherical diameter (ESD) (A, D), the respiration rate (Resp. rate) of the microbial community at-tached to each aggregate is plotted against the POC content of the aggregates (B, E), and the carbon-specific respiration rate within each aggregate is plotted against the ESD of the aggregates (C, F). The symbols for the day of the different measurements are given in the legends. The legend for the 15◦C treatment (A, B, C) is given in graph (B) and the legend for the 4◦C treatment (D, E, F) is given in graph (E).
3.6 Aggregate TEP content
The content of transparent exopolymer particles (TEP) within the aggregates in both treatments was low but in-creased with increasing aggregate size from∼0.3 µg TEP
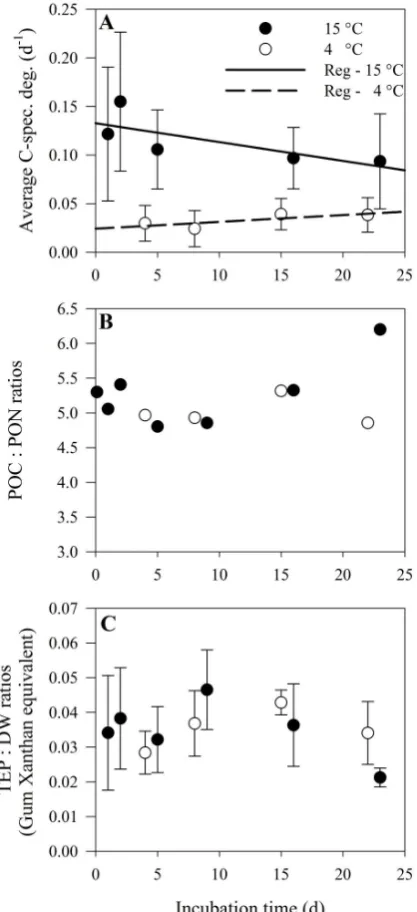
(Xanthan equivalents) in 1-mm-large aggregates and∼8 µg TEP (Xanthan equivalents) in 5-mm-large aggregates. The average TEP content to dry weight ratio of the aggregates was low and constant throughout the study (Fig. 4c). No sig-nificant differences were observed in the TEP content to ag-gregate dry weight ratio over time within the 15 or 4◦C treat-ments or between the two treattreat-ments (One-way ANOVA; p >0.2, Fig. 4c and Table 1).
4 Discussion
There were no significant changes in size distribution of ag-gregates transitioned to 4◦C compared to the aggregates kept at 15◦C (Fig. 1). This indicated that the temperature change did not influence the physical structure of the aggregates, which was also evident from the lack of changes in size-specific dry weight, excess density, and sinking velocity be-tween the two temperature treatments bebe-tween day 4 and 9 (Fig. 2). This shows that temperature changes alone do not influence aggregation and disaggregation processes.
[image:6.595.51.286.210.516.2]Fig. 4. Average carbon-specific respiration rate (Average C-spec. deg.) (A), particulate organic carbon to particulate organic nitrogen ratio (POC : PON ratios) (B), and transparent exopolymer particles to dry weigth ratios (TEP : DW ratios) (C) is plotted against the in-cubation time for both the 15 and 4◦C treatments as solid and open circles, respectively. Standard deviations are indicated in the plot when available.
higher temperatures, e.g. if surface-ocean-adapted microbes attached to settling aggregates are transported to the colder deep ocean. Kiørboe et al. (2002) suggested that detachment of bacteria from aggregates is only physically possible soon after attachment because the bacteria may become embed-ded in the mucus or matrix within the aggregates and, thus, permanently attached. This may explain observations of
dif-ferent prokaryotic communities within aggregates compared to the free water (Moeseneder et al., 2001) and observations of living surface ocean microbes attached to aggregates col-lected at 6000 m (Eloe et al., 2011).
Our experimental set-up excluded changing hydrostatic pressure, and thus did not fully reflect true in situ conditions. Hydrostatic pressure has been suggested to be an impor-tant environmental parameter influencing microbial dynam-ics within aggregates (Tamburini et al., 2003, 2006; Grossart and Gust, 2009). Grossart and Gust (2009) showed that in-creasing hydrostatic pressure at constant temperature reduces bacterial cell size and abundance and can select for species with physiological pressure adaptations. Thus, pressure may also have an effect on microbial turnover of organic matter. This calls for experiments simultaneously investigating the influence from pressure and temperature changes on depth-specific degradation and export processes.
The POC : PON ratio remained relatively stable during our experiment, implying that POC and PON were degraded at similar rates. This has also been observed during the first 3 weeks in other degradation studies of diatom aggregates and other detritus where budgets of POC and PON degra-dation and C : N ratios were measured (Ploug and Grossart, 2000; Verity et al., 2000; Grossart and Ploug, 2001). We ob-served high carbon-specific respiration rates at 15◦C but no change in size-specific POC or DW content over time. This suggests that aggregates are primarily degraded outside-in, which has also been observed earlier (Ploug and Grossart, 2000). Furthermore, continuous scavenging of POC from the surrounding water, likely as suspended diatom cells, or DOC diffusing from the bulk towards aggregates were pre-sumably additional carbon sources to support respiration in aggregates. Efficient scavenging of suspended particles by settling aggregates has been observed in situ (Brzezinski and Nelson, 1995; Kumar et al., 1998; Passow et al., 2001) and may be common in surface waters with high ambient parti-cle concentrations. Thus, scavenging of suspended cells may support substrate for rapid turnover of POC by aggregate-associated microbes.
4080 M. H. Iversen and H. Ploug: Temperature effects on respiration and sinking velocity of diatom aggregates
1988; Iversen and Ploug, 2010), complicating predictions of in situ temperature-dependent settling.
The 15◦C treatment showed significantly higher size-specific sinking velocities and excess density on day 12 and onwards compared to the measurements before day 12 (Fig. 2c and d), coinciding with a disaggregation event be-tween day 9 and 12 (Fig. 1a). The solid matter density of the composite particles within the aggregates, however, did not change over time in the two treatments (Table 1), indicating that the increase in size-specific excess density and sinking velocity was due to a more compact packaging of the com-posite particles within the aggregates after the disaggrega-tion. Ploug et al. (2008) also observed an increase in excess density of S. marinoi aggregates due to increased compact-ness over time. Aggregates descending in situ encounter and scavenge small and dense particles (Kepkay, 1994). This may ballast the aggregates and increase their size-specific sinking velocities and excess densities over time (Ploug et al., 2008; Iversen et al., 2010; Iversen and Ploug, 2010).
One may speculate on the reasons for an increase in the aggregate compactness. The lack of changes in POC : DW, TEP : ESD, and solid hydrated density throughout the study suggests that the increased compactness cannot be explained by remineralisation of relatively buoyant organic material. The size-specific dry weight and excess density of the aggre-gates increased after the disaggregation event, as observed on day 17 and 23 at 15◦C (Fig. 2b and c). Moriceau et al. (2009) suggested that box-shaped diatom frustules might open due to silica dissolution. It is therefore likely that the 3.5-fold-higher carbon-specific degradation rates at 15◦C compared to 4◦C caused the frustules of the diatoms within the ag-gregates to open up and fall apart, explaining the observed disaggregation at 15◦C. This also implies that the individ-ual diatom cells in the roller tanks at 15◦C had a smaller cell size and possibly shorter chain length after day 9. There-fore, the re-aggregation and scavenging of the shorter diatom cell chains and smaller diatom cell sizes would form denser aggregates as compared to the aggregates measured before the disaggregation, since smaller particle sizes can be packed more compact within an aggregate. The absence of disaggre-gation at 4◦C indicates that the low microbial activity did not lead to opening of the diatom frustules.
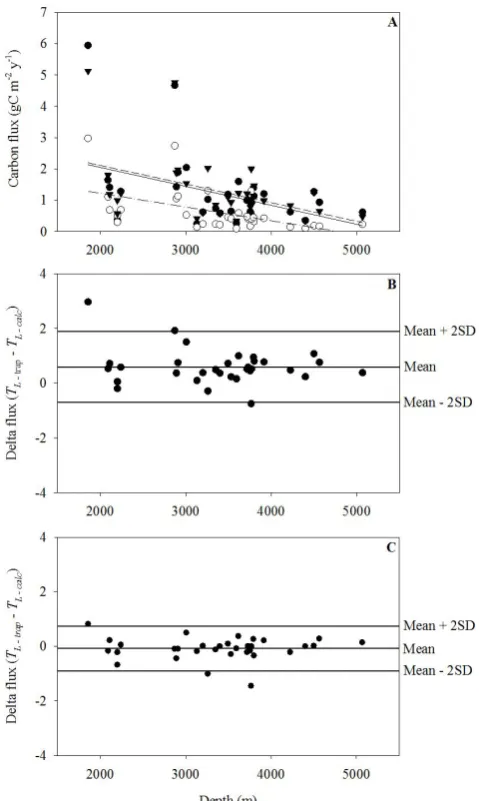
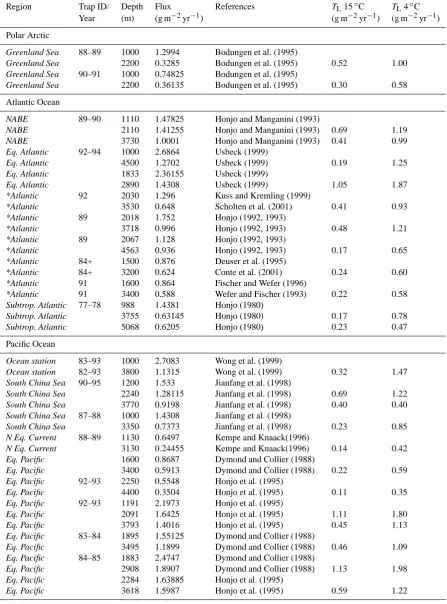
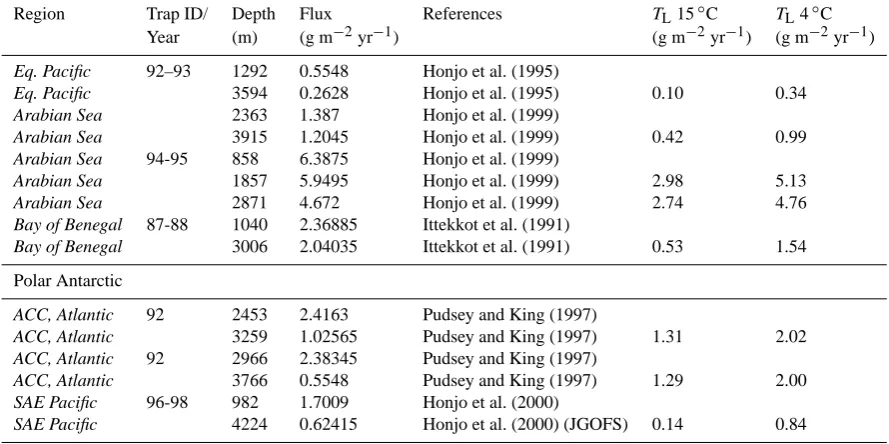
To test how the carbon-specific respiration rates measured at 4 and 15◦C match the attenuation of carbon fluxes in the deep ocean, we selected deep ocean carbon fluxes from global data sets of sediment trap studies (Table 1 in Lutz et al., 2002, and Table 3 in Honjo et al., 2008). We only in-cluded sediment trap studies with two different collection depths from the same study area and time and with an up-per trap depth below 900 m (see Table 2). The carbon flux to a lower sediment trap (TL)was calculated usingLratios found for 4◦C and 15◦C, the collected carbon flux in an up-per trap (TU), and the depth interval between the two traps (1z):
[image:8.595.308.548.82.483.2]35 Fig. 5. Iversen and Ploug
1
2
Table 2. Sediment-trap-derived annual flux to depth selected from Table 1 in Lutz et al. (2002) and Table 3 in Honjo et al. (2008); the data from the latter is indicated with an asterisk. The fluxes are calculated for the lower sediment traps using Eq. (4) and the carbon-specific degradation rates found from the 4◦C (TL4◦C) and the 15◦C (TL15◦C) treatment. An average sinking velocity of 150 m d−1was used in both treatments to findLfrom the average carbon-specific respiration rates for each treatment (Table 1).
Region Trap ID/ Depth Flux References TL15◦C TL4◦C
Year (m) (g m−2yr−1) (g m−2yr−1) (g m−2yr−1)
Polar Arctic
Greenland Sea 88–89 1000 1.2994 Bodungen et al. (1995)
Greenland Sea 2200 0.3285 Bodungen et al. (1995) 0.52 1.00
Greenland Sea 90–91 1000 0.74825 Bodungen et al. (1995)
Greenland Sea 2200 0.36135 Bodungen et al. (1995) 0.30 0.58
Atlantic Ocean
NABE 89–90 1110 1.47825 Honjo and Manganini (1993)
NABE 2110 1.41255 Honjo and Manganini (1993) 0.69 1.19
NABE 3730 1.0001 Honjo and Manganini (1993) 0.41 0.99
Eq. Atlantic 92–94 1000 2.6864 Usbeck (1999)
Eq. Atlantic 4500 1.2702 Usbeck (1999) 0.19 1.25
Eq. Atlantic 1833 2.36155 Usbeck (1999)
Eq. Atlantic 2890 1.4308 Usbeck (1999) 1.05 1.87
*Atlantic 92 2030 1.296 Kuss and Kremling (1999)
*Atlantic 3530 0.648 Scholten et al. (2001) 0.41 0.93
*Atlantic 89 2018 1.752 Honjo (1992, 1993)
*Atlantic 3718 0.996 Honjo (1992, 1993) 0.48 1.21
*Atlantic 89 2067 1.128 Honjo (1992, 1993)
*Atlantic 4563 0.936 Honjo (1992, 1993) 0.17 0.65
*Atlantic 84+ 1500 0.876 Deuser et al. (1995)
*Atlantic 84+ 3200 0.624 Conte et al. (2001) 0.24 0.60
*Atlantic 91 1600 0.864 Fischer and Wefer (1996)
*Atlantic 91 3400 0.588 Wefer and Fischer (1993) 0.22 0.58
Subtrop. Atlantic 77–78 988 1.4381 Honjo (1980)
Subtrop. Atlantic 3755 0.63145 Honjo (1980) 0.17 0.78
Subtrop. Atlantic 5068 0.6205 Honjo (1980) 0.23 0.47
Pacific Ocean
Ocean station 83–93 1000 2.7083 Wong et al. (1999)
Ocean station 82–93 3800 1.1315 Wong et al. (1999) 0.32 1.47
South China Sea 90–95 1200 1.533 Jianfang et al. (1998)
South China Sea 2240 1.28115 Jianfang et al. (1998) 0.69 1.22
South China Sea 3770 0.9198 Jianfang et al. (1998) 0.40 0.40
South China Sea 87–88 1000 1.4308 Jianfang et al. (1998)
South China Sea 3350 0.7373 Jianfang et al. (1998) 0.23 0.85
N Eq. Current 88–89 1130 0.6497 Kempe and Knaack(1996)
N Eq. Current 3130 0.24455 Kempe and Knaack(1996) 0.14 0.42
Eq. Pacific 1600 0.8687 Dymond and Collier (1988)
Eq. Pacific 3400 0.5913 Dymond and Collier (1988) 0.22 0.59
Eq. Pacific 92–93 2250 0.5548 Honjo et al. (1995)
Eq. Pacific 4400 0.3504 Honjo et al. (1995) 0.11 0.35
Eq. Pacific 92–93 1191 2.1973 Honjo et al. (1995)
Eq. Pacific 2091 1.6425 Honjo et al. (1995) 1.11 1.80
Eq. Pacific 3793 1.4016 Honjo et al. (1995) 0.45 1.13
Eq. Pacific 83–84 1895 1.55125 Dymond and Collier (1988)
Eq. Pacific 3495 1.1899 Dymond and Collier (1988) 0.46 1.09
Eq. Pacific 84–85 1883 2.4747 Dymond and Collier (1988)
Eq. Pacific 2908 1.8907 Dymond and Collier (1988) 1.13 1.98
Eq. Pacific 2284 1.63885 Honjo et al. (1995)
4082 M. H. Iversen and H. Ploug: Temperature effects on respiration and sinking velocity of diatom aggregates
Table 2. Continued.
Region Trap ID/ Depth Flux References TL15◦C TL4◦C
Year (m) (g m−2yr−1) (g m−2yr−1) (g m−2yr−1)
Eq. Pacific 92–93 1292 0.5548 Honjo et al. (1995)
Eq. Pacific 3594 0.2628 Honjo et al. (1995) 0.10 0.34
Arabian Sea 2363 1.387 Honjo et al. (1999)
Arabian Sea 3915 1.2045 Honjo et al. (1999) 0.42 0.99
Arabian Sea 94-95 858 6.3875 Honjo et al. (1999)
Arabian Sea 1857 5.9495 Honjo et al. (1999) 2.98 5.13
Arabian Sea 2871 4.672 Honjo et al. (1999) 2.74 4.76
Bay of Benegal 87-88 1040 2.36885 Ittekkot et al. (1991)
Bay of Benegal 3006 2.04035 Ittekkot et al. (1991) 0.53 1.54
Polar Antarctic
ACC, Atlantic 92 2453 2.4163 Pudsey and King (1997)
ACC, Atlantic 3259 1.02565 Pudsey and King (1997) 1.31 2.02
ACC, Atlantic 92 2966 2.38345 Pudsey and King (1997)
ACC, Atlantic 3766 0.5548 Pudsey and King (1997) 1.29 2.00
SAE Pacific 96-98 982 1.7009 Honjo et al. (2000)
SAE Pacific 4224 0.62415 Honjo et al. (2000) (JGOFS) 0.14 0.84
TL=TU−(1−e−L·1z)·TU, (4)
whereLis the fractional remineralisation per metre settled. Lwas calculated from the average carbon-specific respira-tion rate for the 4 and 15◦C treatments (Table 1) divided by an average sinking velocity of 150 m d−1 for both treat-ments (Berelson, 2002; Fischer and Karakas, 2009).Lwas 2.20×10⁻⁴and 7.64×10⁻⁴m−1for the 4◦C and 15◦C treat-ment, respectively.
TLcalculated using the 4◦C carbon-specific respiration fit-ted surprisingly well to the trap-collecfit-tedTL, while the 3.5-fold higher carbon-specific respiration rate at 15◦C underes-timated the trap-collectedTL(Fig. 5). This indicates that rel-atively good estimates of deep ocean fluxes can be obtained by inclusions of temperature limitations on respiratory activ-ity alone. Knowledge of particle size spectra at depths would provide better calculations ofTL since it would allow size-specific sinking speeds instead of average sinking speed for all POC to calculateL. Further, temperature deviations from 4◦C would influence the microbial activity and, thus, the mi-crobial degradation rates. However, the relatively good pre-dictability of these simple estimates indicates that tempera-ture plays a major role for deep ocean fluxes of POC, possi-bly caused by embedding of temperature-sensitive microbes from the surface ocean within the aggregates at depths.
Acknowledgements. We thank Christiane Lorenzen for assistance during POC measurements. The oxygen microsensors were constructed by Gaby Eickert, Ines Schr¨oder, and Karin Hohmann, Max Planck Institute for Marine Microbiology, Bremen. We thank George Jackson, Gerhard Fischer, and Uta Passow for discussions
that improved the manuscript. This study was supported by the Helmholtz Association (to HP), the Alfred Wegener Institute for Polar and Marine Research (to MHI and HP), by the DFG-Research Center/Cluster of Excellence “The Ocean in the Earth System” (to MHI and HP), and the Swedish Research Council (VR, Dnr: 621-2011-4406 to HP).
Edited by: K. Suzuki
References
Alldredge, A. and Gotschalk, C.: In situ settling behavior of marine snow, Limnol. Oceanogr., 33, 339–351, 1988.
Alldredge, A. L. and Silver, M. W.: Characteristics, dynamics and significance of marine snow, Prog. Oceanogr., 20, 41–82, 1988. Aristegui, J., Gasol, J. M., Duarte, C. M., and Herndl, G. J.:
Mi-crobial oceanography of the dark ocean’s pelagic realm, Limnol. Oceanogr., 54, 1501–1529, 2009.
Asper, V. L.: Measuring the flux and sinking speed of marine snow aggregates., Deep-Sea Res., 34, 1–17, 1987.
Asper, V. L. and Smith Jr., W. O.: Abundance, distribution and sink-ing rates of aggregates in the Ross Sea, Antarctica, Deep-Sea Res. Pt. I, 50, 131–150, 2003.
Berelson, W. M.: Particle settling rates increase with depth on the ocean, Deep-Sea Res. Pt. II, 49, 237–251, 2002.
Bodungen, B. V., Antia, A., Bauerfeind, E., Haupt, O., Koeve, W., Machado, E., Peeken, I., Peinert, R., Reitmeier, S., Thomsen, C., Voss, M., Wunsch, M., Zeller, U., and Zeitzschel, B.: Pelagic processes and vertical flux of particles: an overview of a long-term comparative study in the Norwegian Sea and Greenland Sea, Geol. Rundsch., 84, 11–27, 1995.
Brzezinski, M. A. and Nelson, D. M.: The annual silica cycle in the Sargasso Sea near Bermuda, Deep-Sea Res. Pt. I, 42, 1215–1237, 1995.
Conte, M. H., Deuser, W. G., Ralf, N., and Ross, E. H.: Seasonal and interannual variability in deep ocean particle fluxes at the Oceanic Flux Program (OFP), Bermuda Atlantic Time-Series (BAT) site in the Western Sargasso Sea near Bermuda, Deep-Sea Res. II, 48, 1471–1505, 2001.
Delong, E. F., Preston, C. M., Mincer, T., Rich, V., Hallam, S. J., Frigaard, N.-U., Martinez, A., Sullivan, M. B., Edwards, R., Brito, B. R., Chrisholm, S. W., and Karl, D. M.: Community Ge-nomics Among Stratified Microbial Assemblages in the Ocean’s Interior, Science, 311, 496–503, 2006.
Deuser, W. G., Jickells, T. D., King, P., and Commeau, J. A.: Decadal and annual changes in biogenic opal and carbonate fluxes to the deep Sargasso Sea, Deep-Sea Res. I, 42, 1923–1932, 1995.
Diercks, A. R. and Asper, V. L.: In situ settling speeds of marine snow aggregates below the mixed layer: Black Sea and Gulf of Mexico, Deep-Sea Res Pt. I, 44, 385–398, 1997.
Dymond, J. and Collier, R.: Biogenic particle fluxes in the equato-rial Pacific: Evidence for both high and low productivity during 1982-1983 El Nino, Global Biogeochem. Cy., 2, 129–137, 1988. Eloe, E. A., Shulse, C. N., Fadrosh, D. W., Williamson, S. J., Allen, E. E., and Bartlett, D. H.: Compositional differences in particle-associated and free-living microbial assemblages from an ex-treme deep-ocean environment, Environ. Microb. Rep., 3, 449– 458, 2011.
Feinberg, L. R. and Dam, H. G.: Effects of diet on dimensions, density and sinking rates of fecal pellets of the copepod Acar-tia tonsa, Mar. Ecol. Prog. Ser., 175, 87–96, 1998.
Fischer, G. and Wefer, G.: Long-term observation of particle fluxes in the eastern Atlantic: Seasonality, changes of flux with depth and comparison with the sediment record, South Atlantic – Present and Past Circulation, 325–344, 1996.
Fischer, G. and Karakas,, G.: Sinking rates and ballast composi-tion of particles in the Atlantic Ocean: implicacomposi-tions for the or-ganic carbon fluxes to the deep ocean, Biogeosciences, 6, 85– 102, doi:10.5194/bg-6-85-2009, 2009.
Fowler, S. W. and Knauer, G. A.: The role of large particles in the transport of elements and organic compounds through the oceanic water column, Prog. Oceanogr., 16, 147–194, 1986. Grossart, H. and Gust, G.: Hydrostatic pressure affects physiology
and community structure of marine bacteria during settling to 4000 m: an experimental approach, Mar. Ecol. Prog. Ser, 390, 97–104, 2009.
Grossart, H. P. and Ploug, H.: Microbial degradation of organic car-bon and nitrogen on diatom aggregates, Limnol. Oceanogr., 46, 267–277, 2001.
Guillard, R. L.: Culture of phytoplankton for feeding marine inver-tebrates, in: Culture of marine invertebrate animals, edited by: Smith, W., L., and Chanley, M., H., Plenum Press, New York, London, 29–60, 1975.
Hedges, J. I.: Global biogeochemical cycles: Progress and prob-lems, Mar. Chem., 39, 67–93, 1992.
Honjo, S.: Material fluxes and modes of sedimentation in the mesopelagic and bathypelagic zones, J. Mar. Res., 38, 53–97, 1980.
Honjo, S.: Data presented in Honjo et al. 2008, Prog. Oceanogr., 76, 217–285, 1992.
Honjo, S.: Data presented in Honjo et al. 2008, Prog. Oceanogr., 76, 217–285, 1993.
Honjo, S. and Manganini, S. J.: Annual biogenic particle fluxes to the interior of the North Atlantic Ocean; studied at 34◦N 21◦W and 48◦N 21◦W, edited by: Ducklow, H. W. and Harris, R. P., 1993.
Honjo, S., Francois, R., Manganini, S., Dymond, J., and Collier, R.: Particle fluxes to the interior of the Southern Ocean in the West-ern Pacific sector along 170◦W, Deep-Sea Res. II, 47, 3521– 3548, 2000.
Honjo, S., Manganini, S. J., Krishfield, R. A., and Francois, R.: Par-ticulate organic carbon fluxes to the ocean interior and factors controlling the biological pump: A synthesis of global sediment trap programs since 1983, Prog. Oceanogr., 76, 217–285, 2008. Hoppe, H. G., Breithaupt, P., Walther, K., Koppe, R., Bleck, S.,
Sommer, U., and J¨urgens, K.: Climate warming in winter af-fect the coupling between phytoplankton and bacteria during the spring bloom: a mesocosm study, Aquat. Microb. Ecol., 51, 105– 115, 2008.
Ittekkot, V., Nair, R., Honjo, S., Ramaswamy, V., Bartsch, M., Man-ganini, S. J., and Desai, B. N.: Enhanced particle flux in Bay of Bengal induced by injection of water, Nature, 351, 385–387, 1991.
Iversen, M. H. and Ploug, H.: Ballast minerals and the sinking carbon flux in the ocean: carbon-specific respiration rates and sinking velocity of marine snow aggregates, Biogeosciences, 7, 2613–2624, doi:10.5194/bg-7-2613-2010, 2010.
Iversen, M. H., Nowald, N., Ploug, H., Jackson, G. A., and Fis-cher, G.: High resolution profiles of vertical particulate organic matter export off Cape Blanc, Mauritania: Degradation pro-cesses and ballasting effects, Deep-Sea Res. Pt. I, 57, 771–784, doi:10.1016/j.dsr.2010.03.007, 2010.
Jianfang, C., Lianfu, Y., Weisner, M. G., Ronghua, C., Yulong, Z., and Wong, K. H.: Estimations of primary productivity and ex-port production in the South China Sea based on sediment trap experiments, Chin. Sci. Bull., 43, 585–586, 1998.
Kempe, S., and Knaack, H.: Vertical particle flux in the western Pa-cific below the north equatorial current and the equatorial counter current, in: Particle flux in the Ocean, edited by: Ittekkot, V., Sch¨afer, P., Honjo, S., and Depetris, P. J., John Wiley and Sons, West Sussex, 313–323, 1996.
Kepkay, P. E.: Particle aggregation and the biological reactivity of colloids, Mar. Ecol. Prog. Ser, 109, 293–304, 1994.
Kiørboe, T., Ploug, H., and Thygesen, U. H.: Fluid motion and so-lute distribution around sinking aggregates. I. Small-scale fluxes and heterogeneity of nutrients in the pelagic environment, Mar. Ecol. Prog. Ser., 211, 1–13, 2001.
Kiørboe, T., Grossart, H. P., Ploug, H., and Tang, K.: Mecha-nisms and Rates of Bacterial Colonization of Sinking Aggre-gates, Appl. Environ. Microbiol., 68, 3996–4006, 2002. Kumar, M. D., Sarma, V. V. S. S., Ramaiah, N., Gauns, M., and
de Sousa, S. N.: Biogeochemical significance of transport ex-opolymer particles in the Indian Ocean, Geophys. Res. Lett., 25, 81–84, 1998.
4084 M. H. Iversen and H. Ploug: Temperature effects on respiration and sinking velocity of diatom aggregates
Lutz, M., Dunbar, R., and Caldeira, K.: Regional variabil-ity in the vertical flux of particulate organic carbon in the ocean interior, Global Biogeochem. Cy., 16, 1–18, doi:10.1029/2000GB001383, 2002.
Maas, L. R. M.: On the surface area of an ellipsoid and related in-tegrals of elliptic inin-tegrals, J. Comp. Appl. Math., 51, 237–249, 1994.
Martin, J. H., Knauer, G. A., Karl, D. M., and Broenkow, W. W.: VERTEX: carbon cycling in the northeast Pacific, Deep-Sea Res., 34, 267–285, 1987.
Moeseneder, M. M., Winter, C., and Herndl, G. J.: Horizontal and vertical complexity of attached and free-living bacteria of the eastern Mediterranean Sea, determined by 16S rDNA and 16S rRNA fingerprints, Limnol. Oceanogr., 46, 95–107, 2001. Moriceau, B., Goutx, M., Guigue, C., Lee, C., Armstrong, R. A.,
Duflos, M., Tamburini, C., Charri`ere, B., and Ragueneau, O.: Si-C interactions during degradation of the diatom Skeletonema marinoi, Deep-Sea Res. Pt. II, 56, 1381–1395, 2009.
Nagata, T., Tamburini, C., Ar´ıstegui, J., Baltar, F., Bochdansky, A. B., Fonda-Umani, S., Fukuda, H., Gogou, A., Hansell, D. A., Hansman, R. L., Herndl, G. J., Panagiotopoulos, C., Reinthaler, T., Sohrin, R., Verdugo, P., Yamada, N., Yamashita, Y., Yokokawa, T., and Bartlett, D. H.: Emerging concepts on mi-crobial processes in the bathypelagic ocean – ecology, biogeo-chemistry, and genomics, Deep-Sea Res. Pt. II, 57, 1519–1536, doi:10.1016/j.dsr2.2010.02.019, 2010.
Passow, U. and Alldredge, A.: A dye-binding assay for the spec-trophotometric measurement of transparent exopolymer particles (TEP), Limnol. Oceanogr., 40, 1326–1335, 1995.
Passow, U., Shipe, R. F., Murray, A., Pak, D. K., Brzezinski, M. A., and Alldredge, A. L.: The origin of transparent exopolymer particles (TEP) and their role in the sedimentation of particulate matter, Cont. Shelf Res., 21, 327–346, 2001.
Piontek, J., H¨andel, N., Langer, G., Wohlers, J., Riebesell, U., and Engel, A.: Effects of rising temperature on the formation and mi-crobial degradation of marine diatom aggregates, Aquat. Microb. Ecol., 54, 305–318, 2009.
Ploug, H.: Small-scale oxygen fluxes and remineralization in sink-ing aggregates, Limnol. Oceanogr., 46, 1624–1631, 2001. Ploug, H. and Grossart, H. P.: Bacterial growth and grazing on
di-atom aggregates: Respiratory carbon turnover as a function of ag-gregate size and sinking velocity, Limnol. Oceanogr., 45, 1467– 1475, 2000.
Ploug, H. and Jørgensen, B. B.: A net-jet flow system for mass transfer and microsensor studies of sinking aggregates, Mar. Ecol. Prog. Ser., 176, 279–290, 1999.
Ploug, H., Kuehl, M., Buchholz-Cleven, B., and Jørgensen, B. B.: Anoxic aggregates – An ephemeral phenomenon in the pelagic environment?, Aquat. Microb. Ecol., 13, 285–294, 1997. Ploug, H., Grossart, H. P., Azam, F., and Jørgensen, B. B.:
Pho-tosynthesis, respiration, and carbon turnover in sinking marine snow from surface waters of Southern California Bight: Impli-cations for the carbon cycle in the ocean, Mar. Ecol. Prog. Ser., 179, 1–11, 1999.
Ploug, H., Iversen, M. H., and Fischer, G.: Ballast, sinking veloc-ity, and apparent diffusivity within marine snow and zooplankton fecal pellets: Implications for substrate turnover by attached bac-teria, Limnol. Oceanogr., 53, 1878–1886, 2008.
Ploug, H., Terbr¨uggen, A., Kaufmann, A., Wolf-Gladrow, D., and Passow, U.: A novel method to measure particle sinking veloc-ity in vitro, and its comparison to three other in vitro methods, Limnol. Oceanogr.-Methods, 8, 386–393, 2010.
Pudsey, C. J. and King, P.: Particle fluxes, benthic processes and the palaeoenvironmental record in the northern Weddell Sea, Deep-Sea Res. I, 44, 1841–1876, 1997.
Revsbech, N. P.: An oxygen microsensor with a guard cathode, Lim-nol. Oceanogr., 34, 474–478, 1989.
Sarno, D., Kooistra, W. H. C. F., Medlin, L. K., Percopo, I., and Zingone, A.: Diversity in the genus Skeletonema (Bacillario-phyceae): II An assessment of the taxonomy of S. costatum-like species with the description of four new species, J. Phycol., 41, 151–176, 2005.
Scholten, J. C., Fietzke, J., Vogler, S., Loeff, M. M. R., Mangini, A., Koeve, W., Waniek, J., Stoffers, P., Antia, A., and Kuss, J.: Trapping efficiencies of sediment traps from the deep east-ern North Atlantic: the 230Th calibration, Deep-Sea Res. II, 48, 2383–2408, 2001.
Schwinghamer, P.: Seperation and concentration of living dinoflag-ellate resting cysts from marine sediments via density-gradient centrifugation, Limnol. Oceanogr, 36, 588–592, 1991.
Stemmann, L., Jackson, G. A., and Gorsky, G.: A vertical model of particle size distributions and fluxes in the midwater column that includes biological and physical processes; Part II, Application to a three year survey in the NW Mediterranean Sea, Deep-Sea Res. Pt. I, 51, 885–908, 2004.
Stokes, G. G.: On the effect of the internal friction of fluids on the motion of pendulums, Transaction of the Cambridge Philosophi-cal Society, 9, 8–106, 1851.
Suess, E.: Particulate organic carbon flux in the oceans – surface productivity and oxygen utilization, Nature, 288, 260–263, 1980. Tamburini, C., Garcin, J., and Bianchi, A.: Role of deep-sea bacte-ria in organic matter mineralization and adaptation to hydrostatic pressure conditions in the NW Mediterranean Sea, Aquat. Mi-crob. Ecol., 32, 209–218, 2003.
Tamburini, C., Garcin, J., Gregori, G., Leblanc, K., Rimmelin, P., and Kirchman, D. L.: Pressure effects on surface Mediterranean prokaryotes and biogenic silica dissolution during a diatom sink-ing experiment, Aquat. Microb. Ecol., 43, 267–276, 2006. Tamburini, C., Goutx, M., Guigue, C., Garel, M., Lefevre, D.,
Charri`ere, B., Sempere, R., Pepa, S., Peterson, M., Wakeham, S. G., and Lee, C.: Effects of hydrostatic pressure on microbial alteration of sinking fecal pellets, Deep-Sea Res. Pt. II, 56, 1533– 1546, 2009.
Usbeck, R.: Modeling of marine biogeochemical cycles with an em-phasis on vertical particle fluxes, Rep. Polar Res., 332, 105 pp., 1999.
Verity, P. G., Williams, S. C., and Hong, Y.: Formation, degrada-tion, and mass:volume ratios of detritus derived from decaying phytoplankton, Mar. Ecol. Prog. Ser., 207, 53–68, 2000. Volk, T. and Hoffert, M. I.: Ocean carbon pumps: analysis of
rela-tive strengths and efficiencies in ocean-driven atmospheric CO2 changes, in: The Carbon Cycle and Atmospheric CO2: Natural Variations Archean to Present, edited by: Sundquist, E. T. and Broecker, W. S., AGU, Washington DC, 99–110, 1985. Wefer, G. and Fischer, G.: Seasonal patterns of vertical particle flux
White, F. M.: Viscous fluid flow, 2nd Edn., McGraw-Hill ed., Inc. New York, New York, 1974.
White, P. A., Kalff, J., Rasmussen, J. B., and Gasol, J. M.: The Ef-fect of Temperature and Algal Biomass on Bacterial Production and Specific Growth Rate in Freshwater and Marine Habitats, Microb. Ecol., 21, 99–118, 1991.