R E S E A R C H
Open Access
The effectiveness of psychological
interventions for fatigue in cancer
survivors: systematic review of randomised
controlled trials
T. K. Corbett
1*, A. Groarke
2, D. Devane
3, E. Carr
2, J. C. Walsh
2and B. E. McGuire
2Abstract
Background:Fatigue is a common symptom in cancer patients that can persist beyond the curative treatment phase. This systematic review evaluated the effectiveness of psychological interventions for cancer-related fatigue in post-treatment cancer survivors.
Methods:We searched relevant online databases and sources of grey literature. Randomised controlled trials (RCTs) evaluating psychological interventions in adult cancer patients after the completion of treatment, with fatigue as an outcome measure, were included. Two review authors extracted data independently from the selected studies and assessed the methodological quality using the Cochrane Collaboration Risk of Bias Tool.
Results:Thirty-three psychological interventions were identified. The sample size of the included studies varied between 28 and 409, with 4525 participants overall. Twenty-three of the included studies reported a significant effect of the interventions on reducing fatigue in cancer survivors. Most interventions focused on psychoeducation, mindfulness, cognitive or behaviour therapy-oriented strategies. However, studies differed widely in terms of measurement tools used to assess fatigue, mode, duration and frequency of the intervention delivery.
Conclusions:This review showed some tentative support for psychological interventions for fatigue after cancer treatment. However, as the RCTs were heterogeneous in nature and the number of high-quality studies was limited, definitive conclusions are not yet possible. With the growing need for stage-specific research in cancer, this review sought to inform current practice and to summarise the existing evidence base of randomised controlled trials in the area.
Systematic review registration:PROSPERO registration number: CRD42014015219.
Keywords:Cancer, Psychological, Survivorship, Fatigue, Post-treatment, Cancer-related fatigue, Psychooncology, Review, Narrative review
Highlights
The majority of treatments comprise standard components of CBT, mindfulness and/or psychoeducation. Studies comparing active psychological therapies are scarce. There is insufficient high-quality evidence to recommend
psychological treatment as having possible benefit for cancer-related fatigue in post-treatment cancer survivors. There is no reported evidence of adverse effects.
The majority of the evidence is for the treatment of fatigue in those with breast cancer but there is insufficient evidence to indicate if the treatments are more effective for one type of cancer over another.
The interventions appear to have had some impact on mood, self-efficacy to cope with fatigue and qual-ity of life/functional impact of fatigue. However,
© The Author(s). 2019Open Access This article is distributed under the terms of the Creative Commons Attribution 4.0 International License (http://creativecommons.org/licenses/by/4.0/), which permits unrestricted use, distribution, and reproduction in any medium, provided you give appropriate credit to the original author(s) and the source, provide a link to the Creative Commons license, and indicate if changes were made. The Creative Commons Public Domain Dedication waiver (http://creativecommons.org/publicdomain/zero/1.0/) applies to the data made available in this article, unless otherwise stated.
* Correspondence:T.k.corbett@soton.ac.uk
1NIHR ARC Wessex, School of Health Sciences, University of Southampton,
Highfield, Southampton SO17 1BJ, UK
there appeared to be little impact of the interven-tions on pain. Interveninterven-tions designed specifically for CrF did not tend to assess sleep variables.
With wide-ranging heterogeneity in study design and measures used to assess the outcomes, it is diffi-cult to evaluate which format or elements reduce fa-tigue after cancer treatment. Furthermore, the optimum time to intervene after treatment has ended is not clear.
Background
Cancer-related fatigue (CrF) is commonly defined as ‘a distressing, persistent, subjective sense of physical, emo-tional and/or cognitive tiredness or exhaustion related to cancer and/or cancer treatment that is not proportional to recent activity, and significantly interferes with usual functioning’ [1]. There is little understanding of the underlying aetiology of CrF [2] but it is considered a multidimensional symptom that is comprised of phys-ical, mental, and emotional aspects [1,3,4].
There is limited evidence of the effectiveness of pharma-cological interventions for the management of CrF [5]. However, some reviews of non-pharmacological interven-tions have indicated that psychological and activity-based interventions may be effective [2,6]. Interventions that in-corporate restorative approaches, supportive-expressive techniques and cognitive-behavioural psychosocial inter-ventions may reduce levels of CrF [6,7]. In this review, we have focused on psychological therapies designed to im-prove functioning and/or reduce the physical and psycho-logical impact of CrF.
Psychological interventions such as cognitive-behavioural therapy (CBT) aim to influence or change cognitions, emo-tions, behaviours or a combination of these [8]. Interventions which target these processes may improve symptom man-agement in CrF [9]. These therapies may increase knowledge, improve emotional adjustment and enhance quality of life, and have also been associated with improved coping skills, physical health and functional adjustment [6, 10]. Patients and healthcare professionals have been reported to have high expectations of, and relatively positive attitudes towards, psy-chological therapies [10].
There is some evidence that psychosocial interventions are effective in reducing fatigue in patients undergoing active treatment for cancer [8]. While biological insults such as can-cer or cancan-cer treatment may lead to fatigue symptoms during the treatment phase of those with cancer, behavioural and cognitive variables may prolong fatigue during to post-treatment phase [1]. However, it is still unclear whether psy-chological interventions are helpful for managing fatigue in post-treatment cancer survivors beyond the early diagnostic and treatment phase [11]. Consequently, there is a need to conduct a critical review of the literature pertaining to
psychological interventions in post-treatment cancer survivorship.
Objectives
This review systematically reviews and synthesizes the evi-dence from randomised controlled trials (RCTs) investi-gating the effectiveness of psychological interventions for persistent fatigue in people after the completion of cancer treatment.
Methods
The review protocol was registered with the International Prospective Register of Systematic Reviews (PROSPERO) database (registration number: CRD42014015219) and the protocol has been published [12]. The review is reported in accordance with the Preferred Reporting Items for System-atic Reviews and Meta-Analyses (PRISMA) statement [13].
Criteria for considering studies for this review Types of studies
RCTs comparing psychological treatments with no inter-vention (i.e. usual care or wait list controls), attention controls or another intervention for CrF. Studies were included regardless of treatment intensity or duration, mode of treatment delivery (e.g. individual, group) or medium of treatment (e.g. in-person, online). We did not impose date restrictions. Studies found in the grey literature were included if a full-text paper in English was available, either through databases or through con-tact with the study authors.
Types of participants
Adults 18 years and older who had completed treatment for cancer regardless of gender, tumour type, and type of medical treatment received.
Types of interventions
Types of outcome measures
Studies were required to have‘fatigue’as an outcome of interest. In line with Goedendorp et al. [8], studies were included if fatigue was measured with a questionnaire designed specifically to evaluate fatigue. Fatigue sub-scales that were part of a broader quality-of-life measure were also included, if specific fatigue-related data were available. Fatigue could also be measured with a visual analogue scale (VAS) or as part of a symptom list and scored as‘present’or‘absent’. Fatigue could be measured in terms of characteristics such as intensity, distress, duration, frequency, or as dimensions such as physical fatigue, mental fatigue or general fatigue.
Secondary outcomes included
Functional impact of fatigue (self-report questionnaires measures assessing the impact of fatigue on daily functioning)
Fatigue self-efficacy (self-reported scales of control or self-efficacy in relation to fatigue)
Mood (self-reported scales of depression, and/or anxiety, or distress)
Global quality of life (self-report questionnaires measures assessing the impact of fatigue on quality of life).
Information sources
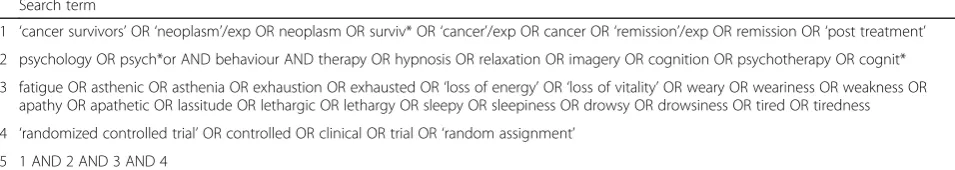
The following electronic databases were searched: Cochrane Central Register of Controlled Trials (CEN-TRAL), MEDLINE, EMBASE, CINAHL PsycINFO, Web of Science and CancerLit. Alterations were made to the search strategies as appropriate for each database. An example search strategy can be seen in Table 1 (See Additional file 3. For further details of the search strat-egies used). The original search was conducted on Octo-ber 6th and 7th 2015 and was updated on the 22nd and 23rd of January 2018. Studies from 2014 to 2018 were assessed for inclusion based on the criteria followed in the original search.
Unpublished and ongoing trials were identified by checking appropriate databases of current ongoing clinical research studies. Grey literature was searched using the
OpenGrey database (www.opengrey.eu), which includes technical or research reports or doctoral dissertations. Conference papers from annual American Society of Clin-ical Oncology (ASCO) or International Psycho Oncology Society World Congress (IPOS) conferences were also searched. Other published, unpublished and ongoing trials were identified by checking trials and protocols published on the following clinical trials registers and websites.
• World Health Organization International Clinical Trials Registry Platform (WHO ICTRP; www.who.int/ ictrp/en).
• metaRegister of Controlled Trials (mRCT; www. controlled-trials.com/mrct/).
•ClinicalTrials.gov (www.clinicaltrials.gov). •www.cancer.gov/clinicaltrials.
Search methods for identification of studies
Data collection and analysis
One review author (TC) conducted the initial search be-fore screening titles. Titles that were clearly not relevant to this review were removed. Three review authors (TC, EC and BMG) independently screened the remaining ti-tles and abstracts for their eligibility for inclusion. Ineli-gible studies were excluded at this stage, with each author recording the reason for rejection. Full-text cop-ies were retrieved and screened if the title and abstract did not provide sufficient information concerning the in-clusion criteria for this review. Copies of all studies that possibly or definitely met the inclusion criteria were also retrieved. Disagreements between the reviewers were re-solved by discussion, with the involvement of another reviewer where agreement could not be reached (DD). Multiple reports of the same study were included as a single study, with each study identified by the lead au-thor of the primary results paper.
Data extraction and management
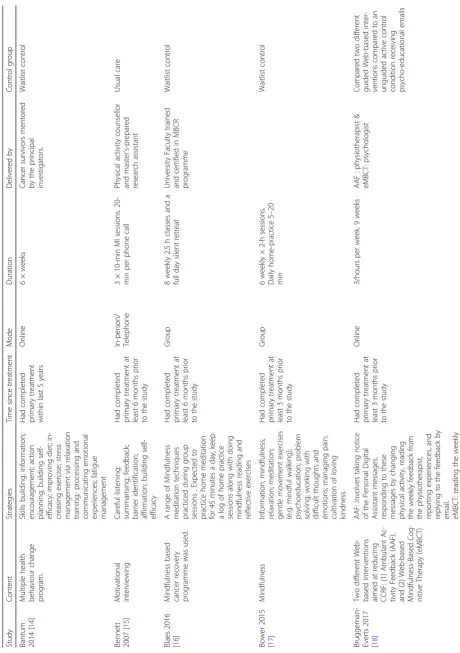
Review authors (TC, EC, AG and BMG) extracted data independently from the studies using a specifically de-signed data extraction form (see Table2). Authors were contacted where further clarity regarding the study was required, or in order to obtain additional data.
Table 1Sample search strategy: details of the terms searched in CINAHL database
Search term
1 ‘cancer survivors’OR‘neoplasm’/exp OR neoplasm OR surviv* OR‘cancer’/exp OR cancer OR‘remission’/exp OR remission OR‘post treatment’
2 psychology OR psych*or AND behaviour AND therapy OR hypnosis OR relaxation OR imagery OR cognition OR psychotherapy OR cognit*
3 fatigue OR asthenic OR asthenia OR exhaustion OR exhausted OR‘loss of energy’OR‘loss of vitality’OR weary OR weariness OR weakness OR apathy OR apathetic OR lassitude OR lethargic OR lethargy OR sleepy OR sleepiness OR drowsy OR drowsiness OR tired OR tiredness
4 ‘randomized controlled trial’OR controlled OR clinical OR trial OR‘random assignment’
Assessment of risk of bias in included studies
The risk of bias of each trial was assessed as high risk, low risk or unclear risk as per recommendations pro-vided in Chapter 8 of the Cochrane Hand book for Sys-tematic Reviews of Interventions [44]. Further details regarding the risk of bias domains was provided in the study protocol [12].
Quality of the evidence
The Grading of Recommendations Assessment, Devel-opment, and Evaluation (GRADE) process was used to assess the evidence for the primary comparison of ‘ Psy-chological Interventions compared to usual care for Fa-tigue in cancer survivors’.
Results
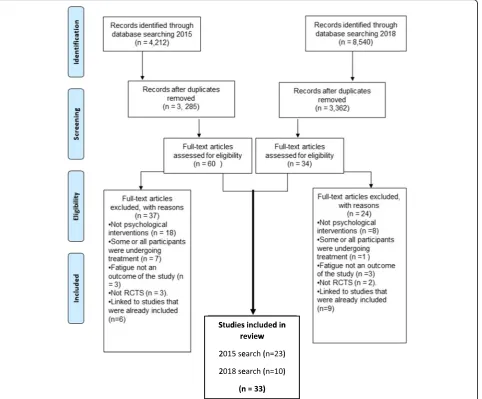
Figure1depicts the PRISMA flow diagram of studies identi-fied and excluded at each stage of the review. The initial
literature search of seven databases in 2015 resulted in 4212 potentially relevant articles. Following exclusion of duplicates, 3,285 articles remained. The titles and abstracts of these arti-cles were screened and 60 full-text artiarti-cles were selected to be retrieved and reviewed in detail. Following review of the full-text papers, a further 37 studies were excluded and 23 RCTs fulfilled all eligibility criteria for inclusion.
The updated search in 2018 resulted in 8540 poten-tially relevant articles. Once duplicates and studies prior to 2014 were removed, 3362 studies published were assessed for inclusion. Thirty-four full-text articles were reviewed, eight of which had already been included or were follow-up studies associated with papers included in the original review. Ten new papers were added to the review.
In total, 33 RCTs fulfilled all eligibility criteria for in-clusion. A full description of these studies can be seen in Tables2and3.
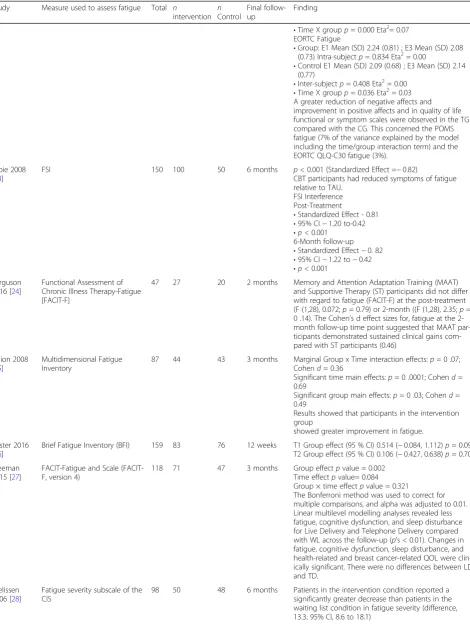
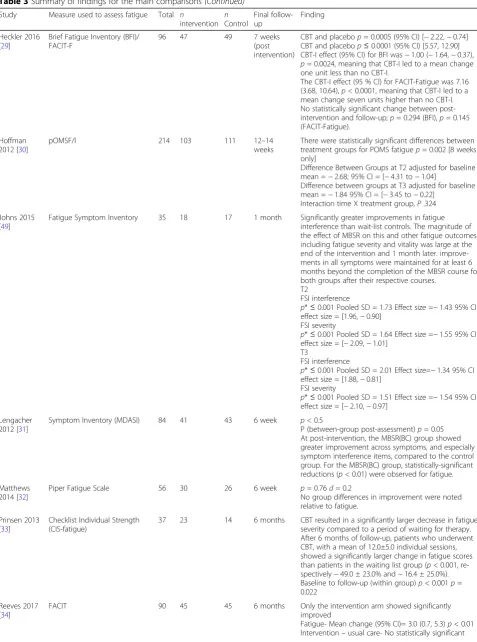
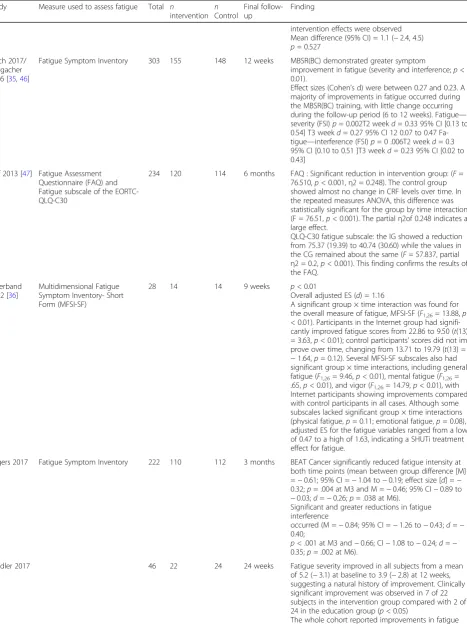
Table 3Summary of findings for the main comparisons
Study Measure used to assess fatigue Total n
intervention nControl
Final follow-up
Finding
Bantum 2014 [14]
Brief Fatigue Inventory (BFI) 303 156 147 6 months p= 0.56 Effect size = 0.17 (Calculated by taking the differences of the means at 6 months predicted from the model, including adjustment factors, divided by the standard deviation for the difference computed from the within and between subject variance components.) Control group,
•Baseline (n= 176); mean (95% CI) = 40.8 (38.9–42.8) •Month 6 (n= 156); mean (95% CI) = 40.7 (38.7–42.8) Intervention group
•Baseline (n= 176); mean (95% CI) = 39.0 (37.0–40.9) •Month 6 (n= 147); mean (95% CI) = 36.4 (34.2–38.5) Bennett 2007
[15]
Schwartz Cancer Fatigue Scale 56 28 28 6 months On average, the level of fatigue status for all participants was 15.20 at baseline and declined 4.22 points (27%) across the study.
Group × Time interaction for fatigue was significant [Λ =0.78,F(2,37) = 5.24,p= 0.010]. However, inspection of the graph showed this was an artifact of 3-month mea-sures, whereas values at baseline and at 6 months showed no significant differences between groups, leading to the conclusion that the significant effect of the interaction was the result of measurement error.
Blaes 2016 [16]
Functional Assessment in cancer Therapy-Fatigue ( FACT-F)
42 28 14 4 months There was an improvement in fatigue in both groups
with time. Mean improvement from baseline to 4 months was 6.8 for the MBCR group and 1.3 for controls (p= 0.19).
There was no statistically significant difference in improvement in fatigue for two groups.
Bower 2015 [17]
Fatigue Symptom Inventory 71 39 32 3 months Mindfulness led to significant improvements in fatigue (p= 0.007), from pre- to post-intervention.
No group differences in change from baseline to 3-month follow-upp= 0.57
Bruggeman-Everts 2017 [18]
Checklist Individual Strength -Fatigue Severity [CIS-FS] subscale
167 55 112 9 weeks AAF = eMBCT = psycho-educationχ2(4)=27.63,p< .001 AAF = psycho-educationχ2(2)=28.28,p< .001 eMBCT = psycho-educationχ2(2)=10.89,p= .004 AAF = eMBCTχ2(2)=2.19,p= .34
Multiple group latent growth curve analysis, corrected for individual time between assessments, showed that fatigue severity decreased significantly more in the AAF and eMBCT groups compared to the
psychoeducational group.
Carlson 2013 (2016) [19,
45]
POMS 271 113 158 6 and 12
months later.
Group-by-time effect at intervention (6months):p= 0.001
95% CI−0.45 [−0.70;−0.20]
Group-by-time effect at follow-up (12 months)p= 0.76
Dirksen 2008 [20]
Profile of Mood States Fatigue/ Inertia Subscale (POMSF/I)
72 34 38 2 weeks Statistically significant pre- to post-treatment change (p
< 0.05).
From pre- to post-treatment, the CBT-I group improved on fatigue. Statistically significant interaction effects were found for fatigue At post-treatment, a trend was noted towards lower fatigue [t(70) = 1·87,p= 0·07].
Dodds 2015 [21]
Medical Outcomes Study Short Form 12-Item HealthSurvey (SF-12)
28 16 12 4 weeks Improvement in fatigue/vitality From baseline to study
week 8 = 5.5, 95% CI [1.5; 9.6]; 1-month FU 0.3
95% CI [−4.2; 4.9] no significant differences at the 4-week follow-up.
Dolbeault 2009 [22]
POMSF/I and EORTC Fatigue 167 81 86 6 months Comparison of change scores between randomisation
arms (Group: n=81; Control: n=87) POMS fatigue
•Group: E1 Mean (SD) 10.01 (7.38) ; E3 Mean (SD) 6.86 (5.58) ; Intra-subjectp= -0.069 Eta2= 0.02
Table 3Summary of findings for the main comparisons(Continued)
Study Measure used to assess fatigue Total n
intervention nControl
Final follow-up
Finding
•Time X groupp= 0.000 Eta2= 0.07 EORTC Fatigue
•Group: E1 Mean (SD) 2.24 (0.81) ; E3 Mean (SD) 2.08 (0.73) Intra-subjectp= 0.834 Eta2= 0.00
•Control E1 Mean (SD) 2.09 (0.68) ; E3 Mean (SD) 2.14 (0.77)
•Inter-subjectp= 0.408 Eta2= 0.00 •Time X groupp= 0.036 Eta2= 0.03 A greater reduction of negative affects and improvement in positive affects and in quality of life functional or symptom scales were observed in the TG compared with the CG. This concerned the POMS fatigue (7% of the variance explained by the model including the time/group interaction term) and the EORTC QLQ-C30 fatigue (3%).
Espie 2008 [23]
FSI 150 100 50 6 months p< 0.001 (Standardized Effect =−0.82)
CBT participants had reduced symptoms of fatigue relative to TAU.
FSI Interference Post-Treatment
•Standardized Effect - 0.81 •95% CI−1.20 to-0.42 •p <0.001
6-Month follow-up •Standardized Effect−0. 82 •95% CI−1.22 to−0.42 •p <0.001
Ferguson 2016 [24]
Functional Assessment of Chronic Illness Therapy-Fatigue [FACIT-F]
47 27 20 2 months Memory and Attention Adaptation Training (MAAT)
and Supportive Therapy (ST) participants did not differ with regard to fatigue (FACIT-F) at the post-treatment (F (1,28), 0.072;p= 0.79) or 2-month ((F (1,28), 2.35;p= 0 .14). The Cohen’s d effect sizes for, fatigue at the 2-month follow-up time point suggested that MAAT par-ticipants demonstrated sustained clinical gains com-pared with ST participants (0.46)
Fillion 2008 [25]
Multidimensional Fatigue Inventory
87 44 43 3 months Marginal Group x Time interaction effects:p= 0 .07; Cohend= 0.36
Significant time main effects:p= 0 .0001; Cohend= 0.69
Significant group main effects:p= 0 .03; Cohend= 0.49
Results showed that participants in the intervention group
showed greater improvement in fatigue.
Foster 2016 [26]
Brief Fatigue Inventory (BFI) 159 83 76 12 weeks T1 Group effect (95 % CI) 0.514 (−0.084, 1.112)p= 0.09 T2 Group effect (95 % CI) 0.106 (−0.427, 0.638)p= 0.70
Freeman 2015 [27]
FACIT-Fatigue and Scale (FACIT-F, version 4)
118 71 47 3 months Group effectpvalue = 0.002
Time effectpvalue= 0.084 Group × time effectpvalue = 0.321
The Bonferroni method was used to correct for multiple comparisons, and alpha was adjusted to 0.01. Linear multilevel modelling analyses revealed less fatigue, cognitive dysfunction, and sleep disturbance for Live Delivery and Telephone Delivery compared with WL across the follow-up (p’s < 0.01). Changes in fatigue, cognitive dysfunction, sleep disturbance, and health-related and breast cancer-related QOL were clin-ically significant. There were no differences between LD and TD.
Gielissen 2006 [28]
Fatigue severity subscale of the CIS
98 50 48 6 months Patients in the intervention condition reported a
Table 3Summary of findings for the main comparisons(Continued)
Study Measure used to assess fatigue Total n
intervention nControl
Final follow-up
Finding
Heckler 2016 [29]
Brief Fatigue Inventory (BFI)/ FACIT-F
96 47 49 7 weeks
(post intervention)
CBT and placebop= 0.0005 (95% CI) [−2.22,−0.74] CBT and placebop≤0.0001 (95% CI) [5.57, 12.90] CBT-I effect (95% CI) for BFI was−1.00 (−1.64,−0.37),
p= 0.0024, meaning that CBT-I led to a mean change one unit less than no CBT-I.
The CBT-I effect (95 % CI) for FACIT-Fatigue was 7.16 (3.68, 10.64),p< 0.0001, meaning that CBT-I led to a mean change seven units higher than no CBT-I. No statistically significant change between post-intervention and follow-up;p= 0.294 (BFI),p= 0.145 (FACIT-Fatigue).
Hoffman 2012 [30]
pOMSF/I 214 103 111 12–14
weeks
There were statistically significant differences between treatment groups for POMS fatiguep= 0.002 [8 weeks only]
Difference Between Groups at T2 adjusted for baseline mean =−2.68; 95% CI = [−4.31 to−1.04]
Difference between groups at T3 adjusted for baseline mean =−1.84 95% CI = [−3.45 to−0.22]
Interaction time X treatment group,P.324
Johns 2015 [49]
Fatigue Symptom Inventory 35 18 17 1 month Significantly greater improvements in fatigue
interference than wait-list controls. The magnitude of the effect of MBSR on this and other fatigue outcomes including fatigue severity and vitality was large at the end of the intervention and 1 month later. improve-ments in all symptoms were maintained for at least 6 months beyond the completion of the MBSR course for both groups after their respective courses.
T2
FSI interference
p*≤0.001 Pooled SD = 1.73 Effect size =−1.43 95% CI effect size = [1.96,−0.90]
FSI severity
p*≤0.001 Pooled SD = 1.64 Effect size =−1.55 95% CI effect size = [−2.09,−1.01]
T3
FSI interference
p*≤0.001 Pooled SD = 2.01 Effect size=−1.34 95% CI effect size = [1.88,−0.81]
FSI severity
p*≤0.001 Pooled SD = 1.51 Effect size =−1.54 95% CI effect size = [−2.10,−0.97]
Lengacher 2012 [31]
Symptom Inventory (MDASI) 84 41 43 6 week p< 0.5
P (between-group post-assessment)p= 0.05 At post-intervention, the MBSR(BC) group showed greater improvement across symptoms, and especially symptom interference items, compared to the control group. For the MBSR(BC) group, statistically-significant reductions (p< 0.01) were observed for fatigue.
Matthews 2014 [32]
Piper Fatigue Scale 56 30 26 6 week p= 0.76d= 0.2
No group differences in improvement were noted relative to fatigue.
Prinsen 2013 [33]
Checklist Individual Strength (CIS-fatigue)
37 23 14 6 months CBT resulted in a significantly larger decrease in fatigue severity compared to a period of waiting for therapy. After 6 months of follow-up, patients who underwent CBT, with a mean of 12.0±5.0 individual sessions, showed a significantly larger change in fatigue scores than patients in the waiting list group (p< 0.001, re-spectively−49.0 ± 23.0% and−16.4 ± 25.0%). Baseline to follow-up (within group)p< 0.001p= 0.022
Reeves 2017 [34]
FACIT 90 45 45 6 months Only the intervention arm showed significantly
improved
Table 3Summary of findings for the main comparisons(Continued)
Study Measure used to assess fatigue Total n
intervention nControl
Final follow-up
Finding
intervention effects were observed Mean difference (95% CI) = 1.1 (−2.4, 4.5)
p= 0.527 Reich 2017/
Lengacher 2016 [35,46]
Fatigue Symptom Inventory 303 155 148 12 weeks MBSR(BC) demonstrated greater symptom
improvement in fatigue (severity and interference;p< 0.01).
Effect sizes (Cohen’s d) were between 0.27 and 0.23. A majority of improvements in fatigue occurred during the MBSR(BC) training, with little change occurring during the follow-up period (6 to 12 weeks). Fatigue— severity (FSI)p= 0.002T2 weekd= 0.33 95% CI [0.13 to 0.54] T3 weekd= 0.27 95% CI 12 0.07 to 0.47 Fa-tigue—interference (FSI)p= 0 .006T2 weekd= 0.3 95% CI [0.10 to 0.51 ]T3 weekd= 0.23 95% CI [0.02 to 0.43]
Reif 2013 [47] Fatigue Assessment Questionnaire (FAQ) and Fatigue subscale of the EORTC-QLQ-C30
234 120 114 6 months FAQ : Significant reduction in intervention group: (F= 76.510,p< 0.001,η2 = 0.248). The control group showed almost no change in CRF levels over time. In the repeated measures ANOVA, this difference was statistically significant for the group by time interaction (F = 76.51,p< 0.001). The partialη2of 0.248 indicates a large effect.
QLQ-C30 fatigue subscale: the IG showed a reduction from 75.37 (19.39) to 40.74 (30.60) while the values in the CG remained about the same (F= 57.837, partial
η2 = 0.2,p< 0.001). This finding confirms the results of the FAQ.
Ritterband 2012 [36]
Multidimensional Fatigue Symptom Inventory- Short Form (MFSI-SF)
28 14 14 9 weeks p< 0.01
Overall adjusted ES (d) = 1.16
A significant group × time interaction was found for the overall measure of fatigue, MFSI-SF (F1,26= 13.88,p < 0.01). Participants in the Internet group had signifi-cantly improved fatigue scores from 22.86 to 9.50 (t(13) = 3.63,p< 0.01); control participants’scores did not im-prove over time, changing from 13.71 to 19.79 (t(13) =
−1.64,p= 0.12). Several MFSI-SF subscales also had significant group × time interactions, including general fatigue (F1,26= 9.46,p< 0.01), mental fatigue (F1,26= .65,p< 0.01), and vigor (F1,26= 14.79,p< 0.01), with Internet participants showing improvements compared with control participants in all cases. Although some subscales lacked significant group × time interactions (physical fatigue,p= 0.11; emotional fatigue,p= 0.08), adjusted ES for the fatigue variables ranged from a low of 0.47 to a high of 1.63, indicating a SHUTi treatment effect for fatigue.
Rogers 2017 [37]
Fatigue Symptom Inventory 222 110 112 3 months BEAT Cancer significantly reduced fatigue intensity at both time points (mean between group difference [M] =−0.61; 95% CI =−1.04 to−0.19; effect size [d] =− 0.32;p= .004 at M3 and M =−0.46; 95% CI−0.89 to
−0.03;d=−0.26;p= .038 at M6). Significant and greater reductions in fatigue interference
occurred (M =−0.84; 95% CI =−1.26 to−0.43;d=− 0.40;
p< .001 at M3 and−0.66; CI−1.08 to−0.24;d=− 0.35;p= .002 at M6).
Sandler 2017 [38]
46 22 24 24 weeks Fatigue severity improved in all subjects from a mean
of 5.2 (−3.1) at baseline to 3.9 (−2.8) at 12 weeks, suggesting a natural history of improvement. Clinically significant improvement was observed in 7 of 22 subjects in the intervention group compared with 2 of 24 in the education group (p< 0.05)
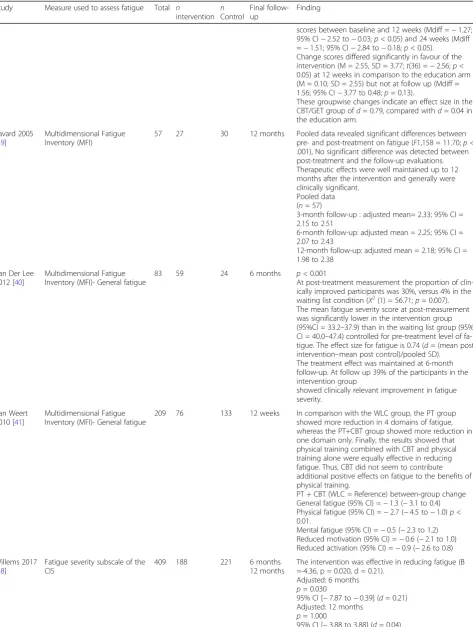
Table 3Summary of findings for the main comparisons(Continued)
Study Measure used to assess fatigue Total n
intervention nControl
Final follow-up
Finding
scores between baseline and 12 weeks (Mdiff =−1.27; 95% CI−2.52 to−0.03;p< 0.05) and 24 weeks (Mdiff =−1.51; 95% CI−2.84 to−0.18;p< 0.05).
Change scores differed significantly in favour of the intervention (M = 2.55, SD = 3.77;t(36) =−2.56;p< 0.05) at 12 weeks in comparison to the education arm (M = 0.10; SD = 2.55) but not at follow up (Mdiff = 1.56; 95% CI−3.77 to 0.48;p= 0.13).
These groupwise changes indicate an effect size in the CBT/GET group ofd= 0.79, compared withd= 0.04 in the education arm.
Savard 2005 [39]
Multidimensional Fatigue Inventory (MFI)
57 27 30 12 months Pooled data revealed significant differences between pre- and post-treatment on fatigue (F1,158 = 11.70;p< .001), No significant difference was detected between post-treatment and the follow-up evaluations. Therapeutic effects were well maintained up to 12 months after the intervention and generally were clinically significant.
Pooled data (n= 57)
3-month follow-up : adjusted mean= 2.33; 95% CI = 2.15 to 2.51
6-month follow-up: adjusted mean = 2.25; 95% CI = 2.07 to 2.43
12-month follow-up: adjusted mean = 2.18; 95% CI = 1.98 to 2.38
Van Der Lee 2012 [40]
Multidimensional Fatigue Inventory (MFI)- General fatigue
83 59 24 6 months p< 0.001
At post-treatment measurement the proportion of clin-ically improved participants was 30%, versus 4% in the waiting list condition (Χ2(1) = 56.71;p= 0.007). The mean fatigue severity score at post-measurement was significantly lower in the intervention group (95%CI = 33.2–37.9) than in the waiting list group (95% CI = 40.0–47.4) controlled for pre-treatment level of fa-tigue. The effect size for fatigue is 0.74 (d= (mean post intervention–mean post control)/pooled SD).
The treatment effect was maintained at 6-month follow-up. At follow up 39% of the participants in the intervention group
showed clinically relevant improvement in fatigue severity.
Van Weert 2010 [41]
Multidimensional Fatigue Inventory (MFI)- General fatigue
209 76 133 12 weeks In comparison with the WLC group, the PT group
showed more reduction in 4 domains of fatigue, whereas the PT+CBT group showed more reduction in one domain only. Finally, the results showed that physical training combined with CBT and physical training alone were equally effective in reducing fatigue. Thus, CBT did not seem to contribute additional positive effects on fatigue to the benefits of physical training.
PT + CBT (WLC = Reference) between-group change General fatigue (95% CI) =−1.3 (−3.1 to 0.4) Physical fatigue (95% CI) =−2.7 (−4.5 to−1.0)p< 0.01.
Mental fatigue (95% CI) =−0.5 (−2.3 to 1.2) Reduced motivation (95% CI) =−0.6 (−2.1 to 1.0) Reduced activation (95% CI) =−0.9 (−2.6 to 0.8)
Willems 2017 [48]
Fatigue severity subscale of the CIS
409 188 221 6 months
12 months
The intervention was effective in reducing fatigue (B =-4.36, p = 0.020, d = 0.21).
Adjusted: 6 months
p= 0.030
95% CI [−7.87 to−0.39] (d= 0.21) Adjusted: 12 months
p= 1.000
In cases where more than one paper was published re-lating to the same study, the papers were assigned to one study. Five articles were found in the grey literature and full-texts were not available online. Study authors of each of these papers were contacted. Three study au-thors provided full-texts in preparation for publication. The other two papers were excluded at this point, as full-texts were not available. No articles were found in snowball search.
Description of included studies
Data were extracted from the included papers (see Table 2. for a description of the included studies). The 33 RCTs reported data on 4486 cancer survivors (2196 intervention and 2290 controls). The majority of studies were conducted in the USA [14–17, 20, 21, 24, 27, 29, 31, 32, 35–37, 49, 50]. Six were carried out in the Netherlands [18,28,33,40,41,48], three in the UK [23, 26,30]. The remainder were conducted in Australia, [34, 38] Canada [39, 45], Germany [47], France [22, 25] and Korea [42,43].
Participants
As per the inclusion criteria for this review, studies were required to include only those who have completed ac-tive medical treatment prior to taking part in the re-search. However, there was little consistency across the studies regarding the timing of the intervention in rela-tion to time elapsed since complerela-tion of cancer treatment.
Interventions
Details of interventions can be seen in Table2, including content, strategies employed, mode of delivery, duration, who delivered the intervention and the comparison or control group used. Twelve studies reported on the ef-fects of a CBT intervention [20, 23, 24, 28, 29, 32, 33, 36,38,39,41, 43], of which six were focused specifically on CBT for insomnia (CBT-i) [20, 23, 29, 32, 36, 39]. Over half of these (n= 5) were studies on CBT-I [20,23, 29, 36, 39]. Two of the CBT interventions were com-bined with physical activity [38,41]. Other studies incor-porated CBT strategies into the intervention. Dolbeault et al. [22] reported on a psycho-educational intervention based on CBT and another study reported on a trial of Cognitively-Based Compassion Training [21]. Van der Lee et al. used a combination of CBT and mindfulness strategies in a trial on mindfulness-based cognitive ther-apy [40].
Seven studies [16, 17, 19, 30, 31, 35, 49] reported on mindfulness-based interventions. Two of the studies were specifically aimed at CrF [30, 49], and three were focused on cancer [16,19,35].
Bruggeman-Everts [18] compared ambulant activity feedback (AAF) and psychologist-guided web-based mindfulness-based cognitive therapy groups to a psy-choeducational group, showing that the psycho-education group was least effective at reducing fatigue. Other interventions included a patient education pro-gram [47], a physical activity behaviour change interven-tion [37] and a combined psycho-education and physical
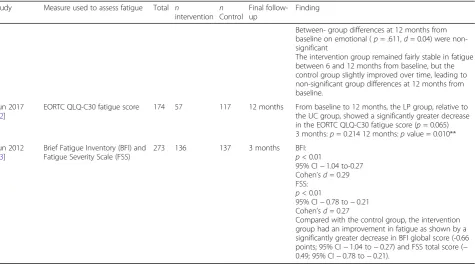
Table 3Summary of findings for the main comparisons(Continued)
Study Measure used to assess fatigue Total n
intervention nControl
Final follow-up
Finding
Between- group differences at 12 months from baseline on emotional (p= .611,d= 0.04) were non-significant
The intervention group remained fairly stable in fatigue between 6 and 12 months from baseline, but the control group slightly improved over time, leading to non-significant group differences at 12 months from baseline.
Yun 2017 [42]
EORTC QLQ-C30 fatigue score 174 57 117 12 months From baseline to 12 months, the LP group, relative to the UC group, showed a significantly greater decrease in the EORTC QLQ-C30 fatigue score (p= 0.065) 3 months:p= 0.214 12 months:pvalue = 0.010**
Yun 2012 [43]
Brief Fatigue Inventory (BFI) and Fatigue Severity Scale (FSS)
273 136 137 3 months BFI:
p< 0.01
95% CI−1.04 to-0.27 Cohen’sd= 0.29 FSS:
p< 0.01
95% CI−0.78 to−0.21 Cohen’sd= 0.27
activity intervention [25]. Health coaching and motiv-ational interviewing was employed in two studies [15, 42]. Freeman et al. tested an imagery-based intervention [27]. Three studies reported on lifestyle interventions [14, 34, 51] and one online intervention aimed to en-hance self-efficacy to manage problems associated with cancer-related fatigue following primary cancer treat-ment [26].
Control group
There was substantial heterogeneity in the comparison groups used within the trials. See Table2for further details
Outcomes Primary outcomes
A variety of different measures were used to assess fa-tigue. The Brief Fatigue Inventory (BFI) was used in five studies [14, 17, 26, 29, 43] and the Functional Assess-ment in Cancer Therapy-Fatigue (FACIT-F) was used in five studies [16,24,27,29,34]. Five studies used the Fa-tigue Symptom Inventory (FSI) [17, 23, 35, 37, 49] and the Multidimensional Fatigue Inventory (MFI) was used in four studies [25, 39–41]. Ritterband [36] used the short form of the Multidimensional Fatigue Symptom Inventory-Short Form(MFSI-SF). The Schwartz Cancer Fatigue Scale was used in one study [15]. Four studies [18, 28, 33, 48] employed the Checklist Individual Strength (CIS). The remaining studies used fatigue sub-scales of broader multi-dimensional measures. Three studies assessed fatigue using two different question-naires. Yun et al. [43] used both the BFI and the Fatigue Severity Scale (FSS), whereas another study used the BFI in conjunction with the FACIT-F [29]. The third study used both the Fatigue Assessment Questionnaire (FAQ) and fatigue subscale of the EORTC-QLQ-C30 [47].
Secondary outcomes
Secondary outcomes of interest to this review were specified a priori in the study protocol [12] and are summarised in Additional file1. These included mood (self-reported scales of depression, and/or anxiety or distress); global quality of life and functional impact of fatigue (self-report questionnaire measures assessing the impact of fatigue on quality of life and daily functioning); and fatigue self-efficacy. Most of the studies included a measure of mood, either as an outcome or a control variable. However, the mood outcomes were assessed by a wide range of psychometric tools which assessed various dimensions of mood including stress, de-pression, anxiety and distress. Many of the studies also in-cluded a measure of global quality of life (QoL) and functional impact of fatigue. Only two of the studies assessed self-efficacy in relation to coping with fatigue [25,26].
In the review process, other frequently reported sec-ondary outcomes that were not outlined in the review
protocol were identified as relevant to this review. These outcomes of interest were insomnia or sleep quality and pain. Studies that assessed sleep quality or insomnia tended to be designed with the aim of impacting insom-nia or quality of life after cancer treatment.
As with the measures used to assess fatigue, a variety of measures were used to assess mood-related variables, with some studies including more than one measure of mood. The most commonly used measures were the Hospital Anx-iety and Depression Scale (HADS) [52], The Patient Health Questionnaire (PHQ) [53] (a measure of depression severity) and The Profile of Mood States (POMS) [54] (a measure of psychological distress). The State-Trait Anxiety Inventory (STAI) [55] was also used.
The two most commonly used scales to assess quality of life were the European Organisation for the Research and Treatment of Cancer Quality of Life Questionnaire Core 30 (EORTC QLQ-C30) [56] and the Functional Assessment of Cancer Therapy-General (FACT-G) [57]. In the study protocol, the reviewers aimed to delineate the concepts of‘global quality of life’and‘functional im-pact of fatigue’[12]. However, in line with Luckett et al. [58], this was not deemed appropriate in the final review. Both types of measures assess physical, emotional, social, and functional/role scales. The QLQ-C30 provides brief scales for cognitive functioning, financial impact and a range of symptoms either not assessed by the FACT-G or else subsumed within its well-being scales. The FACT-G includes both symptoms and concerns within each scale [58]. The Medical Outcomes Study (MOS) [59], Sickness Impact Profile (SIP) [60], the SF-12 [61] and the M.D. Anderson Symptom Inventory (MDSAI) [62] were also used.
A variety of outcome measures were also used to as-sess sleep quality or insomnia. The Insomnia Severity Index (ISI) [63] was the most commonly used. Other measures included the Women’s Health Initiative In-somnia Rating Scale (WHIIRS) [64] and the Pittsburgh Sleep Quality Index (PSQI) [65]. Broader QoL measures that assessed insomnia/sleep quality included the MDSAI [62] and the EORTC QLQ-C30 [56].
Risk of bias assessment
The included studies were assessed for risk of bias using the Cochrane ‘Risk of Bias’ Tool [44]. Some aspects of the studies were not reported with sufficient detail to as-sess bias and therefore were rated as unclear risk of bias for domains where insufficient information was pro-vided. Further details are presented in Additional file2.
Random sequence generation (selection bias)
studies did not describe random sequence generation in enough detail to allow a definite judgement.
In the majority of studies (n= 24), the method of allo-cation concealment either was not described or not de-scribed in sufficient detail to allow a definite judgement.
Blinding (performance bias and detection bias)
Most of the trials included in this review were at high risk of performance bias because, owing to the nature of the intervention, it was not possible to blind the trial personnel and participants. In a number of the studies were not described in sufficient detail to allow a definite judgement as to whether or not outcome assessors were blinded about the group allocation of participants.
Incomplete outcome data (attrition bias)
All studies provided some details of study attrition. Many of the studies (n= 19) were at a low risk of attri-tion bias, with good compleattri-tion rates.
Selective reporting (reporting bias)
The majority of studies were at a low risk of reporting bias as, based on the information provided by the trial authors and study protocols (where available), it was un-likely that there was selective reporting of the primary and secondary outcomes. Sixteen of the trials were pro-vided trial registration details.
Other bias
Most trials were deemed to be at a low risk for other biases such as potential bias due to baseline differences, inappropriate influence of the study sponsor and early stopping for benefit [12].
Quality of the evidence
We employed the GRADE approach to assess the evi-dence for the primary comparison of ‘Psychological In-terventions compared to usual care for Fatigue in cancer survivors’. As seen in Table 4, the majority of the evi-dence relating to psychological interventions for fatigue is of low quality, largely due to the finding that the avail-able evidence is too heterogeneous to pool across stud-ies. Further, it due to incomplete reporting of methods, it was difficult to ascertain risk of bias in studies. There is little evidence that directly answers the questions of interest for different types of psychological therapies.
Effects of interventions
In the published protocol, we had planned to conduct a meta-analysis, if it was deemed clinically meaningful and appropriate to do so [12]. However, given the heterogen-eity in participant groups, study design, study compara-tors and measures used, we synthesised data narratively, as a meta-analysis would have been inappropriate.
Comparison 1: psychological interventions (all types) vs. usual care
Primary outcome: fatigue Eleven psychological inter-ventions reported a significant effect of the interven-tion on an outcome of fatigue, compared to a waitlist control or usual care [17, 23, 28, 31, 33, 35, 36, 39, 42, 47, 49].
Secondary outcomes
1. Global quality of life (QoL)/functional impact of fatigue
Global QoL/functional impact of fatigue was assessed in 19 of the 22 studies that compared a psychological intervention to a waitlist control or usual care. Thirteen of these 19 studies
demonstrated a significant improvement compared to the control group, in at least one measure of QoL/functional impact of fatigue [22,23,25,28,30,
31,33,39,40,43,47–49]. One study reported that participants assigned to the intervention group had significantly lower physical well-being compared to the control group at follow-up [21]. The remaining studies did not report any Group X Time inter-action effects [15,26,34–36].
2. Fatigue self-efficacy
Two studies assessed fatigue self-efficacy. Bower et al. [17] used the fatigue subscale of the HIV self-efficacy questionnaire and reported that Interven-tion group participants were significantly more confident than control group participants about their ability to manage fatigue and its impact on their lives at follow-up [17]. Foster et al. assessed fa-tigue using the Perceived Self-efficacy for Fafa-tigue Self-management (PSEFSM). Initial evidence of im-proved fatigue self-efficacy at T1 in the intervention group was not maintained at final follow-up [26]. 3. Mood
Mood was assessed over time in 18 of the 22 studies that compared a psychological intervention to a waitlist control or usual care. Ten of these reported significant improvements compared to the control group, in at least one measure of mood over time [21–23,31,35,39,43,47,49].
4. Sleep/insomnia
Sleep/ insomnia was assessed over time in 12 of the 22 studies that compared a psychological
intervention to a waitlist control or usual care. Nine of these reported significant improvements
insomnia or sleep disturbance—all were effective for reducing fatigue [23,36,39].
Subgroup analysis and investigation of heterogeneity In the original protocol, we specified that we would explore effects by subgroups of specific psychological intervention type (e.g. cognitive behavioural therapy) vs usual care.
Comparison 2: subgroups of specific psychological intervention type (e.g. cognitive behavioural therapy) vs. usual care
Cognitive-behavioural therapy vs. usual care Five studies reported on the effects of a CBT intervention compared to waitlist control or usual care [23, 28, 33, 36,39], of which three were focused specifically on CBT for insomnia (CBT-i) [23,36,39].
Table 4Grade evidence summary
Outcomes №of
participants (studies)
Certainty of the evidence
Explanations
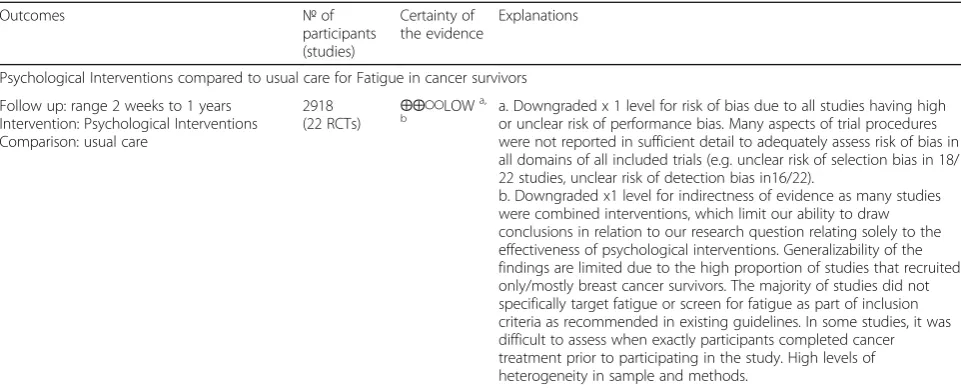
Psychological Interventions compared to usual care for Fatigue in cancer survivors
Follow up: range 2 weeks to 1 years Intervention: Psychological Interventions Comparison: usual care
2918
(22 RCTs) ⨁⨁◯◯
LOWa,
b a. Downgraded x 1 level for risk of bias due to all studies having highor unclear risk of performance bias. Many aspects of trial procedures
were not reported in sufficient detail to adequately assess risk of bias in all domains of all included trials (e.g. unclear risk of selection bias in 18/ 22 studies, unclear risk of detection bias in16/22).
b. Downgraded x1 level for indirectness of evidence as many studies were combined interventions, which limit our ability to draw conclusions in relation to our research question relating solely to the effectiveness of psychological interventions. Generalizability of the findings are limited due to the high proportion of studies that recruited only/mostly breast cancer survivors. The majority of studies did not specifically target fatigue or screen for fatigue as part of inclusion criteria as recommended in existing guidelines. In some studies, it was difficult to assess when exactly participants completed cancer treatment prior to participating in the study. High levels of heterogeneity in sample and methods.
Subgroups of specific psychological intervention type (e.g. cognitive behavioural therapy) vs usual care
CBT interventions compared to usual care for Fatigue in cancer survivors
Follow up: range 1 months to 1 years
648(8 RCTs) ⨁⨁◯◯LOWa,
b a. Downgraded x 1 level for risk of bias due to high/ unclear risk due to incomplete outcome data (attrition bias) in 5 of 8 studies Many aspects of trial procedures were not reported in sufficient detail to adequately assess risk of bias.
b. Downgraded x1 level for indirectness of evidence as high levels of heterogeneity in sample and methods that limit the generalizability of the findings- While CBT was incorporated in all interventions to some degree, it was delivered in a variety of settings, modes and assessed in different ways. For example, 3 x studies were not CBT interventions but were based on CBT strategies and 3x studies were focused specifically on CBT for insomnia.
Mindfulness-based interventions compared to usual care for Fatigue in cancer survivors Follow up: range 1 months to 4 months
749(6 RCTs) ⨁⨁◯◯LOWa,
b a. Downgraded x 1 level for risk of bias due to high or unclear risk of performance bias in all studies. Many aspects of trial procedures were not reported in sufficient detail to adequately assess risk of bias. b. Downgraded x1 level for indirectness of evidence as high levels of heterogeneity in sample and methods that limit the generalizability of the findings- While mindfulness was incorporated in all interventions to some degree, it was delivered in a variety of settings, modes and assessed in different ways.
Other psycho-social interventions compared to usual care for Fatigue in cancer survivors Follow up: range 3 months to 12 months
1521(8 RCTs) ⨁⨁◯◯LOWa,
b a. Downgraded x 1 level for risk of bias due to high or unclear risk ofperformance bias in all studies Some aspects of trial procedures were
not reported in sufficient detail to adequately assess risk of bias b. Downgraded x1 level for indirectness of evidence as high levels of heterogeneity - While all were psychological interventions, they were vastly different in sample and methods. Further, 4 x studies were lifestyle interventions that incorporated other interventions such as physical activity and dietary changes.
GRADE Working Group grades of evidence
High certainty: We are very confident that the true effect lies close to that of the estimate of the effect
Moderate certainty: We are moderately confident in the effect estimate: The true effect is likely to be close to the estimate of the effect, but there is a possibility that it is substantially different
Low certainty: Our confidence in the effect estimate is limited: The true effect may be substantially different from the estimate of the effect
Primary outcome: fatigue Each of the five CBT studies reported significant effect of the intervention on fatigue over time [23, 28, 33, 36, 39]. Two other studies incor-porated CBT strategies into the intervention. Dolbeault et al. [22] reported a significant effect on fatigue of a psycho-educational intervention based on CBT. Another study reported no significant differences between groups on a trial of Cognitively-Based Compassion Training [21]. Van der Lee et al. reported a significant effect of intervention over time using a combination of CBT and mindfulness strategies in a trial on mindfulness-based cognitive therapy [40].
Secondary outcomes
1. Global quality of life/functional impact of fatigue Four of the five CBT studies reported significant effect of the intervention over time at least one measure of Global QoL/functional impact of fatigue [23,28,33,36,39]. Savard et al. reported a
significant group-time interaction global quality of life using the EORTC QLQ-C30 [39]. Using the Functional Assessment of Cancer Therapy Scale-general (FACT-G), Espie et al. [23] reported that CBT was associated with increased physical and functional QoL compared to the control group, at post-treatment and at follow-up. Using the SIP-8, both Prinsen et al. [33] Gielissen et al. [28] stated that the intervention condition reported a signifi-cantly greater decrease than patients in the waiting list condition in functional impairment. Ritterband et al. [36] reported that the group x time interaction for either the physical or mental subscale of the SF-12 was not significant.
Using the EORTC core quality of life questionnaire (EORTC QLQ-C30), Dolbeault et al. reported greater improvement in emotional functioning, role functioning and global health status scales in the CBT-based psycho-educational intervention group compared with the control group. Group × time interaction effects were non-significant for the other subscales of the EORTC [22]. Using the SIP-8, van der Lee et al. reported that 6 months after the inter-vention, the mean well-being score at post measure-ment was significantly higher in the mindfulness-based cognitive therapy intervention group than in the waiting list group corrected for pre-treatment level of well-being [40]. Conversely, participants assigned to cognitively-based compassion trainingh had significantly lower physical well-being com-pared to the control group at follow-up [21]. 2. Fatigue self-efficacy
None of the five CBT studies assessed fatigue self-efficacy.
3. Mood
Mood was assessed over time in four of the five studies that compared a CBT intervention to a waitlist control or usual care [23,28,36,39]—three
of these reported a significant effect of the intervention on mood [23,28,39]. Gielissen et al. [28] assessed psychological distress using the Symptom Check List 90 and found that participants in the intervention condition reported a
significantly greater decrease in psychological distress (95% CI, 12.7 to 30.4,p< 0.001) than patients in the waiting list condition. Using the Hospitals Anxiety and Depression Scale [HADS], Espie et al. [23] reported that CBT participants had reduced symptoms of anxiety, and depression relative to the control group (anxiety 95% CI−0.92 to−0.12,p= 0.011; depression 95% CI−0.99 to− 0.19,p= 0.004). Also using the HADS, Savard et al. [39] reported significant group-time interactions on scores of anxiety (p< .05) and depression (p< .05). In contrast, Ritterband et al. [36] reported that the group × time interaction was not significant (p= .09) on the total HADS score.
Dolbeault et al. [22] reported that a greater reduction of negative affect and improvement in positive affect was demonstrated in the intervention group compared with the control group. Significant group × time interactions indicated a positive effect of the intervention on anxiety, measured using the State-Trait Anxiety Inventory. Psy-chological adjustment—assessed with the Profile of Mood States (POMS)—demonstrated group × time in-teractions in favour of the intervention on anxiety, anger and depression. No effect of the intervention group was evidenced on The Mental Adjustment to Cancer Scale (MAC).
Dodds et al. [21] reported that compared to controls, at follow-up, participants assigned to the CBCT group demonstrated had significantly lower levels of perceived stress in the past week (−1.6, 95 % CI−3.1,−0.2)—assessed using the Perceived Stress Scale (PSS-4). The Cognitive and Affective Mindfulness Scale-Revised (CAMS-R 10) demon-strated enhanced mindful presence in participants assigned to the CBCT group compared to controls, at follow-up (3.1, 95 % CI 0.4, 5.8). There was no significant impact of the intervention on the other mood scales at final follow-up (week 12): Brief Cen-ter for Epidemiologic Studies—Depression question-naire (CES-D-10), Fear of Cancer Recurrence Inventory (FCRI), the Impact of Events Scale— Re-vised (IES-R) or UCLA Loneliness Scale Version 3 (R-UCLA).
4. Sleep/insomnia
to a waitlist control or usual car e[22,23,36,39]—
three of these reported significant improvement compared to the control group, in at least one measure of sleep quality or insomnia symptoms over tim e[23,36,39].
Using the Insomnia Interview Schedule Insomnia Severity Index, Savard et al. [39] reported significant group-time interactions for all self-reported sleep var-iables, except for total sleep time. These included sleep efficiency, total wake time, sleep onset latency, wake after sleep onset.
Ritterband et al. [36] also employed the Insomnia Severity Index and reported a significant group × time interaction effect with the intervention group showing a significant improvement in insomnia severity from pre-to post-assessment, compared pre-to the control group. These improvements were also clinically significant. Sleep Diary Variables were also used to assess sleep effi-ciency, sleep onset latency, wake after sleep onset and total sleep time. A significant group × time interaction was found for sleep efficiency and sleep onset latency with medium-to-large treatment effects (d= .72 andd
= .67 respectively). There was not a significant group x time interaction for wake after sleep onset, time in bed, number of awakenings or total sleep time. The interven-tion group also showed significantly more improve-ments than those in the control group on soundness of sleep and feeling restored, with large effect sizes (1.21 and 1.35, respectively).
Espie et al. [23] also used sleep diaries to assess difficulty initiating (SOL) and maintaining (WASO) sleep. Changes in total sleep time were not statistically significant, but improvements were seen in the CBT group WASO, SOL and Sleep efficiency scores. CBT was associated with median reduction in insomnia symptoms of almost 1 h (SOL + WASO) compared with no change in the control group.
Dolbeault et al. [22] reported that no effect of the intervention group was evident over time, assessed using the EORTC QLQ-C30 sleep.
Mindfulness-based interventions
Six studies compared mindfulness-based interventions to waitlist control or usual care [16, 17, 30, 31, 35, 49]. Two of the studies were specifically aimed at CrF [30, 49] and another two were specifically focused on cancer [16,35].
Primary outcome: fatigue Four of the studies on mindfulness-based interventions reported a significant effect of intervention on fatigue over time [17, 31, 35, 49]. One of the effective studies one was specifically aimed at CrF [49] and one was specifically focused on
cancer [35]. The effective findings were not maintained at final follow up in one of the studies [17].
Secondary outcomes
1. Global quality of life/functional impact of fatigue Four of the mindfulness assessed Global QoL/ functional impact of fatigue [30,31,35,49]. Three reported significant effect of the intervention over time on at least one measure of Global QoL /functional impact of fatigue [30,31,49]. Hoffman et al. [30] employed the breast-specific quality of-life scale FACT-B and the FACT-ES scale for endo-crine symptoms and reported that mean scores in the intervention group were greater at both 8 and 12 weeks compared with the control group for all six measures (except social well-being which was significant at 8 weeks only). Using the WHO five-item well-being questionnaire (WHO-5), Hoffman et al. also reported significant increases in the inter-vention group compared with controls at both timepoints [30]. The authors also noted that in-creased hours of formal mindfulness classroom and home practice in the intervention group was associ-ated with improved scores in FACT-ES, FACT-B, FACT physical well-being and WHO-5 at 12 weeks. Johns et al. assessed functional status using the Sheehan Disability Scale (SDS) and reported that the MBSR group demonstrated significantly lower functional disability scores than the control group at final follow-up with a large effect size (d=− 1.22) [49]. Lengacher et al. used the M.D. Anderson Symptom Inventory (MDASI) [31]. They reported significant improvements in favour of MBSR(BC) in the symptom interference items (i.e., general activ-ity, work (including work around the house) rela-tions with other people, walking) and Housework, and Relationships. Using theMedical Outcomes Study Short-Form 36 (SF-36, v.2),Reich et al. [35] reported that group × time interaction was not sig-nificant for either mental or physical health. 2. Fatigue self-efficacy
Bower et al. used the fatigue subscale of the HIV self-efficacy questionnaire and reported that Inter-vention group participants were significantly more confident than control group participants about their ability to manage fatigue and its impact on their lives at follow-up [17].
3. Mood
Mood was assessed over time in each of the six studies that compared mindfulness-based interven-tions to waitlist control or usual care [16,17,30,31,
35,49]—three of these reported a significant effect
MBSR(BC) group showed significantly greater im-provements in anxiety (p= .007) assessed using the State-Trait Anxiety Inventory, and FORs (overall and problems;p<.01), as measured using the Con-cerns About Recurrence Scale. Results for depres-sion (measured using CES-D) showed that
participants assigned to MBSR(BC) tended to report greater improvement than those in usual care; how-ever, this trend did not reach statistical significance. The authors confirmed that improvement in both the cluster of psychological symptoms (anxiety, de-pression, perceived stress and quality of life (QOL), emotional well-being) (p= 0.007) was related to as-signment [35]. Lengacher et al. [31] assessed mood, enjoyment of life, distress and sadness, using the MDASI [62]. The MBSR(BC) intervention showed an improvement in mood, but not in distress or sadness. Johns et al. [49] assessed anxiety using the Patient Health Questionnaire Generalized Anxiety Disorder Scale—the MBSR group demonstrated sig-nificantly lower anxiety scores than the control group with a large effect size (d=− 0.98).Depres-sion scores (measured using PHQ-8) were also sig-nificantly lower with large differences at final follow-up (d=−1.71) [49].
Using the Beck Depression Inventory-II (BDI-II), Bower et al. [17] found that a significant Group x time interaction at post-treatment was not main-tained at 3 month follow-up. Stress decreased over the assessment period in both groups, as measured using the Perceived Stress Scale (PSS). Hoffman et al. [30] reported statistically significant improve-ments in outcome in the MBSR group compared with control group at both 8 and 12 weeks (for POMS total mood disturbance). The subscales of anxiety, depression showed these effects only at 8 week follow-up. Anger was significantly improved at 12 weeks but not at 8 weeks. The authors found that increased hours of formal mindfulness class-room and home practice in the MBSR group was associated with improved scores in POMS total mood disturbance [30]. Using the State Trait Anx-iety ( STAI), Blaes et al. [16] found no significant difference between groups in anxiety despite a trend towards improvement for MBCR.
4. Sleep/insomnia
Sleep/insomnia was assessed over time in three studies that compared mindfulness-based interven-tions to waitlist control or usual care—two of these reported a significant effect of the intervention on sleep/insomnia over time [16,49]. Two of the stud-ies assessed sleep quality using the Pittsburgh Sleep Quality Index (PSQI). Blaes et al. [16] reported that total sleep quality improved in those who received
MBCR compared to those in the control group— this was maintained at 4 months. Conversely, Bower et al. [17] reported no significant effects for subject-ive sleep quality. Johns et al. [49] used the Insomnia Severity Index and reported that sleep disturbance was significantly improved for intervention group compared with the control condition at both follow-up points.
Other psycho-social interventions vs. usual care
The eight remaining interventions incorporated psycho-education, motivational strategies and lifestyle and be-haviour change approaches [14,15,25,26,43,47,51].
Primary outcome: fatigue A patient education program was reported to have improved fatigue [47], while a combined psycho-education and physical activity inter-vention showed that participants in the interinter-vention group showed greater improvement in fatigue, but this was not a significant effect [25]. Health coaching was found to lead to a significant reduction on fatigue at 12 months but not at 3 months [42] and an intervention employing Motivational interviewing showed no signifi-cant differences between groups at 6 months [15]. Life-style interventions did reported mixed findings regarding their impact on fatigue, with one [14, 34] reporting no significant differences between groups and one a signifi-cant effect of intervention at 6 months that was not maintained at 12 months [51]. An online intervention that aimed to enhance self-efficacy to manage problems associated with cancer-related fatigue following primary cancer treatment reported no significant changes in fa-tigue [26].
Secondary outcomes
1. Global quality of life /functional impact of fatigue Seven of the trials on other psycho-social interven-tions reported on Global QoL/functional impact of fatigue [15,25,26,43,47,51]. Four reported signifi-cant effect of the intervention over time on at least one measure of Global QoL/functional impact of fa-tigue [25,43,47,48]. Using the SF-36, Bennett et al. [15] noted that group × time interaction was not significant for either mental or physical health. Fillion et al. [28] reported marginal group × time interaction effects for physical quality of life in favour of the intervention group using the Medical Outcomes Study Short Form 12-Item Health Survey (SF-12). While mental quality of life showed no interaction or main effects, both conditions im-proved overtime. Conversely, there was no effect on the intervention on mental well-being.
study by Reif et al. [47], all functional and symp-tom scale values as well as single items values in-creased significantly in the intervention compared to the control group. Willems et al. also reported that the intervention was effective in increasing emotional and social functioning at 6 months [48]; however, these findings were not maintained at 12 months [51]. Similarly, Yun et al. [43] re-ported a significantly greater increase in global QOL and in emotional, cognitive and social func-tioning scores of EORTC QLQ-C30 scales. How-ever, significance was lost on the emotional, and social functioning scores after Bonferroni correc-tions were applied for 15 multiple comparisons. Using the Functional Assessment of Cancer Therapy Scale-general (FACT-G), Foster et al. [26] did not report a significant effect of the intervention over time on the Fact-G measure. 2. Fatigue self-efficacy
Foster et al. did not reported improved fatigue self-efficacy at final follow-up [26].
3. Mood
Mood was assessed in six of the seven studies reporting on other psycho-social interventions [14, 25, 26, 43, 47, 51]. Yun et al. [43] reported that the web-based intervention group had clinic-ally more meaningful improvement than the con-trol group in HADS anxiety score. However, a statistically significant greater decrease in HADS was lost after Bonferroni corrections were ap-plied. Willems et al. reported that another online intervention was effective in reducing HADS de-pression scores at 6months [48], but at 12 months from baseline, the intervention group no longer differed from the control group [51]. Reif et al. [47] also used the HADS and reported group × time interactions in favour of the inter-vention group for both anxiety and depression. Both Foster et al. [26] and Bantum et al. [14] re-ported a non-significant difference in groups in change over time using the Patient Health Ques-tionnaire (PHQ-8). Fillion et al. [25] reported that no interaction effects for emotional distress (POMS anxiety + depression) were found. 4. Sleep/insomnia
Sleep/insomnia was assessed in three of the seven studies reporting on other psycho-social interven-tions [14,43,47]. Reif et al. reported an improve-ment in the intervention group, compared to the control group using the EORTC QLQ-C30 insom-nia subscale [47]. Using the Women’s Health
Initia-tive Insomnia Rating Scale (WHIIRS), Bantum et al. [14] reported that the intervention group showed reduced insomnia from baseline to 6 months
compared to the control group. Finally, Yun et al [43] did not report a significant effect of the inter-vention on scores on the Medical Outcome Study– Sleep Scale (MOS-SS) Sleep Quality Index I and II.
Further investigation of heterogeneity in trials comparing psychological interventions (all types) vs. usual care In the original protocol, we hypothesised that each of the factors below has the potential to have a clinically meaningful effect on the response to a psychological intervention amongst fatigued post-treatment cancer survivors.
1. Intervention for specific cancer type only vs intervention for any cancer type
2. In-person interventions vs remote interventions 3. Interventions specifically designed to treat fatigue after
cancer treatment vs interventions not specific for fatigue
We performed narrative assessment of the influence of these factors on the primary outcomes. This narrative synthesis did not reveal any clear patterns in the findings based on differential influences of these factors on the effect of psychological interventions on fatigue.
Comparison 3: intervention for specific cancer type only vs. intervention for any cancer type
In a previous Cochrane review [8], it was noted that many of the studies of fatigued cancer patients during cancer included only breast cancer patients.Nine of the effectiveinterventions in this review only included breast cancer patients. Seven studies that focused on breast cancer did not report a reduc-tion in fatigue. Of the 17 studies with mixed samples, 13 re-ported a significant reduction in fatigue. However, breast cancer patients were often overrepresented in the studies of mixed samples. For example, one study [42] noted that over 60% of their sample had had breast cancer.Most studies in-cluded participants who had received a variety and combina-tions of cancer treatments (e.g. surgery, chemotherapy, radiotherapy). In one study [15], the authors specified that targeted patients were those who had received only radiotherapy.
Comparison 4: in-person interventions vs. remote interventions