R E S E A R C H A R T I C L E
Open Access
Relations of low contrast visual acuity, quality of
life and multiple sclerosis functional composite: a
cross-sectional analysis
Johann Schinzel
1, Hanna Zimmermann
1, Friedemann Paul
1,2, Klemens Ruprecht
2,3, Katrin Hahn
3,
Alexander U Brandt
1and Jan Dörr
1,2*Abstract
Background:Although common and often disabling in multiple sclerosis (MS), visual dysfunction is currently not adequately accounted for in both clinical routine and MS trials. Sloan low contrast letter acuity (SLCLA) is a
standardised chart-based measure of visual function particular at low contrast and has been suggested as additional visual component to the Multiple Sclerosis Functional Composite (MSFC). Here, we evaluate the relations between SLCLA, retinal integrity, MSFC, and quality of life (QoL) in MS patients.
Methods:Cross-sectional analysis of retinal nerve fibre layer (RNFL) thickness, MSFC, SLCLA (2.5% and 1.25% contrast levels), visual evoked potentials, and QoL (Short Form (SF) 36, National Eye Institute Visual Functioning Questionnaire (NEIVFQ)) using baseline data of 92 MS patients from an ongoing prospective longitudinal trial. Relations between RNFL thickness or P100 latency and SLCLA were analysed using generalised estimating
equations (GEE) accounting for intra-individual inter-eye dependencies and corrected for age, gender, and history of optic neuritis. Pearson’s correlations were used to assess relations between SLCLA, MSFC, and QoL.
Results:SLCLA reflected RNFL thickness (p = 0.021) and P100 latency (p = 0.004) and predicted vision-related QoL, reflected by the NEIVFQ39 subscores“general vision”and“near activities”(p < 0.008 for both). SLCLA did not predict general QoL reflected by SF36. Implementing SLCLA into MSFC, thus creating a four-dimensional MSFC4, captured aspects of disability reflected by the NEIVFQ39 subscores“general vision”(r = 0.42, p < 0.0001) and“near activity” (r = 0.3, p = 0.014) which were not captured by standard MSFC3.
Conclusions:SLCLA at 2.5% and 1.25% contrast levels correlates with retinal morphology and P100 latency and predicts some aspects of vision-related QoL in MS. More importantly, using a prospective cross-sectional approach we provide evidence that extending the MSFC by SLCLA as an additional visual component increases the performance of MSFC to capture MS-related disability. Longitudinal data on the relation between SLCLA, MSFC, and QoL will be available in the near future.
Keywords:Multiple sclerosis, Low contrast visual acuity, Sloan low contrast letter acuity, Multiple sclerosis functional composite, Quality of life, Retinal nerve fibre layer thickness
* Correspondence:[email protected] 1
NeuroCure Clinical Research Center, Charité - Universitätsmedizin Berlin, Charitéplatz 1, 10117 Berlin, Germany
2
Clinical and Experimental Multiple Sclerosis Research Center, Department of Neurology, Charité - Universitätsmedizin Berlin, Berlin, Germany
Full list of author information is available at the end of the article
Background
Afferent persistent visual dysfunction is frequent in multiple sclerosis (MS) [1] and is either due to incomplete recovery from optic neuritis (ON) or to rather diffuse damage of the optic pathway that may occur independent of ON [2-4]. According to a German study in which MS patients rated vision as the second most important physical function after ambulation, integrity of vision is of particular importance [5]. Likewise, several studies consistently showed that visual impairment compromises health related quality of life (QoL) [6,7]. Yet in clinical routine, the importance of visual function is not adequately accounted for, for a number of reasons: i) substantial vagueness exists concerning the mor-phological substrate of the visual deficit in patients without ON history; ii) bedside parameters for assessment of visual functions focus on high contrast (HC) visual acuity (VA) which is insensitive to change and to more diffuse and sub-tle visual dysfunction [8]; iii) potentially more sensitive mea-sures like low contrast (LC) VA are rarely used in clinical routine; iv) patient-reported outcomes such as QoL that might disclose the impact of visual deficits on daily life are hardly addressed outside clinical trials; and v) most QoL questionnaires do not adequately capture vision-related as-pects. Consequently, there is a need for better evaluation of more elaborate yet easy to perform measures of visual func-tion and vision-related QoL assessment in MS patients.
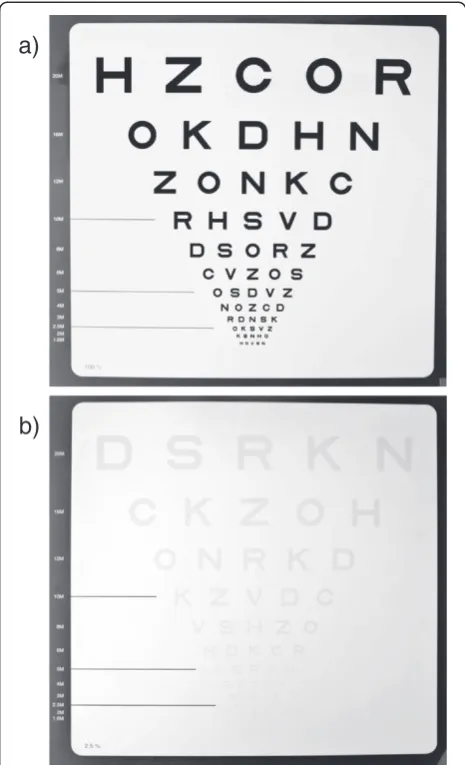
The Sloan low contrast letter acuity (SLCLA) charts comprise a set of letter charts based on the standardised format of the HC VA charts used in the early treatment of diabetic retinopathy study (ETDRS), but with different levels of contrast between letters (ranging from black to light grey) on white background (Figure 1). LCVA test-ing ustest-ing SLCLA charts has been validated in MS pa-tients and has been shown to capture unique aspects of neurologic dysfunction that were not captured by stand-ard disability rating scales [9-11]. Moreover, SLCLA cor-related with health-cor-related QoL in MS patients [12].
Since its introduction in the late 1990s the Multiple Sclerosis Functional Composite (MSFC) has been estab-lished as major secondary outcome parameter for deter-mination of disability in clinical MS trials [13]. Importantly, the MSFC accounts for the variability in health-related QoL measures not reflected by the expanded disability sta-tus scale (EDSS) [14]. Given the major shortcoming of the MSFC that it completely disregards vision as frequently im-paired dimension in MS [8] considerations exist to comple-ment the original MSFC with a fourth, visual component [8,15]; and SLCLA testing is considered a promising candidate [10,15]. However, formal prospective evaluation whether addition of SLCLA performance improves MSFC information overall has not yet been performed [15].
Using the baseline data set of an ongoing trial on the course of visual system parameters in MS patients we here evaluated the relation of SLCLA, morphological
and functional visual system parameters, QoL, and MSFC in MS patients cross-sectionally. In particular we investi-gated whether implementation of SLCLA testing improves the performance of the MSFC.
Methods
Patients
We used the baseline data set of an ongoing, mono-centric, longitudinal observational trial that evaluates changes of visual system parameters in MS patients over time (NCT01272596). Patients, aged 18–65 years, with a first episode of demyelinating CNS disease suggestive of MS (clinically isolated syndrome, CIS) and patients with definite MS according to the revised panel criteria [16] who had either relapsing remitting (RR) or second-ary progressive (SP) disease course were eligible without restrictions regarding disease modifying treatments. Main exclusion criteria were MS relapses within the previous
a)
b)
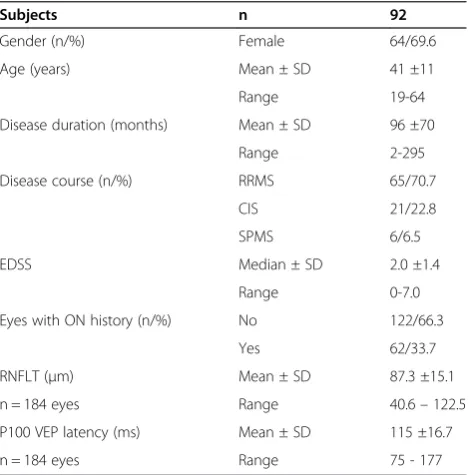
month, refractive errors > ± 8 dpt, and MS unrelated ret-inal pathologies, e.g. glaucoma or diabetic retinopathy. Of the 100 patients enrolled in the longitudinal trial, 92 tients were eligible for cross-sectional analysis. Eight pa-tients had to be excluded because of exclusion criteria that became evident after enrolment or during the study (glau-coma, retinal ablation, severe myopia, unclear retinal pathology). A detailed cohort overview is given in Table 1.
Ethical statement
The study was approved by the local ethics committee and was conducted in accordance to the Declaration of Helsinki in its currently applicable version and the applic-able German laws. All participants gave informed written consent.
Low contrast visual acuity
LCVA was tested using SLCLA charts at four different contrast levels (100%, 10%, 2.5%, and 1.25%), meaning that the 100% level represents VA at HC. The 10% level was used for adaptation. SLCLA charts were standar-dised according to the ETDRS VA charts with five letters per line (Figure 1). Testing conditions were standardised with respect to illumination of the examination room (80-100 cd/m2), distance between patient and chart (2 m), position of patients (sitting), correction of visus (best available correction), and instructions given. The charts were scored based on the number of letters identified cor-rectly (letter score, maximum score 60) [9]. All SLCLA tests were conducted binocularly (both eyes open) as this
approach integrates possibly relevant binocular summa-tion/inhibition effects [17], hence providing a measure of overall visual function closer to the “real life” situation than monocular testing. SLCLA per contrast level is given as number of letters identified correctly (max. 60).
Multiple sclerosis functional composite
The conventional MSFC battery (MSFC3), comprising the 25 foot timed walk test (TWT), 9-hole peg test (9HPT) and paced auditory serial addition test (PASAT) was performed according to standardised procedures, calculated according to the standard manual, and nor-malised to this cohort [13]. A new“MSFC4”was created which additionally included SLCLA testing at 2.5% or 1.25% contrast levels. The MSFC4 score was calculated using SLCLA z-scores according to the formula (Z9HPT+
ZT25FW+ ZPASAT+ ZSloan)/4, as previously described [10].
Optical coherence tomography
Retinal nerve fibre layer (RNFL) thickness was determined using spectral domain optical coherence tomography (SD-OCT; Heidelberg Engineering, Germany; software version 5.1) according to previously reported scanning protocols [2]. Briefly, RNFL thickness around the optic disc was ac-quired using the 3.4 mm circle scan with the eye tracker system activated, and the maximum number of averaging frames in ART MEAN mode was tried to be achieved. All scans were performed by trained operators and were reviewed for scan quality according to the OSCAR IB con-sensus criteria [18]. Only eyes that passed the quality re-view were included in the analysis.
Visual evoked potentials
Standard checkerboard stimulation was used for gener-ation of visual evoked potentials (VEP). The electrodes were placed on Oz and Fz according to the“10-20 Inter-national System”. The analysed period was 500 ms fol-lowing each visual stimulus; the P100 latency (ms) was recorded.
Quality of life questionnaires
For assessment of QoL both the validated German ver-sions of the self-administered questionnaires Short Form (SF) 36 and the National Eye Institute Visual Functioning Questionnaire (NEIVFQ) were used. SF36 was analysed according to normative data and scripts [19], providing the aggregate summary measures physical component sum-mary (PCS) and mental component sumsum-mary (MCS). The NEIVFQ, introduced in 1998 as a 51-item questionnaire, consists of 12 individually rated subscales and an overall composite (total) score [20]. Two additional versions com-prising 39 and 25 items and a neuro-ophthalmic supple-ment are now available which are increasingly used in clinical MS research to address vision-related QoL aspects Table 1 Cohort demographic and clinical data
Subjects n 92
Gender (n/%) Female 64/69.6
Age (years) Mean ± SD 41 ±11
Range 19-64
Disease duration (months) Mean ± SD 96 ±70
Range 2-295
Disease course (n/%) RRMS 65/70.7
CIS 21/22.8
SPMS 6/6.5
EDSS Median ± SD 2.0 ±1.4
Range 0-7.0
Eyes with ON history (n/%) No 122/66.3
Yes 62/33.7
RNFLT (μm) Mean ± SD 87.3 ±15.1
n = 184 eyes Range 40.6–122.5
P100 VEP latency (ms) Mean ± SD 115 ±16.7
n = 184 eyes Range 75 - 177
[1,12,21,22]. Here, we used the 39 item version [23] as at study initiation a validated German translation was avail-able only for this version.
Statistical analysis
Statistical analysis was performed using SPSS 21 (IBM, Somers, NY, USA). Distribution analysis of quantitative measures was performed using skewness, kurtosis and Kolmogorov-Smirnov tests. Pearson’s correlations were used to assess relations between MSFC, SLCLA, and QoL. Performance of MSFC4 was evaluated using partial correlations controlling for MSFC3. Relations between RNFL thickness or P100 latency and QoL were analysed using generalised estimating equations (GEE), a statistical model that accounts for intra-individual inter-eye depend-encies. All GEE models were corrected for age, gender, and ON history. Statistical significance was established at p < 0.05. All analyses should be considered exploratory as no previous sample size calculation or adjustment for multiple testing was applied.
Results
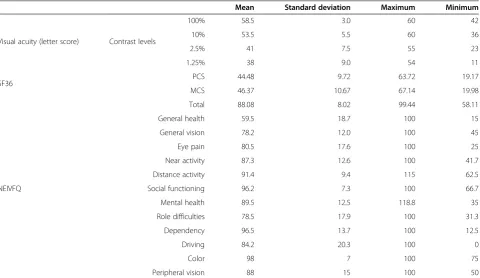
92 patients were included in the cross-sectional analysis. Basic demographic and clinical data are provided in Table 1, a summary of VA at both HC and LC levels and data on both general and vision-related QoL are given in Table 2. While as expected, VA at 100% and 10% levels
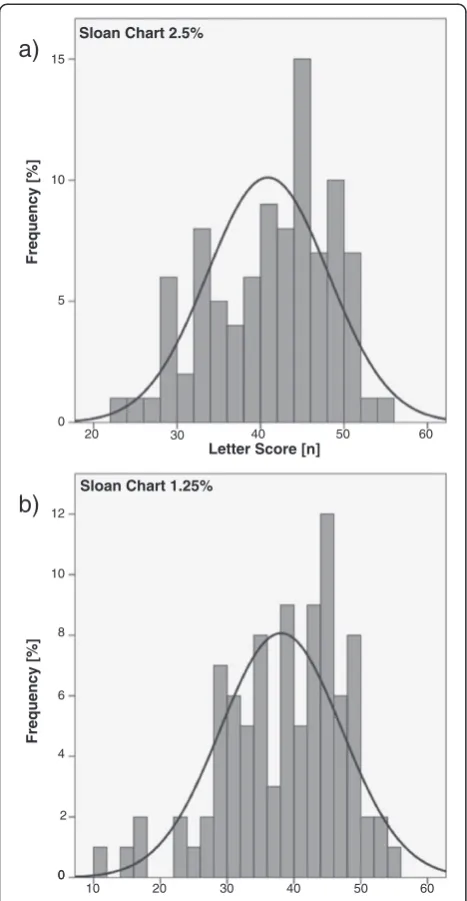
showed strong ceiling effects, VA at 1.25% and particu-larly at 2.5% levels showed a near-normal distribution (Figure 2). Therefore, we focused on the 2.5% contrast level and provided additional data derived from 1.25% level where relevant.
Correlations of low contrast visual acuity with retinal morphology and visual pathway function
To further characterise our cohort, RNFL thickness and P100 latency were determined (Table 1). Given recent stud-ies showing close relations between retinal morphology and LCVA [24,25] we first investigated, whether SLCLA at the 2.5% level is predicted by RNFL thickness and, in a next step, by P100 latency. Using GEE analyses, which account for inter-eye relations in statistical models factoring ON history, age, and gender we observed a significant correl-ation between SLCLA at 2.5% and RNFL thickness (B = 4.562E-005; Standard Error (SE) = 1.983E-005; p = 0.021). Similar data were observed at the 1.25% level (B = 6.598E-005; SE = 2.468E-6.598E-005; p = 0.008). Likewise, SLCLA at 2.5% (B = -4.013E-005; SE = 1.508E-005; p = 0.008) and SLCLA at 1.25% (B = -5.555E-005; SE = 1.920E-005; p = 0.004) were inversely correlated with P100 latency.
Correlation of low contrast visual acuity with quality of life
We next investigated whether SLCLA reflects self-administered QoL assessment in MS patients. In contrast
Table 2 Visual acuity at different contrasts and quality of life data
Mean Standard deviation Maximum Minimum
Visual acuity (letter score) Contrast levels
100% 58.5 3.0 60 42
10% 53.5 5.5 60 36
2.5% 41 7.5 55 23
1.25% 38 9.0 54 11
SF36 PCS 44.48 9.72 63.72 19.17
MCS 46.37 10.67 67.14 19.98
NEIVFQ
Total 88.08 8.02 99.44 58.11
General health 59.5 18.7 100 15
General vision 78.2 12.0 100 45
Eye pain 80.5 17.6 100 25
Near activity 87.3 12.6 100 41.7
Distance activity 91.4 9.4 115 62.5
Social functioning 96.2 7.3 100 66.7
Mental health 89.5 12.5 118.8 35
Role difficulties 78.5 17.9 100 31.3
Dependency 96.5 13.7 100 12.5
Driving 84.2 20.3 100 0
Color 98 7 100 75
Peripheral vision 88 15 100 50
to previous reports [12], we did not observe a correlation between SLCLA at 2.5% and 1.25% levels and both the physical (PCS) and mental (MCS) component summary scores of the SF36 (Table 3). Given that SF36 is not de-signed to specifically capture vision-related QoL, we add-itionally used the vision-specific NEIVFQ39 which revealed a moderate correlation between SLCLA at the 2.5% (and also 1.25%) level and the NEIVFQ39 subscores“general vi-sion”and“near activities”(Table 3). SLCLA was not associ-ated with the NEIVFQ39 total score, which also includes subscores that seem rather irrelevant to MS patients like
ocular pain or peripheral vision. Importantly, neither the total score nor any of the subscores was associated with VA determined at the 100% contrast level (not shown).
Implementation of low contrast visual acuity into MSFC
A key question of our still ongoing longitudinal study is whether the overall performance of MSFC would be im-proved by implementation of LCVA. Here, in this cross-sectional analysis of the baseline data of the longitudinal trial we thus asked whether SLCLA at 2.5% level improves the predictive value of MSFC with respect to QoL. There-fore, we first assessed the correlation of standard MSFC3 with QoL as determined by SF36 (Table 3). We found that the correlation of MSFC3 with the SF36 PCS (r = 0.324, p = 0.004) was mainly driven by TWT, whereas no cor-relation was observed between MSFC3 and the MCS. When implementing SLCLA (2.5% and 1.25%) into a four-dimensional MSFC4 we observed that MSFC3 and MSFC4 performed similar well (for MSFC4: r = 0.328, p = 0.003). This association was, however, completely lost in partial correlation analyses controlling for MSFC3, indicating that the correlation for MSFC4 and SLCLA can be completely explained by disabilities captured already by MSFC3.
Given the above described limitations of SF36 with re-spect to visual are-spects we then used the NEIVFQ39 as a more vision-specific dependent variable. Both, MSFC3 and MSFC4 showed no correlation with total NEIVFQ39 scores but mild correlations with the subscores“near activ-ities”and“role”. As these associations were mainly driven by the 9-HPT component in MSFC3 and by SLCLA and/ or 9-HPT in MSFC4 (Table 3) we additionally performed partial correlations for MSFC4 and NEIVFQ39, controlling for MSFC3. Using this model revealed significant associa-tions for the NEIVFQ39 subscores “general vision” (r = 0.42, p < 0.0001) and “near activities” (r = 0.3; p = 0.014). Similar results were found at the 1.25% level (“general vi-sion”: r = 0.41; p = 0.001; “near activities”: r = 0.27; p = 0.024), suggesting that MSFC4 captures some aspects of vision-related QoL not covered by conventional MSFC3.
Discussion
Using the cross-sectional baseline data set of an ongoing longitudinal trial on visual parameters in MS/CIS pa-tients we here addressed the relations between SLCLA, retinal integrity, VEP, health-related QoL, and disability. Our main findings are i) SLCLA determined at 2.5% contrast level is predicted by RNFL thickness and P100 latency; ii) QoL determined by SF36 PCS reflects pre-dominantly ambulation and, to a lesser degree, upper ex-tremity function but not visual function as assessed by SLCLA; iii) in contrast, visual dysfunction in MS patients, determined by SLCLA, is captured by the“general vision” and “near activities”subscores of the NEIVFQ39; and iv)
a)
b)
20 30 40 50 60
0 6 0
3 0
2 40 50
10
Sloan Chart 2.5%
Sloan Chart 1.25%
Frequency [%]
Frequency [%]
0 5 15
10
0 0 6
4
2 10
8 12
Letter Score [n]
Figure 2Distribution analysis of Sloan low contrast letter acuity.Depicted is the distribution of letter scores derived from Sloan low contrast letter acuity testing in the entire cohort at 2.5%
implementation of SLCLA as additional component might enhance the performance of the MSFC as it seems to cap-ture visual dysfunction as QoL-relevant aspect of disability not covered by the conventional MSFC.
In line with recent studies on retinal morphology in relation to visual disability in MS [25,26] our data show-ing a significant association between SLCLA and retinal axonal integrity independent of a previous ON support the hypothesis that SLCLA reflects diffuse neurodege-nerative processes in the retina, which could either be
due to primary degeneration, secondary to subclinical inflammation, or both. In addition to morphological as-pects, SLCLA testing also seems to capture physiologic function of the visual system as indicated by the signifi-cant association with P100 latency. The ability of SLCLA testing to capture visual deficits that have a major im-pact on the QoL of MS patients but are not adequately captured by standard visual assessments has been ad-dressed in another study by the same group [12]. When using the 25-item version of the NEIVFQ plus the 10-Table 3 Pearson correlation analyses of quality of life, multiple sclerosis functional composite, and Sloan low contrast letter acuity
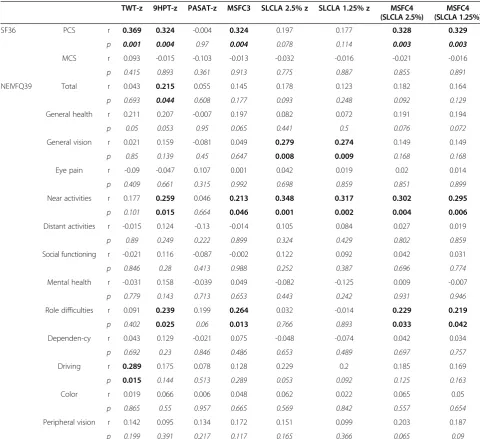
TWT-z 9HPT-z PASAT-z MSFC3 SLCLA 2.5% z SLCLA 1.25% z MSFC4 (SLCLA 2.5%)
MSFC4 (SLCLA 1.25%)
SF36 PCS r 0.369 0.324 -0.004 0.324 0.197 0.177 0.328 0.329
p 0.001 0.004 0.97 0.004 0.078 0.114 0.003 0.003
MCS r 0.093 -0.015 -0.103 -0.013 -0.032 -0.016 -0.021 -0.016
p 0.415 0.893 0.361 0.913 0.775 0.887 0.855 0.891
NEIVFQ39 Total r 0.043 0.215 0.055 0.145 0.178 0.123 0.182 0.164
p 0.693 0.044 0.608 0.177 0.093 0.248 0.092 0.129
General health r 0.211 0.207 -0.007 0.197 0.082 0.072 0.191 0.194
p 0.05 0.053 0.95 0.065 0.441 0.5 0.076 0.072
General vision r 0.021 0.159 -0.081 0.049 0.279 0.274 0.149 0.149
p 0.85 0.139 0.45 0.647 0.008 0.009 0.168 0.168
Eye pain r -0.09 -0.047 0.107 0.001 0.042 0.019 0.02 0.014
p 0.409 0.661 0.315 0.992 0.698 0.859 0.851 0.899
Near activities r 0.177 0.259 0.046 0.213 0.348 0.317 0.302 0.295
p 0.101 0.015 0.664 0.046 0.001 0.002 0.004 0.006
Distant activities r -0.015 0.124 -0.13 -0.014 0.105 0.084 0.027 0.019
p 0.89 0.249 0.222 0.899 0.324 0.429 0.802 0.859
Social functioning r -0.021 0.116 -0.087 -0.002 0.122 0.092 0.042 0.031
p 0.846 0.28 0.413 0.988 0.252 0.387 0.696 0.774
Mental health r -0.031 0.158 -0.039 0.049 -0.082 -0.125 0.009 -0.007
p 0.779 0.143 0.713 0.653 0.443 0.242 0.931 0.946
Role difficulties r 0.091 0.239 0.199 0.264 0.032 -0.014 0.229 0.219
p 0.402 0.025 0.06 0.013 0.766 0.893 0.033 0.042
Dependen-cy r 0.043 0.129 -0.021 0.075 -0.048 -0.074 0.042 0.034
p 0.692 0.23 0.846 0.486 0.653 0.489 0.697 0.757
Driving r 0.289 0.175 0.078 0.128 0.229 0.2 0.185 0.169
p 0.015 0.144 0.513 0.289 0.053 0.092 0.125 0.163
Color r 0.019 0.066 0.006 0.048 0.062 0.022 0.065 0.05
p 0.865 0.55 0.957 0.665 0.569 0.842 0.557 0.654
Peripheral vision r 0.142 0.095 0.134 0.172 0.151 0.099 0.203 0.187
p 0.199 0.391 0.217 0.117 0.165 0.366 0.065 0.09
Abbreviations:SF36Short Form 36 quality of life questionnaire,NEIVFQNational Eye Institute Visual Function Questionnaire,TWTtimed walk test,9-HPT9-hole peg test,PASATpaced auditory serial addition test (3 sec. version),SLCLASloan low contrast letter acuity,MSFC3three-dimensional (conventional) multiple sclerosis functional composite,MSFC4four-dimensional multiple sclerosis functional composite including Sloan low contrast letter acuity,rPearson correlation coefficient, pP-value,PCSphysical health composite score,MCSmental health composite score.
item neuro-ophthalmic supplement in a cohort of 167 pa-tients with RR or progressive MS, the authors observed significant correlations between both HCVA and LCVA with both total score and most of the subscores, with “near activities” “role difficulties” and “driving” subscores showing the strongest correlations. Notably, associations between SLCLA and QoL were reported to remain signifi-cant when controlling for HCVA. Interestingly, that study also revealed significant correlations between SLCLA and the PCS of SF36 in a sub-cohort of 115 patients. In con-trast, in our cohort, LCVA was reflected only by the sub-scores“general vision”and “near activities”, while HCVA was not related to QoL. Moreover, in our study, SLCLA did not predict QoL as determined by SF36, a difference that cannot be explained by different sample sizes. Our observation that only particular NEIVFQ subscores were correlated with SLCLA raises the question which aspects of visual demands in daily life are covered by the respect-ive subscores.“General vision” can be considered a more common aspect that is important in daily life. Thus, already mild reduction of LCVA might easily interfere with the “general vision”aspect. The item“near activities”reflects all actions at near distance and is thus affected by tasks requir-ing accurate execution or ability to distrequir-inguish small or pale objects, e.g. reading, writing, or painting. Thus, correlation of this aspect with impairment of LCVA seems to be likely. In contrast, as ocular pain for example is not a typical fea-ture in MS outside acute ON one would not expect inter-ference with the“eye pain”subscore of the NEIVFQ. While in the study by Mowry et al. [12] a different measure of visual performance, a different version of NEIVFQ, and a larger sample size was used, which impedes a direct com-parison with our data and may account for some of the observed discrepancies, the bottom line information of both studies are that in MS reduction of SLCLA nega-tively impacts QoL and that the NEIVFQ is a promising tool to capture vision-related QoL. Our data strengthen the roles of LCVA testing and NEIVFQ for evaluation of visual disability and its impact on QoL in MS.
Against this background SLCLA testing is a promising candidate to complement the current three-dimensional MSFC3 by a fourth visual component in order to com-pensate for its obvious limitation that it does not cover visual dysfunction. Earlier retrospective studies already suggested that such a four-dimensional MSFC4 would indeed capture relevant visual aspects of disability not covered by EDSS or standard MSFC [10]. A recent re-view on disability outcome parameters in MS deemed formal inclusion of SLCLA test in the MSFC appropriate, but demanded prospective testing to confirm whether such an extension improves MSFC performance overall [15]. Here, we evaluated the inclusion of SLCLA in the MSFC in a prospective approach. QoL was chosen as dependent variable as this parameter is increasingly
considered important when evaluating disease progression and treatment effects in MS. Despite the availability of more MS-specific QoL tools we opted for the SF36 as this tools has been used for the initial validation of the MSFC and in numerous other trials [12,14]. In keeping with the observation of Heesen at al. that in the self-concept of MS patients ambulation has the highest significance [5] the correlation between standard MSFC and the PCS of the SF36 in our cohort was mainly driven by TWT. Although vision was the second important function in the study by Heesen [5], in our cohort this observation was not reflected by SF36-determined QoL when SLCLA was included in a model controlling for MSFC3. The most likely explanation and the rationale for thereafter using the NEIVFQ is that SF36 is too insensitive a measure with respect to vision. Using NEIVFQ in the same model controlling for functions captured by standard MSFC3 revealed that the inclusion of SLCLA testing at the 2.5% (and 1.25%) level captured addi-tional aspects of disability that affect at least some aspects of vision-related QoL, reflected by the“general vision”and “near activities” subscores. As a conclusion, these cross-sectional findings may cautiously suggest implementation of SLCLA testing in the MSFC as an option to increase the ability of the MSFC to capture MS-relevant disability.
Several limitations of our study need to be addressed. First, data are based on cross-sectional analyses of the baseline data set of an ongoing clinical trial. Whether MSFC4 is also superior to MSFC3 with respect to longitu-dinal intra-individual changes of LCVA remains to be evaluated; longitudinal data are underway. Second, the majority of included patients had either CIS or RRMS with a median EDSS of 2.0. Thus, our cohort represents rather mildly disabled MS patients, and more severely disabled patients or patients with progressive disease are certainly under-represented. Third, we observed a few outliers with rather unaffected SLCLA but low NEIVFQ39-scores. Ha-ving a closer look at these particular patients, mainly the NEIVFQ39 subscores “role”, “peripheral vision”, “mental health”,“eye pain”and“dependency”were the worst rated. Although these aspects are probably not closely related to MS-specific aspects of visual disability we did not find any other relevant ocular disease in these patients. Hence, we refrained from excluding these patients from the analyses.
Conclusions
Competing interests
This work was supported by a limited research grant by Novartis Pharma to JD. The author(s) declare that they have no further competing interests.
Authors’contributions
JS evaluated the patients, analysed data and drafted the manuscript. HZ evaluated the patients and made substantial contributions to analysis and interpretation of data. FP made substantial contributions to conception and design of the study and interpretation of data. KR and KH made substantial contributions to acquisition and interpretation of data. AB supervised the analysis and interpretation of data. JD was in charge of study conception and design, supervised acquisition and interpretation of data and drafted the manuscript. All authors critically revised the manuscript for important intellectual content. All authors read and approved the final manuscript.
Acknowledgements
This work was supported by German Research Foundation grant Exc. 257. We thank our study nurse Katharina Stößlein for excellent assistance in managing and organising this study.
Author details
1
NeuroCure Clinical Research Center, Charité - Universitätsmedizin Berlin, Charitéplatz 1, 10117 Berlin, Germany.2Clinical and Experimental Multiple Sclerosis Research Center, Department of Neurology, Charité - Universitäts-medizin Berlin, Berlin, Germany.3Department of Neurology, Charité - Univer-sitätsmedizin Berlin, Berlin, Germany.
Received: 27 September 2013 Accepted: 12 February 2014 Published: 20 February 2014
References
1. Jasse L, Vukusic S, Durand-Dubief F, Vartin C, Piras C, Bernard M, Pélisson D, Confavreux C, Vighetto A, Tilikete C:Persistent visual impairment in mul-tiple sclerosis: prevalence, mechanisms and resulting disability.Mult Scler
2013,19:1618–1626.
2. Oberwahrenbrock T, Schippling S, Ringelstein M, Kaufhold F, Zimmermann H, Keser N, Young KL, Harmel J, Hartung H-P, Martin R, Paul F, Aktas O, Brandt AU: Retinal damage in multiple sclerosis disease subtypes measured by high-resolution optical coherence tomography.Mult Scler Int2012,2012:530305. 3. Dörr J, Wernecke KD, Bock M, Gaede G, Wuerfel JT, Pfueller CF, Bellmann-Strobl J,
Freing A, Brandt AU, Friedemann P:Association of retinal and macular damage with brain atrophy in multiple sclerosis.PLoS ONE2011,6:e18132.
4. Oberwahrenbrock T, Ringelstein M, Jentschke S, Deuschle K, Klumbies K, Bellmann-Strobl J, Harmel J, Ruprecht K, Schippling S, Hartung H-P, Aktas O, Brandt AU, Paul F:Retinal ganglion cell and inner plexiform layer thinning in clinically isolated syndrome.Mult Scler2013,19:1887–1895.
5. Heesen C, Böhm J, Reich C, Kasper J, Goebel M, Gold SM:Patient perception of bodily functions in multiple sclerosis: gait and visual function are the most valuable.Mult Scler2008,14:988–991.
6. Balcer LJ, Baier ML, Kunkle AM, Rudick RA, Weinstock-Guttman B, Simonian N, Galetta SL, Cutter GR, Maguire MG:Self-reported visual dysfunction in multiple sclerosis: results from the 25-Item National Eye Institute Visual Function Questionnaire (VFQ-25).Mult Scler2000,6:382–385.
7. Cole SR, Beck RW, Moke PS, Gal RL, Long DT:The National Eye Institute Visual Function Questionnaire: experience of the ONTT. Optic Neuritis Treatment Trial.Invest Ophthalmol Vis Sci2000,41:1017–1021.
8. Rudick R, Antel J, Confavreux C, Cutter G, Ellison G, Fischer J, Lublin F, Miller A, Petkau J, Rao S, Reingold S, Syndulko K, Thompson A, Wallenberg J, Weinshenker B, Willoughby E:Recommendations from the National Multiple Sclerosis Society Clinical Outcomes Assessment Task Force.Ann Neurol
1997,42:379–382.
9. Balcer LJ, Baier ML, Pelak VS, Fox RJ, Shuwairi S, Galetta SL, Cutter GR, Maguire MG: New low-contrast vision charts: reliability and test characteristics in patients with multiple sclerosis.Mult Scler2000,6:163–171.
10. Balcer LJ, Baier ML, Cohen JA, Kooijmans MF, Sandrock AW, Nano-Schiavi ML, Pfohl DC, Mills M, Bowen J, Ford C, Heidenreich FR, Jacobs DA, Markowitz CE, Stuart WH, Ying G-S, Galetta SL, Maguire MG, Cutter GR:Contrast letter acuity as a visual component for the Multiple Sclerosis Functional Composite.
Neurology2003,61:1367–1373.
11. Baier ML, Cutter GR, Rudick RA, Miller D, Cohen JA, Weinstock-Guttman B, Mass M, Balcer LJ:Low-contrast letter acuity testing captures visual
dysfunction in patients with multiple sclerosis.Neurology2005, 64:992–995.
12. Mowry EM, Loguidice MJ, Daniels AB, Jacobs DA, Markowitz CE, Galetta SL, Nano-Schiavi ML, Cutter GR, Maguire MG, Balcer LJ:Vision related quality of life in multiple sclerosis: correlation with new measures of low and high contrast letter acuity.J Neurol Neurosurg Psychiatry2009,80:767–772. 13. Fischer JS, Rudick RA, Cutter GR, Reingold SC:The Multiple Sclerosis
Functional Composite Measure (MSFC): an integrated approach to MS clinical outcome assessment. National MS Society Clinical Outcomes Assessment Task Force.Mult Scler1999,5:244–250.
14. Miller DM, Rudick RA, Cutter G, Baier M, Fischer JS:Clinical significance of the multiple sclerosis functional composite: relationship to patient-reported quality of life.Arch Neurol2000,57:1319–1324.
15. Cohen JA, Reingold SC, Polman CH, Wolinsky JS:Disability outcome measures in multiple sclerosis clinical trials: current status and future prospects.Lancet Neurol2012,11:467–476.
16. Polman CH, Reingold SC, Edan G, Filippi M, Hartung H-P, Kappos L, Lublin FD, Metz LM, McFarland HF, O’Connor PW, Sandberg-Wollheim M, Thompson AJ, Weinshenker BG, Wolinsky JS:Diagnostic criteria for multiple sclerosis: 2005 revisions to the“McDonald Criteria.Ann Neurol2005,58:840–846. 17. Pineles SL, Birch EE, Talman LS, Sackel DJ, Frohman EM, Calabresi PA,
Galetta SL, Maguire MG, Balcer LJ:One eye or two: a comparison of binocular and monocular low-contrast acuity testing in multiple sclerosis.Am J Ophthalmol2011,152:133–140.
18. Tewarie P, Balk L, Costello F, Green A, Martin R, Schippling S, Petzold A: The OSCAR-IB consensus criteria for retinal OCT quality assessment.
PLoS ONE2012,7:e34823.
19. Bullinger M, Kirchberger I:Fragebogen zum Gesundheitszustand (SF-36).KG: Hogrefe-Verlag GmbH und Co; 1998.
20. Mangione CM, Berry S, Spritzer K, Janz NK, Klein R, Owsley C, Lee PP: Identifying the content area for the 51-item National Eye Institute Visual Function Questionnaire: results from focus groups with visually impaired persons.Arch Ophthalmol1998,116:227–233.
21. Noble J, Forooghian F, Sproule M, Westall C, O’Connor P:Utility of the National Eye Institute VFQ-25 questionnaire in a heterogeneous group of multiple sclerosis patients.Am J Ophthalmol2006,142:464–468. 22. Ma S-L, Shea JA, Galetta SL, Jacobs DA, Markowitz CE, Maguire MG, Balcer LJ:
Self-reported visual dysfunction in multiple sclerosis: new data from the VFQ-25 and development of an MS-specific vision questionnaire.
Am J Ophthalmol2002,133:686–692.
23. Franke G, Esser J, Voigtländer A, Mähner N:Der National Eye Institute– Visual Function Questionnaire (NEIVFQ). Erste Ergebnisse zur psychometrischen Überprüfung eines Verfahrens zur Erfassung der Lebensqualität bei Sehbeeinträchtigten.Z Mol Psychol1998,7:178–184. 24. Bock M, Brandt AU, Kuchenbecker J, Dörr J, Pfueller CF, Weinges-Evers N, Gaede G, Zimmermann H, Bellmann-Strobl J, Ohlraun S, Zipp F, Paul F: Impairment of contrast visual acuity as a functional correlate of retinal nerve fibre layer thinning and total macular volume reduction in multiple sclerosis.Br J Ophthalmol2012,96:62–67.
25. Walter SD, Ishikawa H, Galetta KM, Sakai RE, Feller DJ, Henderson SB, Wilson JA, Maguire MG, Galetta SL, Frohman E, Calabresi PA, Schuman JS, Balcer LJ:Ganglion cell loss in relation to visual disability in multiple sclerosis.Ophthalmology2012,119:1250–1257.
26. Saidha S, Syc SB, Durbin MK, Eckstein C, Oakley JD, Meyer SA, Conger A, Frohman TC, Newsome S, Ratchford JN, Frohman EM, Calabresi PA:Visual dysfunction in multiple sclerosis correlates better with optical coherence tomography derived estimates of macular ganglion cell layer thickness than peripapillary retinal nerve fiber layer thickness.Mult Scler2011, 17:1449–1463.
doi:10.1186/1471-2377-14-31