R E S E A R C H A R T I C L E
Open Access
Use of estimated glomerular filtration rate
to predict incident chronic kidney disease
in patients at risk of cardiovascular disease:
a retrospective study
Saif Al-Shamsi
1*, Abderrahim Oulhaj
2, Dybesh Regmi
3and Romona D. Govender
3Abstract
Background:Patients with cardiovascular disease are at an increased risk of chronic kidney disease (CKD). However, data on incident CKD in patients with multiple vascular comorbidities are insufficient. In this study, we identified the predictors of CKD stages 3–5 in patients at risk of cardiovascular disease and used their estimated glomerular filtration rate (eGFR) to construct a nomogram to predict the 5-year risk of incident CKD.
Methods:Ambulatory data on 622 adults with preserved kidney function and one or more cardiovascular disease risk factors who attended outpatient clinics at a tertiary care hospital in Al-Ain, United Arab Emirates were obtained retrospectively. eGFR was calculated using the Chronic Kidney Disease Epidemiology Collaboration equation and assessed every 3 months from baseline to December 12, 2017. Fine and Gray competing risk regression model was used to identify the independent variables and construct a nomogram to predict incident CKD at 5 years, which is defined as eGFR < 60 mL/min/1.73 m2for≥3 months. Time-dependent area under the receiver operating characteristic curve (AUC) was used to evaluate the discrimination ability of the model. Calibration curves were applied to determine the calibration ability and adjusted for the competing risk of death. Internal validation of predictive accuracy was performed using K-fold cross-validation.
Results: Of the 622 patients, 71 had newly developed CKD stages 3–5 over a median follow-up of 96 months (interquartile range, 86–103 months). Baseline eGFR, hemoglobin A1c, total cholesterol, and history of diabetes
mellitus were identified as significant predictors of CKD stages 3–5. The nomogram had good discrimination
in predicting the disease stages, with a time-dependent AUC of 0.918 (95% confidence interval, 0.846–0.964)
at 5 years, after internal validation by cross-validation.
Conclusions: This study demonstrated that incident CKD could be predicted with a simple and practical nomogram in patients at risk of cardiovascular disease and with preserved kidney function, which in turn could help clinicians make more informed decisions for CKD management in these patients.
Keywords: Chronic kidney disease, Estimated glomerular filtration rate, Cardiovascular disease, Prediction, Nomogram, Sub-distribution hazards model
© The Author(s). 2019Open AccessThis article is distributed under the terms of the Creative Commons Attribution 4.0 International License (http://creativecommons.org/licenses/by/4.0/), which permits unrestricted use, distribution, and reproduction in any medium, provided you give appropriate credit to the original author(s) and the source, provide a link to the Creative Commons license, and indicate if changes were made. The Creative Commons Public Domain Dedication waiver (http://creativecommons.org/publicdomain/zero/1.0/) applies to the data made available in this article, unless otherwise stated. * Correspondence:salshamsi@uaeu.ac.ae
1Department of Internal Medicine, College of Medicine and Health Sciences, United Arab Emirates University, Al Ain, United Arab Emirates
Background
Cardiovascular disease (CVD) is the leading cause of death worldwide [1] and an important risk factor for chronic kidney disease (CKD) [2]. A diminished esti-mated glomerular filtration rate (eGFR) has been shown to increase the risk of CVD morbidity and mortality [3]. Approximately 1 in 10 people worldwide have CKD [4]. The marked increase in CKD prevalence over the past two decades could be explained by the rising incidence of chronic non-communicable diseases, such as diabetes mellitus (DM), hypertension (HTN), obesity, and dyslip-idemia [5, 6]. Much attention has been focused on the significant observation that CVD risk and mortality in patients with CKD is increased [7]. CVD and CKD share numerous risk factors, which suggests that patients with CVD also have an increased risk of CKD. CVD may pro-mote the initiation and progression of CKD, for example, through decreased renal perfusion due to atherosclerosis of the renal arteries [2]. The National Kidney Foundation Kidney Disease Outcomes Quality Initiative guidelines recommend that the eGFR be calculated in patients at risk for early detection of CKD and to prevent disease progres-sion [8].
However, despite the increasing CVD prevalence, data on CKD progression in patients at risk of CVD are limited [3, 9]. Therefore, we aimed to assess the risk of developing CKD stages 3–5 using baseline eGFR in patients with vascular comorbidities and to develop a nomogram to predict the 5-year risk of incident CKD for clinical use.
Methods
Patients and procedures
This is a retrospective cohort study of United Arab Emirates (UAE) nationals who visited the outpatient clinics at Tawam Hospital between April 1, 2008, and December 31, 2008, and had either CVD or one or more CVD risk factors. Tawam Hospital is a state-funded ter-tiary care facility located in Al Ain, UAE. This medical center and its outpatient clinics serve a population of ap-proximately 770,000, the majority of whom are UAE na-tionals [10]. The study protocol was approved by Tawam Hospital and the United Arab Emirates University re-search and ethics board (IRR536/17). The requirement for informed consent was waived because patient records and information were anonymized and de-identified prior to analysis.
Sociodemographic data and clinical information were manually extracted from 1118 patients’ ambulatory electronic medical records (EMRs) that were available for review. Inclusion criteria for this study were UAE nationals ≥18 years old with any of the following con-ditions at baseline: HTN, CVD, DM, dyslipidemia, his-tory of smoking, body mass index (BMI) ≥25 kg/m2,
systolic blood pressure (SBP) ≥120 mmHg, diastolic blood pressure (DBP)≥80 mmHg, serum glycosylated hemoglobin A1c (HbA1c)≥5.7%, serum triglycerides (TG)≥2.26 mmol/ L, or serum total cholesterol (TC)≥6.21 mmol/L.
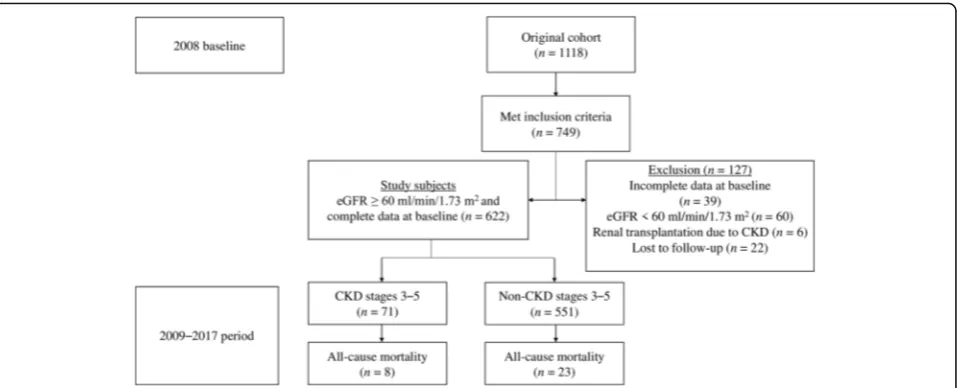
Of the 749 eligible patients who met the inclusion criteria, 105 were excluded (60 had eGFR < 60 mL/min/1.73 m2, 6 were renal transplant recipients, and 39 had missing data on baseline serum creatinine (SCr), TG, or HbA1c levels) (Fig. 1). The eGFR was repeatedly assessed for each patient every 3 months from baseline to December 12, 2017. Twenty-two patients had not undergone a re-peat SCr measurement during the follow-up period; they were considered to have been lost to follow-up and thus were excluded from the final analysis. A total of 622 patients with eGFR ≥60 mL/min/1.73 m2 were finally enrolled in this study.
Definitions
BMI was calculated as weight (kg) divided by height (m2). Obesity was defined as BMI ≥30 kg/m2. Patients receiving antihypertensive medications were considered as having HTN. Similarly, patients with dyslipidemia were those taking lipid-lowering medications, and pa-tients with DM were those receiving antidiabetic medi-cations. Smoking history was positive if there was a current or any history of smoking tobacco. Patients were considered to have vascular disease if they had a diagno-sis of coronary heart disease (angina, prior myocardial infarction, angioplasty of the coronary arteries, or coron-ary artery surgery), cerebrovascular accident, or periph-eral arterial disease. All-cause mortality was defined as death from any cause.
Outcomes
In this study, CKD stages 3–5 were defined as eGFR < 60 mL/min/1.73 m2 for ≥3 months [8]. eGFR was calcu-lated using the CKD Epidemiology Collaboration (CKD-EPI) creatinine equation [11]. All deaths were confirmed through review of hospital records and death certificate data. Non-CKD death, including death from CVD, can-cers, and other causes, was classified as competing events.
Baseline and follow-up laboratory tests were per-formed at Tawam Hospital’s Medical Laboratory Department. The Synchron Clinical System (UniCel DxC-800; Beckman Coulter, Inc., Fullerton, CA) was used to measure fasting lipid profile and SCr level by standard methods, while HbA1c levels were assessed using the automated analyzer Integra 400 Plus (Roche Diagnostics, Mannheim, Germany). The recommended manufacturer’s reference intervals for SCr level were 53– 115μmol/L and 58–96μmol/L for men and women, respectively.
Statistical analyses
The baseline clinical variables and demographic data re-corded in the patients’ EMRs and retrieved for analysis were age; sex; history of DM, HTN, dyslipidemia, smok-ing, and CVD; SBP; DBP; BMI; TC; TG; HbA1c; and eGFR. The baseline characteristics of patients who did and did not develop CKD stages 3–5 were compared using the independent samples t-test for normally dis-tributed continuous variables, the Mann-Whitney U test for non-normally distributed continuous variables, and Fisher’s exact test (two-tailed) for categorical variables. We did not use any method of data imputation, and missing covariate and dependent variable data were ex-cluded from the analysis.
Time of follow-up for each patient was calculated from the baseline visit in 2008 to either incident CKD, death, or the last outpatient clinic visit, whichever occurred first. Considering the potential bias due to the compet-ing risk of non-CKD death, we used the Fine and Gray regression model to adjust for the risk estimates of non-CKD death as a competing risk [12]. The unadjusted cumulative incidence function in the presence of com-peting risk events was examined to compare the prob-ability of failure over the follow-up period across eGFR categories (i.e., 60–89 mL/min/1.73 m2, 90–99 mL/min/ 1.73 m2, and≥100 mL/min/1.73 m2).
Using the cmprsk package in R software [13], we con-structed the prediction model with the following steps. First, univariate Fine and Gray regression models were used on all 14 candidate variables. Variables with a stat-istical significance of the estimated regression coeffi-cients of P> 0.2 were removed. Second, all significant variables were included to develop the multivariate model. Third, we constructed two CKD risk prediction
models: one based on all remaining variables and the other using backward-stepwise selection. For each model, sub-distribution hazard ratios (SHRs) and 95% confidence intervals (95% CIs) were calculated to estimate the relative risk. The proportional hazards assumption was assessed by examining plots of the scaled Schoenfeld residuals against time failure for the predictors. Multicollinearity was evaluated by examining tolerance.
Moreover, two important components of predictive accuracy, i.e., discrimination and calibration, were used to evaluate the performance of the models [14]. The evaluation was performed using the package survival [15] and package ggplot2 in R [16]. Time-dependent area under the receiver operating characteristic curve (AUC) was employed to assess and compare the discrim-inative ability of the two models [17, 18]. Larger AUC values indicate better overall performance. An AUC of 0.5 indicates no predictive ability, whereas a value of 1 represents perfect predictive ability. The calibration plot, which is obtained using cross-validation method, was used to compare the predicted probability with the ob-served probability in both models. Internal validation of predictive accuracy was performed by applying a cross-validation approach using 1000 splits of the data into training and validation set. The prediction model with good performance was implemented into a nomogram using the mstate package and rms package in R [19,20].
All statistical analyses and data manipulations were per-formed using R software version 3.5.2 (The R Foundation, Vienna, Austria) and IBM®SPSS® software, version 25 (IBM Corporation, Armonk, NY, USA). AllPvalues were two-tailed, and P values < 0.05 were considered statisti-cally significant.
Results
Baseline characteristics and follow-up
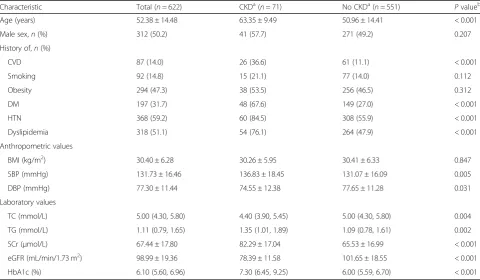
Table 1 presents the baseline characteristics of the co-hort and compares these characteristics according to the development of CKD stages 3–5 event. In our cohort of 622 patients, 71 (11.4%) had newly developed CKD stages 3–5 over a median follow-up (interquartile range) of 96 months (86–103 months). During the study period, 31 (5.0%) patients died (Fig. 1). The annual all-cause mortality rate over the study period was 6.2 per 1000 individuals (95% CI, 4.4–8.7) per year. The mean age in this study population was 52.38 ± 14.48 years, and half were men. Approximately 60% of patients had hyperten-sion, and almost half of the cohort had obesity. Around one third had DM and 14% had a history of CVD at baseline. The mean eGFR of the cohort was 98.99 ± 19.36 mL/min/1.73 m2. Moreover, patients with CKD stages 3–5 event were older at baseline; more frequently had a his-tory of CVD, DM, HTN, and dyslipidemia; and had a higher SBP, TG, and HbA1c, but had a lower DBP, TC, and eGFR, than patients without CKD stages 3–5 event.
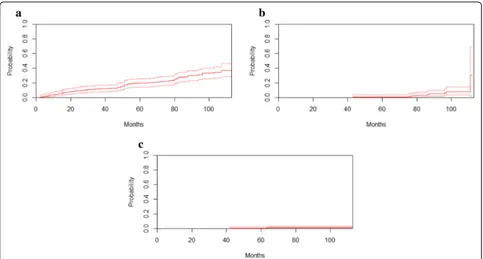
Baseline eGFR was found to be a strong predictor of the development of CKD stages 3–5. After 8 years of fol-low-up, the unadjusted cumulative probability of
developing CKD stages 3–5 in the presence of com-peting death events was 33.0% (95% CI, 25.9–40.2%), 7.8% (95% CI, 3.5–14.3%), and 1.1% (95% CI, 0.3– 3.0%) for patients with a baseline eGFR between 60 and 89 mL/min/1.73 m2, between 90 and 99 mL/min/ 1.73 m2, and≥100 mL/min/1.73 m2, respectively (Fig.2).
CKD risk prediction models
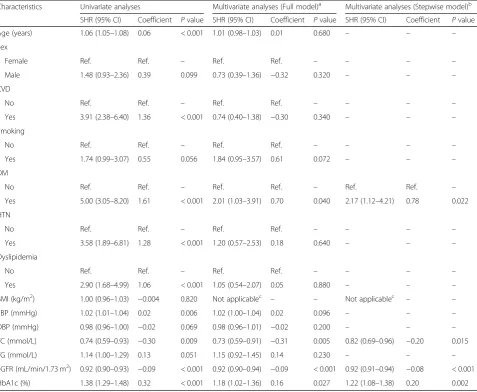
Univariate analyses, adjusted for competing risk events, were used to regress the sub-distribution hazard of inci-dent CKD stages 3–5 on all 14 candidate variables. All variables, except for BMI, that were significant in the univariate analysis (P≤0.2) were entered into the multi-variate prediction model; four variables were retained after backward-stepwise selection (Table 2). The scatter plots of the scaled Schoenfeld residuals against time fail-ure revealed no substantial deviation from the propor-tional hazard assumption. In addition, tolerance ranged from 0.50 to 0.83, indicating an absence of multicolli-nearity. In the multivariate prediction model, after step-wise selection, a greater risk of incident CKD stages 3–5 was associated with history of DM, lower TC, lower eGFR, and increasing HbA1c level.
Table 1Comparison of baseline characteristics according to the development of CKD stages 3–5
Characteristic Total (n= 622) CKDa(n= 71) No CKDa(n= 551) Pvalueb
Age (years) 52.38 ± 14.48 63.35 ± 9.49 50.96 ± 14.41 < 0.001
Male sex,n(%) 312 (50.2) 41 (57.7) 271 (49.2) 0.207
History of,n(%)
CVD 87 (14.0) 26 (36.6) 61 (11.1) < 0.001
Smoking 92 (14.8) 15 (21.1) 77 (14.0) 0.112
Obesity 294 (47.3) 38 (53.5) 256 (46.5) 0.312
DM 197 (31.7) 48 (67.6) 149 (27.0) < 0.001
HTN 368 (59.2) 60 (84.5) 308 (55.9) < 0.001
Dyslipidemia 318 (51.1) 54 (76.1) 264 (47.9) < 0.001
Anthropometric values
BMI (kg/m2) 30.40 ± 6.28 30.26 ± 5.95 30.41 ± 6.33 0.847
SBP (mmHg) 131.73 ± 16.46 136.83 ± 18.45 131.07 ± 16.09 0.005
DBP (mmHg) 77.30 ± 11.44 74.55 ± 12.38 77.65 ± 11.28 0.031
Laboratory values
TC (mmol/L) 5.00 (4.30, 5.80) 4.40 (3.90, 5.45) 5.00 (4.30, 5.80) 0.004
TG (mmol/L) 1.11 (0.79, 1.65) 1.35 (1.01, 1.89) 1.09 (0.78, 1.61) 0.002
SCr (μmol/L) 67.44 ± 17.80 82.29 ± 17.04 65.53 ± 16.99 < 0.001
eGFR (mL/min/1.73 m2) 98.99 ± 19.36 78.39 ± 11.58 101.65 ± 18.55 < 0.001
HbA1c (%) 6.10 (5.60, 6.96) 7.30 (6.45, 9.25) 6.00 (5.59, 6.70) < 0.001
CVDcardiovascular disease,DMdiabetes mellitus,HTNhypertension,BMIbody mass index,eGFRestimated glomerular filtration rate,SBPsystolic blood pressure,
DBPdiastolic blood pressure,SCrserum creatinine,TCtotal cholesterol,TGtriglycerides,HbA1cglycosylated hemoglobin A1C Data are reported as mean ± standard deviation or percent or median (1st, 3rd quartile)
a
Chronic kidney disease stages 3–5
b
Independent samples t-test was used to calculatePvalues for continuous variables and Fisher’s exact test (two-tailed) for categorical variables. The Mann-Whitney U-test was used to compare the median values of TC, TG, and HbA1c
Calibration, discrimination, and internal validation
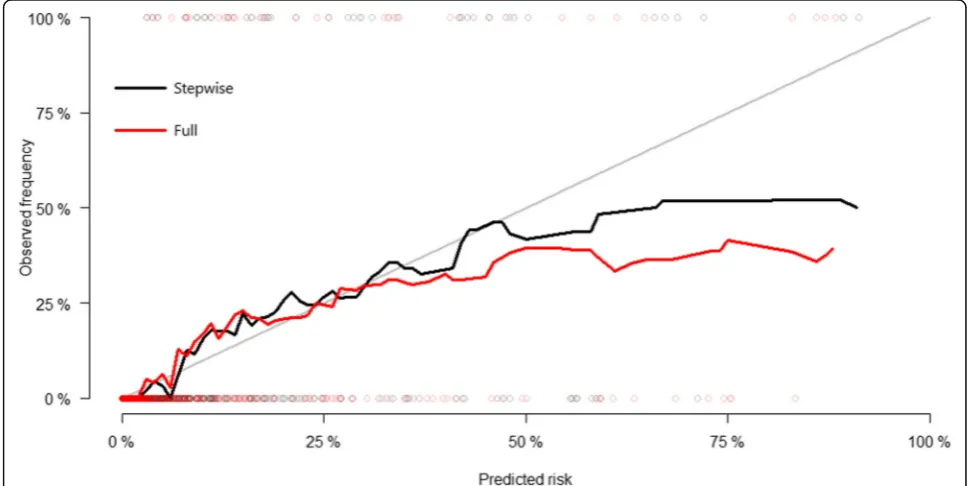
Following internal validation by cross-validation, the multivariate model after stepwise selection performed better in terms of discrimination and calibration than the multivariate model with all variables included. Time-dependent AUC at 5 years was 0.918 (95% CI, 0.846– 0.964) in the multivariate model after stepwise selection and 0.904 (95% CI, 0.853–0.945) in the full multivariate model. Thus, the time-dependent AUC values of the multivariate model after stepwise selection were better than those of the full multivariate model (Fig. 3). The calibration plots comparing actual risk and predicted risk suggested underestimation in the lower risk group and overestimation in the higher risk group in both models (Fig.4).
Nomogram
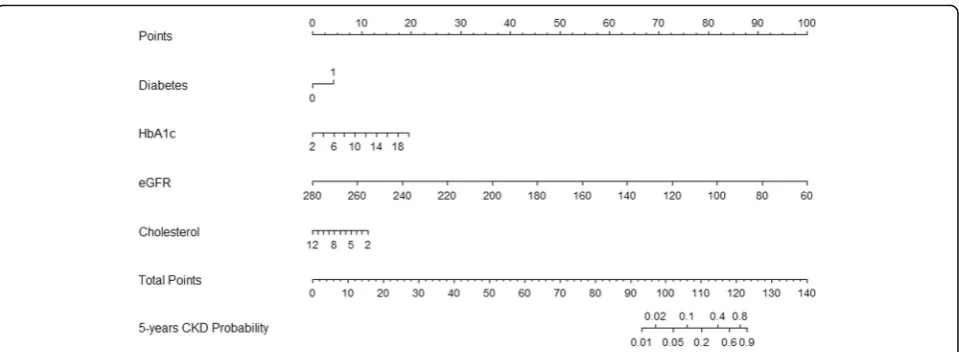
Multivariate Fine and Gray regression model after back-ward-stepwise selection analysis was selected to build the final prediction model, which identified eGFR, DM, TC, and HbA1c as predictors of incident CKD. A prob-ability nomogram for predicting CKD stages 3–5 within 5 years was constructed using the regression coefficients from the model (Fig.5). To read the nomogram, a verti-cal line is drawn up to the points’ axis, and points are assigned for each predictor. The total points are added up, and a vertical line is drawn from the total points’axis down to the5-Years CKD Probability axis, which yields
the patient’s overall risk of developing CKD stages 3–5 within 5 years.
The nomogram could be applied in the clinical setting (Additional file 1). For example, a patient with a history of DM, HbA1c of 9%, TC of 3 mmol/L, and eGFR of 65 mL/min/1.73 m2 would receive 4 points for the DM, 7.5 points for the HbA1c, 10 points for the TC, and 97.5 points for the eGFR (total = 119 points). The pa-tient’s corresponding probability for developing CKD stages 3–5 at 5 years would be 65%.
Discussion
In this adult outpatient cohort with preserved kidney function, the incidence of developing CKD stages 3–5 was approximately 1.4% per year. This finding was lower than the 2–4% per year that was reported in a recent systematic review that investigated CKD incidence among individuals with diabetes from 30 different coun-tries [21]. The difference in the incidence was expected because the proportion of patients with diabetes was higher in the studies examined in the systematic review than in our cohort. Our study also demonstrated that among the traditional CVD risk factors, baseline eGFR, HbA1c, TC, and history of DM are strong predictors of CKD stages 3–5. Specifically, baseline eGFR is an im-portant predictor of the development of these disease stages in both the general and high-risk population, such as patients with DM [21–25]. A decrease in GFR below Fig. 2Estimated cumulative incidence curves for CKD stages 3–5. Unadjusted estimated cumulative incidence curves (solid lines) for CKD stages 3–5 in the presence of death as a competing event according to eGFR groups with 95% pointwise CIs (broken lines).aeGFR, 60–89 mL/min/1.73 m2
a critical level results in a vicious cycle of worsening kid-ney function that contributes to HTN, which in turn perpetuates further nephron loss [2].
Several studies have shown that older age, DM, smoking, obesity, dyslipidemia, and HTN are independent risk fac-tors for developing CKD stages 3–5 [22,26–32]. From the age of 50 years, the lifetime risk of developing incident CKD is approximately 40% and could be even higher in the presence of additional risk factors, such as obesity, high blood pressure, or diabetes [33]. Interestingly, in our cohort of patients at risk of CVD, DM and baseline eGFR were the main predictors of CKD stages 3–5. Previous studies sug-gested that high-risk patients are more likely to die from CVD than develop kidney failure [7,34,35]; hence, survival bias may play a role in the lack of statistical significance of
other risk factors in our study cohort. Nevertheless, the competing risk of death was accounted for in our study. Furthermore, DM has been shown to accelerate the pro-gression of kidney function decline (2.1 and 2.7 mL/min/ 1.73 m2/year, respectively, for women and men with DM) [36] compared with essential HTN only (0.95 mL/min/year) [37] or with older age (0.75–1 mL/min/1.73 m2/year) [38]. Thus, factors that have a greater influence on kidney func-tion may also increase the risk of premature death and therefore are important predictors of kidney failure. Our study also noted an inverse relationship between low chol-esterol levels and incident CKD. This paradoxical finding could be explained by the confounding effects of malnutri-tion and chronic inflammamalnutri-tion that are common in patients with CKD and end-stage renal disease [39].
Table 2Univariate and multivariate Fine and Gray competing risk regression analyses
Characteristics Univariate analyses Multivariate analyses (Full model)a Multivariate analyses (Stepwise model)b
SHR (95% CI) Coefficient Pvalue SHR (95% CI) Coefficient Pvalue SHR (95% CI) Coefficient Pvalue
Age (years) 1.06 (1.05–1.08) 0.06 < 0.001 1.01 (0.98–1.03) 0.01 0.680 – – –
Sex
Female Ref. Ref. – Ref. Ref. – – – –
Male 1.48 (0.93–2.36) 0.39 0.099 0.73 (0.39–1.36) −0.32 0.320 – – –
CVD
No Ref. Ref. – Ref. Ref. – – – –
Yes 3.91 (2.38–6.40) 1.36 < 0.001 0.74 (0.40–1.38) −0.30 0.340 – – –
Smoking
No Ref. Ref. – Ref. Ref. – – – –
Yes 1.74 (0.99–3.07) 0.55 0.056 1.84 (0.95–3.57) 0.61 0.072 – – –
DM
No Ref. Ref. – Ref. Ref. – Ref. Ref. –
Yes 5.00 (3.05–8.20) 1.61 < 0.001 2.01 (1.03–3.91) 0.70 0.040 2.17 (1.12–4.21) 0.78 0.022
HTN
No Ref. Ref. – Ref. Ref. – – – –
Yes 3.58 (1.89–6.81) 1.28 < 0.001 1.20 (0.57–2.53) 0.18 0.640 – – –
Dyslipidemia
No Ref. Ref. – Ref. Ref. – – – –
Yes 2.90 (1.68–4.99) 1.06 < 0.001 1.05 (0.54–2.07) 0.05 0.880 – – –
BMI (kg/m2) 1.00 (0.96–1.03) −0.004 0.820 Not applicablec – – Not applicablec – –
SBP (mmHg) 1.02 (1.01–1.04) 0.02 0.006 1.02 (1.00–1.04) 0.02 0.096 – – –
DBP (mmHg) 0.98 (0.96–1.00) −0.02 0.069 0.98 (0.96–1.01) −0.02 0.200 – – –
TC (mmol/L) 0.74 (0.59–0.93) −0.30 0.009 0.73 (0.59–0.91) −0.31 0.005 0.82 (0.69–0.96) −0.20 0.015
TG (mmol/L) 1.14 (1.00–1.29) 0.13 0.051 1.15 (0.92–1.45) 0.14 0.230 – – –
eGFR (mL/min/1.73 m2) 0.92 (0.90–0.93) −0.09 < 0.001 0.92 (0.90–0.94) −0.09 < 0.001 0.92 (0.91–0.94) −0.08 < 0.001
HbA1c (%) 1.38 (1.29–1.48) 0.32 < 0.001 1.18 (1.02–1.36) 0.16 0.027 1.22 (1.08–1.38) 0.20 0.002
CVDcardiovascular disease,DMdiabetes mellitus,HTNhypertension,BMIbody mass index,eGFRestimated glomerular filtration rate,SBPsystolic blood pressure,
DBPdiastolic blood pressure,SCrserum creatinine,TCtotal cholesterol,TGtriglycerides,HbA1cglycosylated hemoglobin A1C,SHRsub-distribution hazard ratio,CI confidence interval
a
Sub-distribution hazards model, adjusted for all predictors in the final model with all variables included
b
Sub-distribution hazards model, adjusted for all predictors in the final model selected using backward-stepwise selection
cP
value > 0.2 in the initial univariate analyses and not included in the multivariate analyses
Identification and risk stratification of CVD patients at risk of developing CKD stages 3–5 are important issues in clinical practice, particularly in outpatient clinics that provide care to patients with multiple vascular comor-bidities. Furthermore, active detection of CKD risk and
early treatment of risk factors may avoid complications associated with the subsequent CKD stages [33]. How-ever, only a few studies have focused on predicting the risk of developing CKD stages 3–5 in patients at risk of CVD [40], and currently, the models developed to Fig. 3Time-dependent AUC for CKD stages 3–5 risk prediction modelsAUCarea under the curve,CKDchronic kidney disease
predict incident CKD require detailed laboratory and clinical information [30,41]. In our study, we propose a simple and practical nomogram, which is based on four easily available clinical variables (i.e., HbA1c, DM, TC, and eGFR), to predict the incidence of CKD stages 3–5. This nomogram may help busy physicians triage high-risk patients toward more intensive testing and identify those who need early referral to a nephrologist.
One of the strengths of this study is that the diagnosis of CKD stages 3–5 was based on two consecutive read-ings of eGFR < 60 mL/min/1.73 m2, which were obtained
≥3 months apart. This could help account for intra-indi-vidual variability in eGFR and lead to a more accurate representation of kidney function. In addition, we used the CKD-EPI equation to define the outcome, which is more accurate than the Modification of Diet in Renal Disease Study equation according to most studies [11, 42–44]. Moreover, this study used documented anthropometric and laboratory measurements rather than self-reported information for both predictor variables and outcomes. Finally, standard receiver operating charac-teristic curve analysis assesses the predictive ability of a model within a fixed time horizon. In our study, we used time-dependent AUC analysis to assess the predictive accuracy of the nomogram at different time horizons.
This study has several limitations. First, other risk factors, such as albuminuria, were not explored. A number of stud-ies have described the significance of albuminuria in pre-dicting the development of kidney failure [30,41, 45–47]; however, non-nephrologist physicians in the UAE reported that albuminuria is not routinely measured in their practice, and nearly 80% of physicians use eGFR alone as a screening tool for CKD [48]. Second, our sample size was modest compared to that in other studies. Finally, although the pre-dictive power of the nomogram developed was thoroughly tested with internal validation, its applicability among a
non-UAE patient population at risk of CVD remains to be investigated.
Conclusions
This study demonstrated that in patients at high cardio-vascular risk, eGFR, HbA1c, TC, and a history of DM are significant predictors of CKD stages 3–5. A simple and practical nomogram with good accuracy was constructed for predicting 5-year risk of developing CKD stages 3–5 based on competing risk model among patients with vas-cular comorbidities. This user-friendly risk prediction tool could help healthcare providers make better-informed decisions regarding CKD prevention and management in at-risk patients.
Additional files
Additional file 1:Nomogram to predict the development of chronic kidney disease stages 3–5 at 5 years with a worked example. Instruction for use: locate a patient characteristic, such as history of diabetes, HbA1c, eGFR, and cholesterol levels, on the corresponding axis to determine the points the patient receives for each characteristic. Add the points of each characteristic and locate the sum on the total points axis. Draw a line straight down to identify the patient’s probability of developing CKD stages 3–5 at 5 years.HbA1cglycosylated hemoglobin A1c,eGFR estimated glomerular filtration rate. (TIF 60 kb)
Additional file 2:Use of estimated glomerular filtration rate to predict incident chronic kidney disease in patients at risk of cardiovascular disease: a retrospective study dataset.ID
identification,DMdiabetes mellitus,HbA1cglycosylated hemoglobin A1C,CVDcardiovascular disease,HTNhypertension,SBPsystolic blood pressure,DBPdiastolic blood pressure,BMIbody mass index,
eGFRestimated glomerular filtration rate,CKDchronic kidney disease. (XLSX 54 kb)
Abbreviations
AUC:Area under the curve; BMI: Body mass index; CI: Confidence interval; CKD: Chronic kidney disease;; CKD-EPI: CKD Epidemiology Collaboration; CVD: Cardiovascular disease; DBP: Diastolic blood pressure; DM: Diabetes mellitus; eGFR: Estimated glomerular filtration rate; EMR: Electronic medical record; HbA1c: Glycosylated hemoglobin A1C; HTN: Hypertension;
Fig. 5Nomogram to predict the development of CKD stages 3–5 at 5 yearsHbA1cglycosylated hemoglobin A1c,eGFRestimated glomerular filtration rate,CKDchronic kidney disease
SBP: Systolic blood pressure; SCr: Serum creatinine; SHR: sub-distribution hazard ratio; TC: Total cholesterol; TG: Triglycerides; UAE: United Arab Emirates
Acknowledgments Not applicable.
Authors’contributions
Conception and design of the study: SA, AO, DR, RDG. Data collection: SA. Statistical analysis: AO, SA. Analysis and interpretation of data: SA, AO. Drafting of the manuscript: SA, AO. Critical review of the manuscript: SA, DR, RDG. All authors have read and approved the final version of the manuscript.
Funding
This work was supported by the College of Medicine and Health Sciences, United Arab Emirates University (grant number 31 M325). The funders had no role in the study design, data collection and analysis, decision to publish, or preparation of the manuscript.
Availability of data and materials
The dataset supporting the conclusions of this article is included within the article and its Additional file2.
Ethics approval and consent to participate
The study protocol was approved by Tawam Hospital and the United Arab Emirates University research and ethics board (IRR536/17). The requirement for informed consent was waived because patient records and information were anonymized and de-identified prior to analysis.
Consent for publication Not applicable.
Competing interests
The authors declare that they have no competing interests.
Author details
1Department of Internal Medicine, College of Medicine and Health Sciences, United Arab Emirates University, Al Ain, United Arab Emirates.2Institute of Public Health, College of Medicine and Health Sciences, United Arab Emirates University, Al Ain, United Arab Emirates.3Department of Family Medicine, College of Medicine and Health Sciences, United Arab Emirates University, Al Ain, United Arab Emirates.
Received: 1 February 2019 Accepted: 26 July 2019
References
1. World Health Organization. The top 10 causes of death.http://www.who. int/mediacentre/factsheets/fs310/en/. Accessed 21 March 2018. 2. Taal MW, Brenner BM. Predicting initiation and progression of chronic
kidney disease: developing renal risk scores. Kidney Int. 2006;70:1694–705. 3. Cases Amenós A, González-Juanatey JR, Conthe Gutiérrez P, Matalí Gilarranz
A, Garrido Costa C. Prevalence of chronic kidney disease in patients with or at a high risk of cardiovascular disease. Rev Esp Cardiol. 2010;63:225–8. 4. Hill NR, Fatoba ST, Oke JL, Hirst JA, O’Callaghan CA, Lasserson DS, et al. Global
prevalence of chronic kidney disease–a systematic review and meta-analysis. PLoS One. 2016;11.https://doi.org/10.1371/journal.pone.0158765.
5. World Health Organization. Noncommunicable diseases.http://www.who. int/mediacentre/factsheets/fs355/en/. Accessed 23 March 2018.
6. Atkins RC. The epidemiology of chronic kidney disease. Kidney Int. 2005;67: S14–8.https://doi.org/10.1111/j.1523-1755.2005.09403.x.
7. Go AS, Chertow GM, Fan D, McCulloch CE, Hsu C. Chronic kidney disease and the risks of death, cardiovascular events, and hospitalization. N Engl J Med. 2004;351:1296–305.
8. The kidney disease: improving global outcomes (KDIGO) 2012. Clinical practice guideline for the evaluation and Management of Chronic Kidney Disease.https://kdigo.org/wp-content/uploads/2017/02/KDIGO_2012_CKD_ GL.pdf. Published January 2013. Accessed 21 March 2018.
9. Al-Shamsi S, Regmi D, Govender RD. Chronic kidney disease in patients at high risk of cardiovascular disease in the United Arab Emirates: a population-based study. PLoS One. 2018;13:e0199920.
10. Statistics Centre Abu Dhabi. Population and demographic estimates for the Emirate of Abu Dhabi.https://www.scad.ae/Release%20Documents/SYB_201 7_EN.PDF. Published July 2017. Accessed 21 March 2018.
11. Levey AS, Stevens LA, Schmid CH, Zhang YL, Castro AF, Feldman HI, et al. A new equation to estimate glomerular filtration rate. Ann Intern Med. 2009;150:604–12. 12. Fine JP, Gray RJ. A proportional hazards model for the subdistribution of a
competing risk. J Am Stat Assoc. 1999;94:496–509.
13. Gray B. cmprsk: subdistribution analysis of competing risks. 2014.
https://CRAN.R-project.org/package=cmprsk. Accessed 4 Jan 2019. 14. Harrell FE. Regression modeling strategies. New York, NY: Springer New
York; 2001.https://doi.org/10.1007/978-1-4757-3462-1.
15. Therneau T. A package for survival analysis in S. version 2.43–3. 2015.
https://CRAN.R-project.org/package=survival. Accessed 4 Jan 2019. 16. Wickham H, Chang W, Henry L, Pedersen TL, Takahashi K, Wilke C, et al.
ggplot2: create elegant data visualisations using the grammar of graphics. 2018.https://CRAN.R-project.org/package=ggplot2. Accessed 4 Jan 2019. 17. Heagerty PJ, Lumley T, Pepe MS. Time-dependent ROC curves for censored
survival data and a diagnostic marker. Biometrics. 2000;56:337–44. 18. Zheng Y, Cai T, Feng Z. Application of the time-dependent ROC curves for
prognostic accuracy with multiple biomarkers. Biometrics. 2006;62:279–87. 19. de Wreede LC, Fiocco M, putter H. mstate: an R package for the analysis of
competing risks and multi-state models. J Stat Soft 2011;38:1–30.
http://www.jstatsoft.org/v38/i07/. Accessed 4 Jan 2019.
20. Harrell FE. rms: regression modeling strategies. 2018.https://CRAN.R-project. org/package=rms. Accessed 4 Jan 2019.
21. Koye DN, Shaw JE, Reid CM, Atkins RC, Reutens AT, Magliano DJ. Incidence of chronic kidney disease among people with diabetes: a systematic review of observational studies. Diabet Med. 2017;34:887–901.
22. Tohidi M, Hasheminia M, Mohebi R, Khalili D, Hosseinpanah F, Yazdani B, et al. Incidence of chronic kidney disease and its risk factors, results of over 10 year follow up in an Iranian cohort. PLoS One. 2012;7.https://doi.org/10.13 71/journal.pone.0045304.
23. De Cosmo S, Viazzi F, Pacilli A, Giorda C, Ceriello A, Gentile S, et al. Predictors of chronic kidney disease in type 2 diabetes. Medicine. 2016;95.
https://doi.org/10.1097/MD.0000000000004007.
24. Gansevoort RT, Matsushita K, van der Velde M, Astor BC, Woodward M, Levey AS, et al. Lower estimated GFR and higher albuminuria are associated with adverse kidney outcomes. A collaborative meta-analysis of general and high-risk population cohorts. Kidney Int. 2011;80:93–104.
25. Koraishy FM, Hooks-Anderson D, Salas J, Rauchman M, Scherrer JF. Fast GFR decline and progression to CKD among primary care patients with preserved GFR. Int Urol Nephrol. 2018;50:501–8.
26. Hooi LS, Ong LM, Ahmad G, Bavanandan S, Ahmad NA, Naidu BM, et al. A population-based study measuring the prevalence of chronic kidney disease among adults in West Malaysia. Kidney Int. 2013;84:1034–40.
27. Muntner P, Coresh J, Smith JC, Eckfeldt J, Klag MJ. Plasma lipids and risk of developing renal dysfunction: the atherosclerosis risk in communities study. Kidney Int. 2000;58:293–301.
28. Fox CS, Larson MG, Leip EP, Culleton B, Wilson PWF, Levy D. Predictors of new-onset kidney disease in a community-based population. JAMA. 2004; 291:844–50.
29. Yamagata K, Ishida K, Sairenchi T, Takahashi H, Ohba S, Shiigai T, et al. Risk factors for chronic kidney disease in a community-based population: a 10-year follow-up study. Kidney Int. 2007;71:159–66.
30. Salinero-Fort MA, San Andrés-Rebollo FJ, de Burgos-Lunar C, Gómez-Campelo P, Chico-Moraleja RM, López de Andrés A, et al. Five-year incidence of chronic kidney disease (stage 3-5) and associated risk factors in a Spanish cohort: the MADIABETES study. PLoS One. 2015;10:e0122030. 31. Bash LD, Selvin E, Steffes M, Coresh J, Astor BC. Poor glycemic control in
diabetes and the risk of incident chronic kidney disease even in the absence of albuminuria and retinopathy: atherosclerosis risk in communities (ARIC) study. Arch Intern Med. 2008;168:2440–7.
32. Nenov VD, Taal MW, Sakharova OV, Brenner BM. Multi-hit nature of chronic renal disease. Curr Opin Nephrol Hypertens. 2000;9:85–97.
33. McMahon GM, Hwang S-J, Fox CS. Residual lifetime risk of chronic kidney disease. Nephrol Dial Transplant. 2017;32:1705–9.
34. Dalrymple LS, Katz R, Kestenbaum B, Shlipak MG, Sarnak MJ, Stehman-Breen C, et al. Chronic kidney disease and the risk of end-stage renal disease versus death. J Gen Intern Med. 2011;26:379–85.
associated with all-cause and cardiovascular mortality. A collaborative meta-analysis of high-risk population cohorts. Kidney Int. 2011;79:1341–52. 36. Hemmelgarn BR, Zhang J, Manns BJ, Tonelli M, Larsen E, Ghali WA, et al.
Progression of kidney dysfunction in the community-dwelling elderly. Kidney Int. 2006;69:2155–61.
37. Eriksen BO, Stefansson VTN, Jenssen TG, Mathisen UD, Schei J, Solbu MD, et al. Blood pressure and age-related GFR decline in the general population. BMC Nephrol. 2017;18.https://doi.org/10.1186/s12882-017-0496-7. 38. Stevens LA, Coresh J, Greene T, Levey AS. Assessing kidney
function--measured and estimated glomerular filtration rate. N Engl J Med. 2006;354: 2473–83.
39. Liu Y, Coresh J, Eustace JA, Longenecker JC, Jaar B, Fink NE, et al. Association between cholesterol level and mortality in dialysis patients: role of inflammation and malnutrition. JAMA. 2004;291:451–9.
40. Echouffo-Tcheugui JB, Kengne AP. Risk models to predict chronic kidney disease and its progression: a systematic review. PLoS Med. 2012;9:e1001344. 41. Bang H, Vupputuri S, Shoham DA, Klemmer PJ, Falk RJ, Mazumdar M, et al. SCreening for occult REnal disease (SCORED): a simple prediction model for chronic kidney disease. Arch Intern Med. 2007;167:374–81.
42. Michels WM, Grootendorst DC, Verduijn M, Elliott EG, Dekker FW, Krediet RT. Performance of the Cockcroft-gault, MDRD, and new CKD-EPI formulas in relation to GFR, age, and body size. Clin J Am Soc Nephrol. 2010;5:1003–9. 43. Matsushita K, Mahmoodi BK, Woodward M, Emberson JR, Jafar TH, Jee SH, et al. Comparison of risk prediction using the CKD-EPI equation and the MDRD study equation for estimated glomerular filtration rate. JAMA. 2012;307:1941–51.
44. Jessani S, Levey AS, Bux R, Inker LA, Islam M, Chaturvedi N, et al. Estimation of GFR in south Asians: a study from the general population in Pakistan. Am J Kidney Dis. 2014;63:49–58.https://doi.org/10.1053/j.ajkd.2013.07.023. 45. Hoefield RA, Kalra PA, Baker PG, Sousa I, Diggle PJ, Gibson MJ, et al. The use
of eGFR and ACR to predict decline in renal function in people with diabetes. Nephrol Dial Transplant. 2011;26:887–92.
46. Low S, Lim SC, Zhang X, Zhou S, Yeoh LY, Liu YL, et al. Development and validation of a predictive model for chronic kidney disease progression in type 2 diabetes mellitus based on a 13-year study in Singapore. Diabetes Res Clin Pract. 2017;123:49–54.
47. Berhane AM, Weil EJ, Knowler WC, Nelson RG, Hanson RL. Albuminuria and estimated glomerular filtration rate as predictors of diabetic end-stage renal disease and death. Clin J Am Soc Nephrol. 2011;6:2444–51.
48. Al Shamsi S, Al Dhanhani A, Sheek-Hussein MM, Bakoush O. Provision of care for chronic kidney disease by non-nephrologists in a developing nation: a national survey. BMJ Open. 2016;6:e010832.
Publisher’s Note
Springer Nature remains neutral with regard to jurisdictional claims in published maps and institutional affiliations.