R E S E A R C H
Open Access
Gene expression profiling reveals distinct features
of various porcine adipose tissues
Chaowei Zhou, Jie Zhang, Jideng Ma, Anan Jiang, Guoqing Tang, Miaomiao Mai, Li Zhu, Lin Bai,
Mingzhou Li
*and Xuewei Li
*Abstract
Background:The excessive accumulation of body fat is a major risk factor to develop a variety of metabolic diseases. To investigate the systematic association between the differences in gene expression profiling and adipose deposition, we used pig as a model, and measured the gene expression profiling of six variant adipose tissues in male and females from three pig breeds which display distinct fat level.
Results:We identified various differential expressed genes among breeds, tissues and between sexes, and further used a clustering method to identify sets of functionally co-expression genes linked to different obesity-related phenotypes. Our results reveal that the subcutaneous adipose tissues mainly modulate metabolic indicators, nonetheless, the visceral adipose tissues as well as the intermuscular adipose tissue were mainly associated with the impaired inflammatory and immune response.
Conclusions:The present study provided the evidence of gene expression profiling that the subcutaneous adipose tissues are mainly affected the metabolism process, whereas the visceral and intermuscular adipose tissues should been term as the metabolic risk factors of obesity.
Keywords:Gene expression profiling, Subcutaneous adipose tissues, Visceral adipose tissues, Pig
Background
Obesity is becoming a major global health hazard mainly because of the increased ingestion of high energy food and the decreased amounts of physical activity in popula-tions. A gain in the adipose mass in the body is generally accompanied by increased risk of metabolism-related diseases. However, it is not only the amount of body fat mass, but also the distribution of adipose tissue that is now recognised as an important predictor of metabolic abnormalities.
Based on their anatomical location, adipose tissue can be divided into two major types: visceral adipose tissue (VAT) and subcutaneous adipose tissue (SAT). The VAT is a higher risk factor for obesity than SAT [1]. In par-ticular, basal free fatty acid flux, lipolysis rate, and secretory protein expression are markedly higher in vis-ceral adipocytes compared with subcutaneous adipocytes [2]. Our previous reports have provided epigenetic evi-dence that VAT is mainly associated with impaired
inflammatory and immune responses and is a metabolic risk factor of obesity, while SAT is mainly associated with metabolic processes [3,4]. In addition, ethnic group and gender are important factors that affect adipose deposition [5,6].
Pig (Sus scrofa) has been recognised as an attractive biomedical model for human because its physiology and anatomy are remarkably similar to humans and pigs are easy to breed and handle [7]. Here, we present a com-prehensive genome-wide comparison of gene expression profiling among six adipose tissues from different body sites in both sexes of three well-defined pig breeds displaying distinct adipose phenotypes. Using microarray technology, we identified various differentially expressed genes that may be related to the different adipose depos-ition phenotypes among the breeds, and between the sexes and anatomic locations. We also used a clustering method to identify sets of co-expressed genes that may be functionally linked to different obesity-related pheno-types. These results can be used to understand the dif-ferent accumulation mechanisms of the distinct adipose tissue types.
* Correspondence:[email protected];[email protected] Institute of Animal Genetics & Breeding, College of Animal Science & Technology, Sichuan Agricultural University, Ya’an, Sichuan 625000, China
Results and discussion Obesity-related phenotypes
Our previous report based on same individuals have demonstrated that the adipose volume were significant difference among adipose tissues and breeds, and be-tween sexes [3]. In addition, the 24 kinds of reprehensive metabolism indicators in serum also revealed the same ranking from the leaner Landrace, the wild Tibetan and the fatty Rongchang pigs [3].
Identification of differentially expressed (DE) genes and relatedness of adipose samples
The number of DE genes (P< 0.05, three-way repeated-measures analysis of variance [ANOVA]) was lowest be-tween male and female (1,225), higher among different adipose tissues (2,750), and highest among the different breeds (2,949), indicating significant biological differ-ences between the groups in the latter two categories (Figure 1A). To further characterise variability in the gene expression profiling, we performed a principal components analysis (PCA) based on the DE genes in each of the compared groups. The six adipose tissues clustered into two groups, VATs and SATs, which reflected their distinct functional and metabolic features (Figure 1B). Interestingly, the intermuscular adipose (IAD) tissue that is deposited between muscle bundles, clustered with the VATs in terms of gene expression
profiling, suggesting that IAD may be a potential new risk factor for obesity-related diseases, in agreement with our findings from a previous study on methylation [4].
Although the three pig breeds clustered into three groups, the Rongchang and Tibetan breeds were closer to each other than the Landrace breed (Figure 1C). These results not only reflect the marked phenotypic dif-ferences in adipose deposition among the three pig breeds which have undergone different/opposite breed-ing directions, but also highlight the deep phylogenetic split between the European (Landrace) and Asian pigs (Rongchang and Tibetan) [3].
In addition, the male and female were also been roughly distinguish (Figure 1D), which consisted with the lowest variation of gene expression profiling between sexes, which only have less than half of the amount of DE genes than among tissue types and breeds.
DE genes between the VATs and SATs
The PCA classified six adipose tissues into two groups: the VAT group which included greater omentum adipose (GOM), mesenteric adipose (MAD), retroperitoneal adipose (RAD) and IAD; and the SAT group which included upper layer of backfat (ULB) and inner layer of backfat (ILB).
We performed a pairwise comparison analysis and identi-fied 192 and 181 DE genes that were specifically up-regulated in the SAT and VAT groups, respectively (Figure 2
Figure 1Identification and the PCA of the DE genes.(A) DE genes across breeds, sexes, and tissues; Two-way PCA of (B) six adipose tissues; (C) three pig breeds; (D) sexes. L, R and T refer to the Landrace, Rongchang and Tibetan, respectively.
Zhouet al. Lipids in Health and Disease2013,12:75 Page 2 of 13
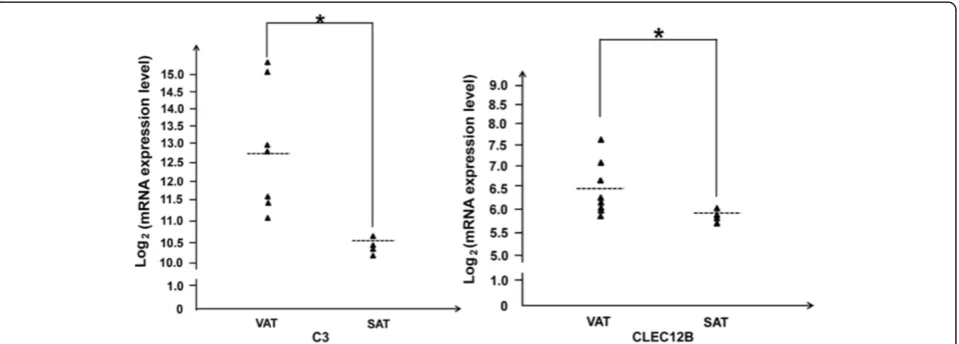
and Table 1). The DE genes which were specifically up-regulated in the VAT group were mainly enriched in the GO categories of the immune processes, including positive regulation of defence response (8 genes, P= 5.63 × 10⁻⁴), positive regulation of immune system process (10 genes, P= 1.11 × 10⁻⁴), adaptive immune response (6 genes,P= 3.54 × 10⁻⁴), innate immune response (7 genes,P= 7.86 × 10⁻⁴) and B cell mediated immunity (5 genes,P= 9.91 × 10⁻⁴) (Figure 3). Various genes known to be involved in the immune response were highly expressed in VATs compared with in SATs (P< 0.05). For example,C3 (com-plement 3), which was reported to play a central role in the activation of the complement system [8,9] was up-regulated in the VATs. CLEC12B (C-type lectin domain family 12B) limits the activity of monocyte-derived im-mune cells after cell differentiation and possibly during inflammatory diseases [10] (Figure 4). The action of these genes which were highly expressed in VATs may contrib-ute to the obesity-induced chronic inflammation in adi-pose tissue that precedes the development of insulin resistance and type II diabetes.
The DE genes that were specifically up-regulated in the SAT group were mainly enriched in the GO
categories of metabolic processes, including glucose meta-bolic process (6 genes, P= 1.16 × 10⁻²), hexose metabolic process (6 genes, P= 2.81 × 10⁻²), fatty acid metabolic process (6 genes, P= 3.15 × 10⁻²) and monosaccharide metabolic process (6 genes, P= 4.77 × 10⁻²) (Figure 3). This result is consistent with previous reports that, com-pared with the high-risk of visceral obesity caused by VATs, SATs are mainly associated with metabolic pro-cesses [4,11].
DE genes among the three pig breeds
The number of DE genes (P< 0.05, three-way repeated-measures ANOVA) was highest between the fatty Rongchang and leaner Landrace pigs (1,855), lower be-tween the wild Tibetan and Landrace pigs (1,440), and lowest between the Tibetan and Rongchang pigs (868) (Figure 2).
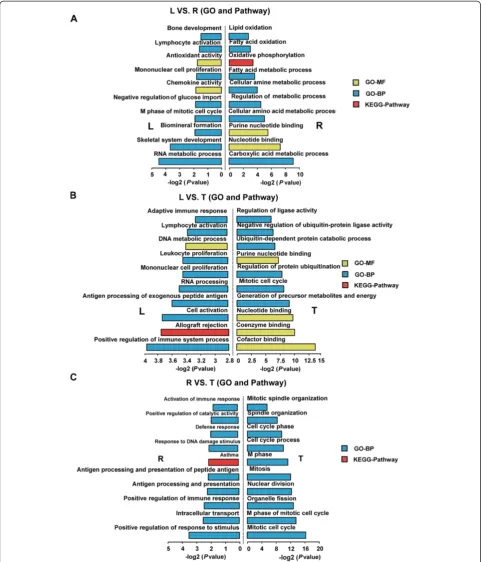
The highly expressed genes in the Landrace pigs were mainly involved in the GO and KEGG categories of skeletal system development processes and immune pro-cesses, including positive regulation of skeletal system development (7 genes, P= 2.22 × 10⁻⁴), bone develop-ment (8 genes, P= 4.16 × 10⁻²), positive regulation of immune system process (20 genes, P= 1.19 × 10⁻³) and adaptive immune response (8 genes, P= 2.39 × 10⁻²) (Figure 5). The highly expressed genes in the Rongchang pigs were mainly involved in the processes of lipid me-tabolism and immune processes, such as lipid oxidation (8 genes, P= 1.40 × 10⁻³), fatty acid oxidation (8 genes, P= 2.53 × 10⁻³), fatty acid metabolic process (21 genes, P= 4.71 × 10⁻⁴), activation of immune response (6 genes,P= 1.30 × 10⁻²) and positive regulation of immune response (8 genes, P= 5.93 × 10⁻³). This result reflects the pheno-typic divergence of adipose deposition between these two pig breeds that have undergone artificial selection for dif-ferent breeding targets. The Landrace breed is under strong artificial selection for more muscle production, while the Rongchang breed is selected for more adipose deposition.
DE genes between the sexes
Almost three-quarters of the DE genes between the sexes (879 of 1,225, 71.76%) were up-regulated in the males (Figure 2). These highly expressed genes were enriched mainly in the GO categories of the immune processes (Figure 6), including positive regulation of im-mune system process (28 genes,P= 4.49 × 10⁻⁶), adaptive immune response (11 genes, P= 1.71 × 10⁻³), humoral immune response (7 genes, P= 1.86 × 10⁻³), immuno-globulin mediated immune response (9 genes,P= 2.09 × 10⁻³), regulation of acute inflammatory response (5 genes, P= 1.15 × 10⁻²) and immune effector process (13 genes, P= 1.33 × 10⁻²). The DE genes (346 of 1,225, 28.24%), which were up-regulated in the females
Figure 2Identification of up- and down-regulated genes.L, R and
T refer to the Landrace, Rongchang and Tibetan pig, respectively. SAT: subcutaneous adipose tissue; VAT: visceral adipose tissue.
Table 1 Identification of DE genes which specifically up-regulated in SAT and VAT groups
Libraries Up-regulated genes Down-regulated genes
ULB VS. GOM 298 378
ULB VS. MAD 304 291
ULB VS. RAD 164 142
ULB VS. IAD 154 163
ILB VS. GOM 286 302
ILB VS. MAD 260 222
ILB VS. RAD 73 60
ILB VS. IAD 84 119
(Figure 2), were mainly involved in metabolic processes (Figure 6), including the coenzyme metabolic process (10 genes, P= 1.08 × 10⁻³), cofactor metabolic process (11 genes, P= 1.64 × 10⁻³), oxidoreduction coenzyme metabolic process (5 genes, P= 1.54 × 10⁻²) and organic acid biosynthetic process (8 genes, P= 1.10 × 10⁻²). This result reflects a sexual dimorphism in body fat distribu-tion [12]. Females deposit relatively more fat in subcuta-neous/inguinal depots, which has beneficial effects on the control of body weight and metabolism [13]; on the other hand, males tend to deposit more fat in intra-abdominal/gonadal depots, which has been found to be related to risk for a number of diseases [14].
Interestingly, we identified some genes that potentially contribute to the sexual differences in obesity develop-ment. Compared with the females, the males exhibited higher expression levels of RXFP2 (P =1.19 × 10⁻¹³) and
CPB1 (P= 5.69 × 10⁻⁶) (Figure 7), which have been related to gubernaculum testis development and sperm-atogenesis [15,16]. However, compared with the males, the females exhibited higher expression levels of PAEP (P= 3.71 × 10⁻⁵) and FABP7 (P= 8.42 × 10⁻⁹) (Figure 7), which have been associated mainly with the secretory endometrial glands and breast cancer [17,18].
Validation of gene expression changes by Q-PCR
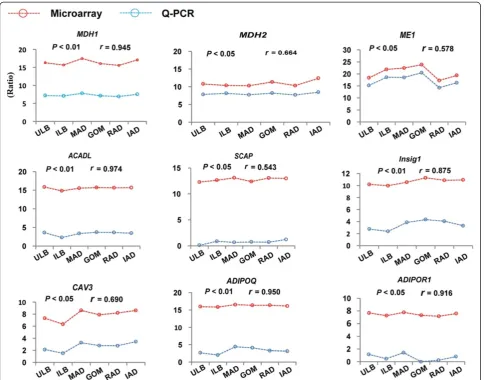
The expression changes of nine genes that are well-known to be related to adipose metabolism (ACADL, ADIPOQ, ADIPOR 1, CAV 3, MDH 1, MDH 2, ME 1, Insig 1 and SCAP) showed significant positive correla-tions between the Q-PCR results and their expressions determined by microarray (P< 0.05, Figure 8), which highlighted the high confidence of the results from the microarray approach.
Figure 3Top ten GO (Gene Ontology) terms enriched for the up- and down-regulated genes between the SATs and VATs.Thepvalues
indicated the significance of the comparison, was calculated by Benjamini-corrected modified Fisher’s exact test.
Figure 4Differences in mRNA expression levels of theC3andCLEC12Bgene between the VATs and SATs.
Zhouet al. Lipids in Health and Disease2013,12:75 Page 4 of 13
Figure 6Top ten GO (Gene Ontology) terms enriched for the up- and down-regulated genes between the male and female pig breeds.Thepvalues indicated the significance of the comparison, was calculated by Benjamini-corrected modified Fisher’s exact test.
Figure 7Differences in mRNA expression levels of theCPB1, RXFP2, PAEPandFABP7gene between the between the females
and males.
Zhouet al. Lipids in Health and Disease2013,12:75 Page 6 of 13
Co-expressed gene sets linked to the obesity-related phenotypes
Generally, quantitative characters (such as adipose de-position) in mammals are determined by a set of genes that cooperate in certain biological processes [11]. To further explore the relationships between the genes and obesity-related traits, we applied a clustering method to identify sets of functionally related genes linked to the phenotypic traits as reported previously [19].
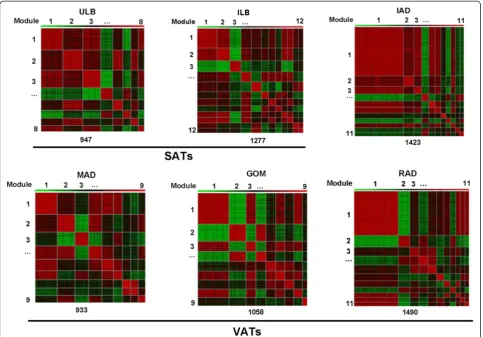
We identified eight gene modules containing 947 genes for ULB and twelve gene modules containing 1,277 genes for ILB. In three typical VATs, we identified nine, nine and eleven gene modules containing 933, 1,058 and 1,409 genes for the MAD, GOM and RAD tis-sues, respectively. For the IAD, we identified eleven modules containing 1,423 genes (Figure 9).
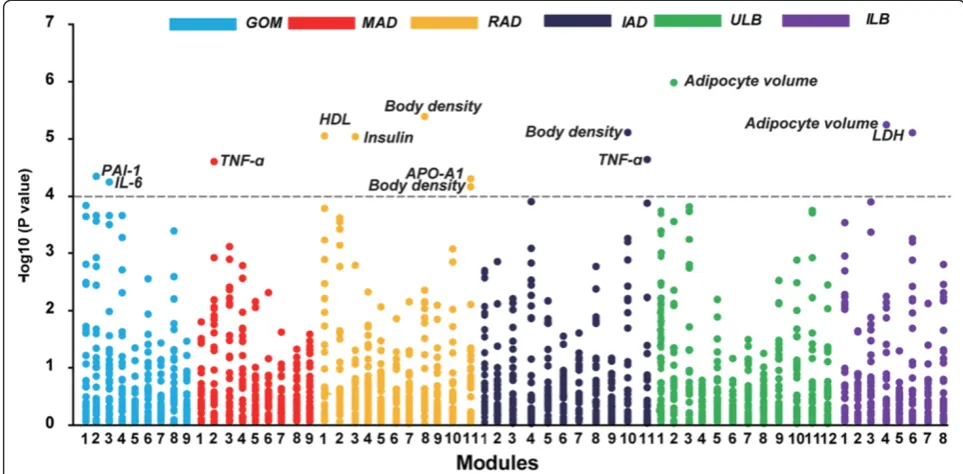
Next, we explored the correlations between the mod-ules of co-expressed genes and the various obesity phe-notypes. Three gene modules in the SATs (i.e. ULB and
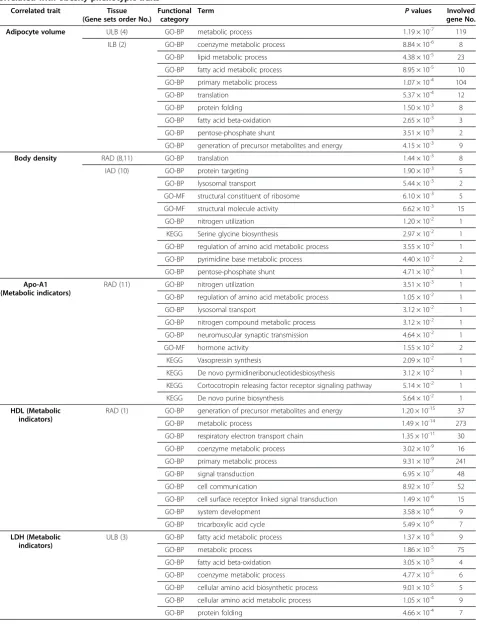
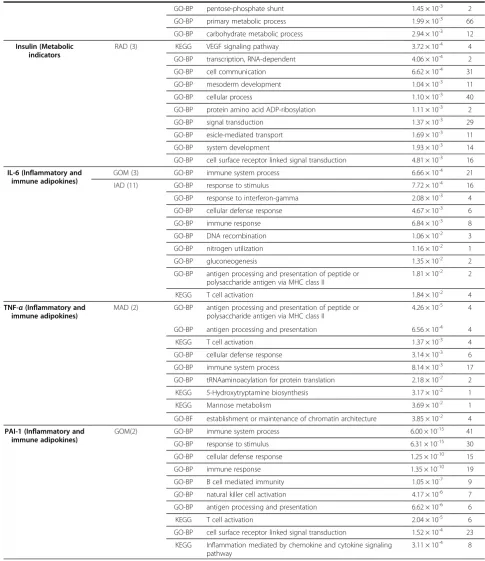
ILB) were significantly correlated with adipocyte volume and the concentration of plasma lactate dehydrogenase in serum (false discovery rate adjusted permutation, P< 0.05) (Figure 10 and Table 2). The co-expressed genes within these modules were mainly involved in metabolic processes, such as fatty acid metabolic process (23 genes, P= 4.38 × 10⁻⁵), fatty acid beta-oxidation (3 genes, P= 2.65 × 10⁻³), coenzyme metabolic process (6 genes, P= 4.77 × 10⁻⁵) and carbohydrate metabolic process (12 genes,P= 2.94 × 10⁻³) (Table 3), in agreement with an earlier report that SATs contribute mainly to metabolic processes [20,21].
The co-expressed genes in two of the VATs (i.e. GOM and MAD) mainly affected the concentrations of inflam-matory and immune adipokines in serum, i.e. plasmino-gen activator inhibitor-1 (PAI-1), interleukin 6 (IL-6) and tumor necrosis factor-α (TNF-α) (Figure 10 and Table 2). The co-expressed genes within these modules were mainly involved in immune system process (21
Figure 8Validation of gene expression by Q-PCR.The Pearson correlation coefficient (r) and the corresponding significance value (P) were
genes, P= 6.66 × 10⁻⁴), immune response (8 genes, P= 6.84 × 10⁻³), cellular defence response (15 genes,P=1.25 × 10⁻¹⁰), cellular defence response (6 genes, P= 4.67 × 10⁻³) and B cell mediated immunity (9 genes, P= 1.05 × 10⁻⁷). This result suggested that the GOM and MAD tissues con-tributed mainly to the obesity-induced chronic inflamma-tion in adipose tissue that precedes the development of insulin resistance and type II diabetes [22,23]. The RAD tis-sue, on the other hand, was found to affect mainly the body density and the concentrations of three metabolic indica-tors in serum, namely, high density lipoprotein, insulin, and apolipoprotein A-1 (Apo-A1), which are mainly involved in metabolic processes such as coenzyme metabolic process (16 genes,P =3.02 × 10⁻⁹), primary metabolic process (241 genes,P= 9.31 × 10⁻⁹), and tricarboxylic acid cycle (7 genes, P= 5.49 × 10⁻⁶) (Table 3). Studies in human showed that GOM was strongly correlated to insulin, while no such correlations were found between lipid uptake and SAT or RAD [24].
Similar to the findings for the high-risk VATs, the co-expressed genes in IAD were also found to be significantly
correlated with immune-related TNF-α (Figure 10 and Table 2), further suggesting that the IAD is an independ-ent risk factor for metabolic diseases [25].
Conclusions
The present study describes a genome-wide analysis of gene expression profiling among various adipose depots between the sexes of three well-defined pig breeds displaying distinct adipose phenotypes. We present evi-dence that the SATs mainly affect metabolic processes, while the VATs and the IAD are associated mainly with immune and inflammation responses that are seen as the metabolic risk factors of obesity. This study also sup-ports pig as an ideal model for studying human obesity.
Materials and methods Tissue collection
Three females and three males at 210-days-old for each of the leaner Landrace pigs (a Western breed), the wild Tibetan pigs (a feral, indigenous Chinese pig that has not undergone artificial selection) and the fatty Rongchang
Figure 9Heat maps of co-expressed gene modules in six adipose tissues.Two SATs (ILB: inner layer of backfat, ULB: upper layer of backfat);
three VATs (GOM: greater omentum, MAD: mesenteric adipose, RAD: retroperitoneal adipose); and intermuscular adipose (IAD). Pair-wise correlations between genes residing in all the gene sets were plotted. Bright red indicates a strong positive co-expression, whereas bright green indicates strong negative co-expression.
Zhouet al. Lipids in Health and Disease2013,12:75 Page 8 of 13
pigs (a Chinese breed) were used in this study as previously described [3]. Animals were humanely sacrificed, in com-pliance with experimental animals established by the Min-istry of Agriculture of China. Three VATs (i.e. GOM, MAD and RAD), two SATs (i.e. ULB and ILB) as well as IAD were rapidly separated from each carcass, immediately fro-zen in liquid nitrogen, and stored at−80°C until RNA ex-traction. For more information, please refer to Liet al. [3].
Measurements of the obesity-related phenotypes
Measurements of the pig body density, the concentra-tions of 24 serum-circulating indicators of metabolism
and the adipocyte volume are from our previous report based on same individuals. For more information, please refer to Liet al.[3].
RNA isolation and microarray analysis
The total RNA (10 μg) of the 108 tissue samples was extracted with TRIzol (Invitrogen) and further purified using an Rneasy column (Qiagen). Hybridization, wash-ing, and scanning were done according to standard Agilent protocols. The data analysis was performed with MultiExperiment Viewer (MeV) [24]. Array data have been uploaded to NCBI’s Gene Expression Omnibus
Figure 10Correlations between co-expressed gene modules in six adipose tissues and obesity phenotypic traits.-Log10Pvalues for
Spearman rank correlation coefficients between the expressed values of the gene modules and the different obesity phenotypic traits are shown. The gray line represents the Bonferroni correctedPvalue greater than 0.05.
Table 2 Modules correlated with the obesity-related traits in SATs and VATs
Tissues Module ID Correlated trait No. of genes in module Correlation coefficient P-value
SAT ULB 4 Adipocyte volume 110 −0.85 8.12 × 10⁻⁶
6 LDH 72 −0.84 1.23 × 10⁻⁵
ILB 2 Adipocyte volume 157 0.87 2.05 × 10⁻⁶
VAT GOM 2 PAI-1 162 −0.81 4.97 × 10⁻⁵
3 IL-6 92 −0.80 6.28 × 10⁻⁵
MAD 2 TNF-a 152 0.82 2.57 × 10⁻⁵
RAD 8 Body density 71 0.87 2.97 × 10⁻⁶
11 Body density 51 −0.81 5.44 × 10⁻⁵
1 HDL 590 0.85 7.42 × 10⁻⁶
11 Apo-A1 51 −0.81 3.91 × 10⁻⁵
3 Insulin 118 0.77 6.89 × 10⁻⁶
IAD 10 Body density 55 0.86 5.90 × 10⁻⁶
Table 3 Top ten GO (Gene Ontology) and pathway categories enriched for co-expressed gene modules which correlated with obesity phenotypic traits
Correlated trait Tissue (Gene sets order No.)
Functional category
Term Pvalues Involved
gene No.
Adipocyte volume ULB (4) GO-BP metabolic process 1.19 × 10⁻⁷ 119
ILB (2) GO-BP coenzyme metabolic process 8.84 × 10⁻⁶ 8
GO-BP lipid metabolic process 4.38 × 10⁻⁵ 23
GO-BP fatty acid metabolic process 8.95 × 10⁻⁵ 10
GO-BP primary metabolic process 1.07 × 10⁻⁴ 104
GO-BP translation 5.37 × 10⁻⁴ 12
GO-BP protein folding 1.50 × 10⁻³ 8
GO-BP fatty acid beta-oxidation 2.65 × 10⁻³ 3
GO-BP pentose-phosphate shunt 3.51 × 10⁻³ 2
GO-BP generation of precursor metabolites and energy 4.15 × 10⁻³ 9
Body density RAD (8,11) GO-BP translation 1.44 × 10⁻³ 8
IAD (10) GO-BP protein targeting 1.90 × 10⁻³ 5
GO-BP lysosomal transport 5.44 × 10⁻³ 2
GO-MF structural constituent of ribosome 6.10 × 10⁻³ 5
GO-MF structural molecule activity 6.62 × 10⁻³ 15
GO-BP nitrogen utilization 1.20 × 10⁻² 1
KEGG Serine glycine biosynthesis 2.97 × 10⁻² 1
GO-BP regulation of amino acid metabolic process 3.55 × 10⁻² 1
GO-BP pyrimidine base metabolic process 4.40 × 10⁻² 2
GO-BP pentose-phosphate shunt 4.71 × 10⁻² 1
Apo-A1 (Metabolic indicators)
RAD (11) GO-BP nitrogen utilization 3.51 × 10⁻³ 1
GO-BP regulation of amino acid metabolic process 1.05 × 10⁻² 1
GO-BP lysosomal transport 3.12 × 10⁻² 1
GO-BP nitrogen compound metabolic process 3.12 × 10⁻² 1
GO-BP neuromuscular synaptic transmission 4.64 × 10⁻² 1
GO-MF hormone activity 1.55 × 10⁻² 2
KEGG Vasopressin synthesis 2.09 × 10⁻² 1
KEGG De novo pyrmidineribonucleotidesbiosythesis 3.12 × 10⁻² 1
KEGG Cortocotropin releasing factor receptor signaling pathway 5.14 × 10⁻² 1
KEGG De novo purine biosynthesis 5.64 × 10⁻² 1
HDL (Metabolic indicators)
RAD (1) GO-BP generation of precursor metabolites and energy 1.20 × 10⁻¹⁵ 37
GO-BP metabolic process 1.49 × 10⁻¹⁴ 273
GO-BP respiratory electron transport chain 1.35 × 10⁻¹¹ 30
GO-BP coenzyme metabolic process 3.02 × 10⁻⁹ 16
GO-BP primary metabolic process 9.31 × 10⁻⁹ 241
GO-BP signal transduction 6.95 × 10⁻⁷ 48
GO-BP cell communication 8.92 × 10⁻⁷ 52
GO-BP cell surface receptor linked signal transduction 1.49 × 10⁻⁶ 15
GO-BP system development 3.58 × 10⁻⁶ 9
GO-BP tricarboxylic acid cycle 5.49 × 10⁻⁶ 7
LDH (Metabolic indicators)
ULB (3) GO-BP fatty acid metabolic process 1.37 × 10⁻⁵ 9
GO-BP metabolic process 1.86 × 10⁻⁵ 75
GO-BP fatty acid beta-oxidation 3.05 × 10⁻⁵ 4
GO-BP coenzyme metabolic process 4.77 × 10⁻⁵ 6
GO-BP cellular amino acid biosynthetic process 9.01 × 10⁻⁵ 5
GO-BP cellular amino acid metabolic process 1.05 × 10⁻⁴ 9
GO-BP protein folding 4.66 × 10⁻⁴ 7
Zhouet al. Lipids in Health and Disease2013,12:75 Page 10 of 13
Table 3 Top ten GO (Gene Ontology) and pathway categories enriched for co-expressed gene modules which correlated with obesity phenotypic traits(Continued)
GO-BP pentose-phosphate shunt 1.45 × 10⁻³ 2
GO-BP primary metabolic process 1.99 × 10⁻³ 66
GO-BP carbohydrate metabolic process 2.94 × 10⁻³ 12
Insulin (Metabolic indicators
RAD (3) KEGG VEGF signaling pathway 3.72 × 10⁻⁴ 4
GO-BP transcription, RNA-dependent 4.06 × 10⁻⁴ 2
GO-BP cell communication 6.62 × 10⁻⁴ 31
GO-BP mesoderm development 1.04 × 10⁻³ 11
GO-BP cellular process 1.10 × 10⁻³ 40
GO-BP protein amino acid ADP-ribosylation 1.11 × 10⁻³ 2
GO-BP signal transduction 1.37 × 10⁻³ 29
GO-BP esicle-mediated transport 1.69 × 10⁻³ 11
GO-BP system development 1.93 × 10⁻³ 14
GO-BP cell surface receptor linked signal transduction 4.81 × 10⁻³ 16
IL-6 (Inflammatory and immune adipokines)
GOM (3) GO-BP immune system process 6.66 × 10⁻⁴ 21
IAD (11) GO-BP response to stimulus 7.72 × 10⁻⁴ 16
GO-BP response to interferon-gamma 2.08 × 10⁻³ 4
GO-BP cellular defense response 4.67 × 10⁻³ 6
GO-BP immune response 6.84 × 10⁻³ 8
GO-BP DNA recombination 1.06 × 10⁻² 3
GO-BP nitrogen utilization 1.16 × 10⁻² 1
GO-BP gluconeogenesis 1.35 × 10⁻² 2
GO-BP antigen processing and presentation of peptide or polysaccharide antigen via MHC class II
1.81 × 10⁻² 2
KEGG T cell activation 1.84 × 10⁻² 4
TNF-α(Inflammatory and immune adipokines)
MAD (2) GO-BP antigen processing and presentation of peptide or polysaccharide antigen via MHC class II
4.26 × 10⁻⁵ 4
GO-BP antigen processing and presentation 6.56 × 10⁻⁴ 4
KEGG T cell activation 1.37 × 10⁻³ 4
GO-BP cellular defense response 3.14 × 10⁻³ 6
GO-BP immune system process 8.14 × 10⁻³ 17
GO-BP tRNAaminoacylation for protein translation 2.18 × 10⁻² 2
KEGG 5-Hydroxytryptamine biosynthesis 3.17 × 10⁻² 1
KEGG Mannose metabolism 3.69 × 10⁻² 1
GO-BF establishment or maintenance of chromatin architecture 3.85 × 10⁻² 4 PAI-1 (Inflammatory and
immune adipokines)
GOM(2) GO-BP immune system process 6.00 × 10⁻¹⁵ 41
GO-BP response to stimulus 6.31 × 10⁻¹⁵ 30
GO-BP cellular defense response 1.25 × 10⁻¹⁰ 15
GO-BP immune response 1.35 × 10⁻¹⁰ 19
GO-BP B cell mediated immunity 1.05 × 10⁻⁷ 9
GO-BP natural killer cell activation 4.17 × 10⁻⁶ 7
GO-BP antigen processing and presentation 6.62 × 10⁻⁶ 6
KEGG T cell activation 2.04 × 10⁻⁵ 6
GO-BP cell surface receptor linked signal transduction 1.52 × 10⁻⁴ 23 KEGG Inflammation mediated by chemokine and cytokine signaling
pathway
3.11 × 10⁻⁴ 8
(GEO) [accession number GSE30343]. For more infor-mation, please refer to Liet al.[3].
Identification of differentially expressed genes
We used three-way repeated-measures ANOVA (n= 3 per breed per sex per tissue) to identified differentially expressed (DE) mRNA among six adipose tissues be-tween sexes of three pig breeds (P< 0.05, corrected with adjusted Bonferroni method, FDR <0.05, 1,000 permuta-tions), which were further analyzed using DAVID to examine whether these DE genes were enriched for spe-cific functional catalogs (i.e. KEGG pathways and Gene Ontology-Biological Processes and -Molecular Func-tions) (P < 0.05, corrected with adjusted Bonferroni method) [26].
Identification of co-expressed gene modules
To identify sets of functionally related genes in six adi-pose tissues, linked to the phenotypic traits, we applied a clustering method as described previously [4,19] with some modifications. Spearman rank correlation coeffi-cients were determined between all possible gene-pairs across 18 samples for each adipose tissue. The strongest correlated gene-pair was selected, and grouped together
in a set that was assigned the average expression value of the two genes that constitute this set. After addition of this newly created set to the dataset, the two individ-ual genes were removed from the data and the strongest correlation in the dataset was again selected. This resulted in either the expansion of a set already created or in the creation of a new set. We kept repeating this as an iterative process until the most significantly corre-lated pair was coefficient of correlationr< 0.80. Only the sets containing 50 or more genes are kept for further analysis. The gene sets - reflecting the average expres-sion value of the genes constituting that set - were cor-related with obesity phenotypic traits using a Spearman rank correlation coefficient.
Quantitative PCR
Quantitative PCR (Q-PCR) was used to confirm the expression pattern observed in the microarray results. Q-PCR was performed on a CF96 Real-Time Q-PCR Detection System (Bio-Rad) using SYBR® Green Real-time PCR Master Mix (TaKaRa, China). The PCR primer se-quences are shown in Table 4. Porcine ACTB,TBP and TOP2B were simultaneously used as endogenous control
Table 4 Primers used for the Q-PCR assay
Gene symbol Primer sequence (5′→3′) Amplicon length (bp) GenBank No.
ACTB* F: TCTGGCACCACACCTTCT 114 DQ178122
R: TGATCTGGGTCATCTTCTCAC
TBP* F: GATGGACGTTCGGTTTAGG 124 DQ178129
R: AGCAGCACAGTACGAGCAA
TOP2B* F: AACTGGATGATGCTAATGATGCT 137 AF222921
R: TGGAAAAACTCCGTATCTGTCTC
ACADL F: GTAAGAACAAATGCCAAGA 103 NM_213897
R: CAGCCACTACAATCACAAC
ADIPOQ F: GGGTCACTGTCCCTAAC 209 NM_214370
R: GTCCTGGTACTGGTCGT
ADIPOR1 F: TGGCTGAAGGACAACGAC 228 NM_001007193
R: CAAGAAGAACATCCCAAACAC
CAV3 F: GCATCAGCCATATCTACTCACT 107 NM_001037149
R: CACTTCTTTCCGCAGCAT
MDH1 F: TAAGGTTATCGTGGTGGG 124 U44846
R: TGCTTTAGCTCGGTTGTG
MDH2 F: CGAGGTGGTCAAGGCTAAG 172 M16427
R: CAATGGCGTGGAGAAATAC
ME 1 F: GTTGCCCTTGGTGTTGT 212 X93016
R: GGATAAATGGTGGCTGTC
Insig1 F: TCAACCACGCCAGTGCTAA 251 AY336601.2
R: CACGCCTCCCGAGAAGAAA
SCAP F: CGCCTGAAACAGAAATCG 213 XM_001924223
R: TCTCCTGAGCCTCCAACA
*:ACTB(βactin),TBcP(TATA box binding protein) andTOP2B(topoisomerase IIβ) are the endogenous control genes.
Zhouet al. Lipids in Health and Disease2013,12:75 Page 12 of 13
genes. The 2-ΔΔCt method was used to determine the relative mRNA abundance for the surveyed samples.
Abbreviations
SAT:Subcutaneous adipose tissue; VAT: Visceral adipose tissue; ULB: Upper layer of backfat; ILB: Inner layer of backfat; GOM: Greater omentum adipose; MAD: Mesenteric adipose; RAD: Retroperitoneal adipose; IAD: Intermuscular adipose.
Competing interests
The authors have declared that no competing interests exist.
Authors’contributions
MZL and XWL conceived and designed the experiment. CWZ and MZL performed the data analysis and drafted the manuscript. JDM and AAJ collected the samples and records. GQT, MMM, LZ and LB carried out the physiological, biochemical and histological studies, statistical analysis and prepared nucleic acids. CWZ and JZ performed gene expression microarray and data analysis. All authors read and approved the final manuscript.
Acknowledgments
This work was supported by grants from the National High Technology Research and Development Program of China (863 Program)
(2013AA102502),the Specialized Research Fund of Ministry of Agriculture of China (NYCYTX-009), the Project of Provincial Twelfth Five Years’Animal Breeding of Sichuan Province (2011YZGG15) and the National Special Foundation for Transgenic Species of China (2011ZX08006-003).
Received: 14 March 2013 Accepted: 22 May 2013 Published: 24 May 2013
References
1. Wronska A, Kmiec Z:Structural and biochemical characteristics of various white adipose tissue depots.Acta Physiol (Oxf )2012,205:194–208. 2. Matsuzawa Y:The metabolic syndrome and adipocytokines.FEBS Lett
2006,580:2917–2921.
3. Li M, Wu H, Luo Z, Xia Y, Guan J, Wang T, Gu Y, Chen L, Zhang K, Ma J:An atlas of DNA methylomes in porcine adipose and muscle tissues.Nat Commun2012,3:850–861.
4. Li M, Wu H, Wang T, Xia Y, Jin L, Jiang A, Zhu L, Chen L, Li R, Li X: Co-methylated genes in different adipose depots of pig are associated with metabolic, inflammatory and immune processes.Int J Biol Sci2012, 8:831–837.
5. Karastergiou K, Smith SR, Greenberg AS, Fried SK:Sex differences in human adipose tissues–the biology of pear shape.Biology of Sex Differences2012, 3:13.
6. Deurenberg P, Deurenberg-Yap M:Differences in body-composition assumptions across ethnic groups: practical consequences.Curr Opin Clin Nutr2001,4:377–383.
7. Lunney JK:Advances in swine biomedical model genomics.Int J Biol Sci
2007,3:179–184.
8. Mueller-Ortiz SL, Drouin SM, Wetsel RA:The alternative activation pathway and complement component C3 are critical for a protective immune response against Pseudomonas aeruginosa in a murine model of pneumonia.Infect Immun2004,72:2899–2906.
9. Abdelnoor AM, Kobeissy F, Farhat D, Hadi U:Circulating immune complexes and complement C3 and C4 levels in a selected group of patients with rhinitis in Lebanon.Clin Mol Allergy2004,2:6.
10. Hoffmann SC, Schellack C, Textor S, Konold S, Schmitz D, Cerwenka A, Pflanz S, Watzl C:Identification of CLEC12B, an inhibitory receptor on myeloid cells.J Biol Chem2007,282:22370–22375.
11. Wolfs MG, Rensen SS, Bruin-Van Dijk EJ, Verdam FJ, Greve J-W, Sanjabi B, Bruinenberg M, Wijmenga C, van Haeften TW, Buurman WA:Co-expressed immune and metabolic genes in visceral and subcutaneous adipose tissue from severely obese individuals are associated with plasma HDL and glucose levels: a microarray study.BMC Med Genomics2010,3:34. 12. Wajchenberg BL:Subcutaneous and visceral adipose tissue: their relation
to the metabolic syndrome.Endocr Rev2000,21:697–738. 13. Satoor SN, Puranik AS, Kumar S, Williams MD, Ghale M, Rahalkar A,
Karandikar MS, Shouche Y, Patole M, Bhonde R:Location, location, location: Beneficial effects of autologous fat transplantation.Sci Rep2011,1:81.
14. Grove K, Fried S, Greenberg A, Xiao X, Clegg D:A microarray analysis of sexual dimorphism of adipose tissues in high-fat-diet-induced obese mice.Int J Obesity2010,34:989–1000.
15. Yuan F, Li X, Lin J, Schwabe C, Büllesbach E, Rao C, Lei Z:The role of RXFP2 in mediating androgen-induced inguinoscrotal testis descent in LH receptor knockout mice.Reproduction2010,139:759–769.
16. Luitjens C, Gallegos M, Kraemer B, Kimble J, Wickens M:CPEB proteins control two key steps in spermatogenesis in C. elegans.Genes Dev2000, 14:2596–2609.
17. Joshi SG, Bank JF, Henriques ES, Makarachi A, Matties G:Serum levels of a progestagen-associated endometrial protein during the menstrual cycle and pregnancy.J Clin Endocr Metab1982,55:642–648.
18. Zhang H, Rakha E, Ball G, Spiteri I, Aleskandarany M, Paish E, Powe D, Macmillan R, Caldas C, Ellis I:The proteins FABP7 and OATP2 are associated with the basal phenotype and patient outcome in human breast cancer.Breast Cancer Res Treat2010,121:41–51.
19. Eisen MB, Spellman PT, Brown PO, Botstein D:Cluster analysis and display of genome-wide expression patterns.Proc Natl Acad Sci1998,95:14863–14868. 20. Smith SR, Lovejoy JC, Greenway F, Ryan D, deJonge L, de la Bretonne J,
Volafova J, Bray GA:Contributions of total body fat, abdominal subcutaneous adipose tissue compartments, and visceral adipose tissue to the metabolic complications of obesity.Metabolism2001,50:425–435. 21. Tran TT, Yamamoto Y, Gesta S, Kahn CR:Beneficial effects of subcutaneous
fat transplantation on metabolism.Cell Metab2008,7:410–420. 22. Iyer A, Fairlie DP, Prins JB, Hammock BD, Brown L:Inflammatory lipid mediators
in adipocyte function and obesity.Nat Rev Endocrinol2010,6:71–82. 23. Torres‐Leal FL, Fonseca‐Alaniz MH, Rogero MM, Tirapegui J:The role of
inflamed adipose tissue in the insulin resistance.Cell Biochem Funct2010, 28:623–631.
24. Maury E, Ehala-Aleksejev K, Guiot Y, Detry R, Vandenhooft A, Brichard SM: Adipokines oversecreted by omental adipose tissue in human obesity.
Am J Physiol-Endoc M2007,293:E656–E665.
25. Yim J, Heshka S, Albu J, Heymsfield S, Kuznia P, Harris T, Gallagher D: Intermuscular adipose tissue rivals visceral adipose tissue in independent associations with cardiovascular risk.Int J Obesity2007,31:1400–1405. 26. Da Wei Huang BTS, Lempicki RA:Systematic and integrative analysis of large
gene lists using DAVID bioinformatics resources.Nat Protoc2008,4:44–57. doi:10.1186/1476-511X-12-75
Cite this article as:Zhouet al.:Gene expression profiling reveals distinct features of various porcine adipose tissues.Lipids in Health and Disease
201312:75.
Submit your next manuscript to BioMed Central and take full advantage of:
• Convenient online submission
• Thorough peer review
• No space constraints or color figure charges
• Immediate publication on acceptance
• Inclusion in PubMed, CAS, Scopus and Google Scholar
• Research which is freely available for redistribution