1
R E S E A R C H A R T I C L E
Open Access
2
Performance comparison of first-order
3
conditional estimation with interaction
4
and Bayesian estimation methods for
5
estimating the population parameters
6
and its distribution from data sets with
7
a low number of subjects
8
Q1
Sudeep Pradhan
1†, Byungjeong Song
1†, Jaeyeon Lee
2, Jung-woo Chae
3, Kyung Im Kim
4, Hyun-moon Back
1,
9
Nayoung Han
1, Kwang-il Kwon
1,5*and Hwi-yeol Yun
1,5*10 11 12 13 14
15 Abstract
16 Background:Exploratory preclinical, as well as clinical trials, may involve a small number of patients, making it 17 difficult to calculate and analyze the pharmacokinetic (PK) parameters, especially if the PK parameters show very 18 high inter-individual variability (IIV). In this study, the performance of a classical first-order conditional estimation 19 with interaction (FOCE-I) and expectation maximization (EM)-based Markov chain Monte Carlo Bayesian (BAYES) 20 estimation methods were compared for estimating the population parameters and its distribution from data sets 21 having a low number of subjects.
22 Methods:In this study, 100 data sets were simulated with eight sampling points for each subject and with six
23 different levels of IIV (5%, 10%, 20%, 30%, 50%, and 80%) in their PK parameter distribution. A stochastic simulation
24 and estimation (SSE) study was performed to simultaneously simulate data sets and estimate the parameters using
25 four different methods: FOCE-I only, BAYES(C) (FOCE-I and BAYES composite method), BAYES(F) (BAYES with all true
26 initial parameters and fixedω2), and BAYES only. Relative root mean squared error (rRMSE) and relative estimation
27 error (REE) were used to analyze the differences between true and estimated values. A case study was performed
28 with a clinical data of theophylline available in NONMEM distribution media. NONMEM software assisted by Pirana,
29 PsN, and Xpose was used to estimate population PK parameters, and R program was used to analyze and plot the results.
30 Results:The rRMSE and REE values of all parameter (fixed effect and random effect) estimates showed that all four 31 methods performed equally at the lower IIV levels, while the FOCE-I method performed better than other EM-based 32 methods at higher IIV levels (greater than 30%). In general, estimates of random-effect parameters showed significant bias 33 and imprecision, irrespective of the estimation method used and the level of IIV. Similar performance of the estimation 34 methods was observed with theophylline dataset.
(Continued on next page)
* Correspondence:[email protected];[email protected]
†Equal contributors
1College of Pharmacy, Chungnam National University, Daejeon 34134,
Republic of Korea
Full list of author information is available at the end of the article
(Continued from previous page)
35 Conclusions:The classical FOCE-I method appeared to estimate the PK parameters more reliably than the BAYES method
36 when using a simple model and data containing only a few subjects. EM-based estimation methods can be considered
37 for adapting to the specific needs of a modeling project at later steps of modeling.
38 Keywords:Estimation methods, Few subjects, First-order conditional estimation with interaction, Markov chain Monte 39 Carlo Bayesian, NONMEM,
40 Background
41 Exploratory preclinical (as well as clinical) trials may in-42 volve a low number of subjects (around 6 subjects). This 43 is because in the early stages of drug development, statis-44 tical approaches are difficult to apply, potentially leading 45 to bias when predicting population mean and distribution 46 of parameters and/or all sources of variability. In addition, 47 different aspects of the study design are not considered 48 when calculating the number of subjects. As a result, it 49 can be difficult to calculate and analyze the pharmacoki-50 netic (PK) parameters, especially if the PK parameters 51 show very high inter-individual variability (IIV).
52 Population analysis is a set of statistical techniques that 53 can be used to study the average response (clinically mea-54 sured event of any biomarker) in a population, as well as 55 the IIVs in responses arising from different sources [1]. 56 NONMEM is the gold standard software for population 57 analysis that allows for mixed-effect modeling of PK/phar-58 macodynamic data while accounting for both unexplained 59 inter-subject, inter-occasion, and residual variability (ran-60 dom effects), as well as measured concomitant effects 61 (fixed effects). It can also be useful for analyzing data 62 obtained from a low number of subjects involved in a study 63 [2]. A list of estimation methods is available in NONMEM, 64 including classical estimation methods [first-order 65 conditional estimation with interaction (FOCE) and 66 second-order approximation (LAPLACE)] and max-67 imum likelihood expectation maximization (EM)-based 68 estimation methods [iterative two-stage (ITS), import-69 ant sampling EM (IMP), important sampling EM 70 assisted by mode a posterior (IMPMAP), stochastic 71 approximation expectation maximization (SAEM), and 72 Markov chain Monte Carlo Bayesian (BAYES)]. There-73 fore, it is important to understand the performance of 74 different approach-based methods for handling data 75 with a low number of subjects.
76 Classical estimation methods like FOCE-I, including 77 FO, FOCE and Laplace, approximate the likelihood by 78 taking Laplace transformation and Taylor linearization 79 [3]. These methods are known to perform well when 80 models structure are simple and low in dimension. Here, 81 the model with higher number of random-effect parame-82 ters (IIVs) are referred as of high dimensions. Further-83 more, the classical estimation methods known to 84 provide highly reproducible values, and short run-times
85 for simple PK models [4]. However, these linearization
86 methods fail to converge and estimate parameters
pre-87 cisely with significant bias with increase in model
com-88 plexity. The EM based methods calculate the exact
89 likelihood (with approximation) by sampling and
sum-90 ming through the probability density function space,
91 which is theoretically expected to approach the true
like-92 lihood as the sampling reaches infinity. It is due to this
93 sampling step EM based methods have longer run-time
94 compared to the classical methods for simple PK models
95 [5]. In case of complex PK/PD problems, EM based
96 methods are faster than FOCE-I due to their efficient
97 maximization step [4].
98 Some previous studies have compared available
esti-99 mation methods with different objectives, identifying
100 various desirable traits of estimation methods. The most
101 desirable property of a given estimation method is its
102 precision and accuracy as they are the basis of the
reli-103 ability of the obtained estimates. Other expected features
104 of the estimation methods are low sensitivity to priors
105 and short runtime. However, no previous study has
com-106 pared estimation methods for estimating population PK
107 parameters from a small number of subjects. Therefore,
108 the objective of this study was to compare precision and
109 accuracy of estimation methods for estimating
popula-110 tion mean and distribution of PK parameters from a
111 small number of subjects and explore options to
112 minimize bias with a classical method and a maximum
113 likelihood EM-based method.
114
Methods
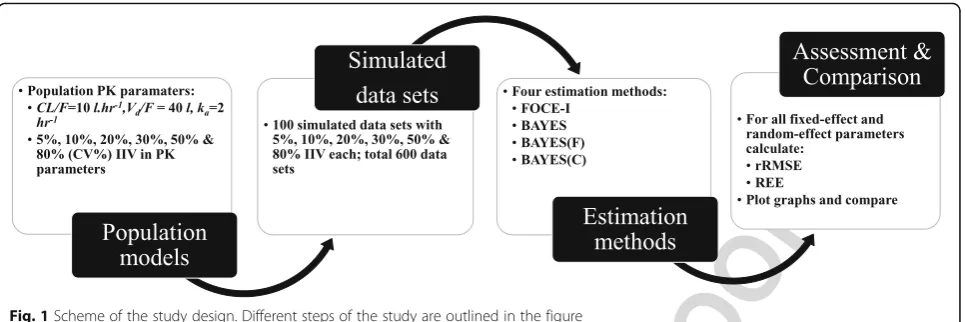
115 An outline of this study is provided in Fig. 1; details F1
116 are given in the following subsections. In this study,
117 100 data sets were simulated with eight sampling
118 points for each subject and with six different levels of
119 IIV (5%, 10%, 20%, 30%, 50%, and 80%) in their PK
120 parameter distribution. The main reason for creating
121 data sets was to describe close to real situations and
122 minimize potential data set-dependent bias.
123 Stochastic simulations and estimations
124 A stochastic simulation and estimation (SSE) study was
125 performed using a one-compartment PK model. The
126 estimation options in the model were varied to assess
128 FOCE with the interaction option (FOCE-I), which al-129 lows for interaction between IIV(η) and residual variabi-130 lity(ε), and an EM-based estimation method – BAYES 131 estimation method in NONMEM version 7.3.0 [6] 132 assisted by Pirana (ver. 2.9.0), PsN (ver. 4.2.0), and Xpose 133 (ver. 4.4.1) [7]. For statistical analysis of the results and 134 generating different plots of the results, R (ver. 3.1.3) 135 program was used [8].
136 Population model and simulated data sets
137 The population model, specifically a one-compartment 138 open model with first-order absorption and elimination 139 rate constants, was used for simulation and estimation. 140 The model consisted of three systematic PK parameters 141 as fixed effects describing the absorption rate constant 142 (Ka), apparent volume of distribution (Vd/F), and
appar-143 ent clearance (CL/F), two random-effect parameters (η) 144 describing the IIV onVd/FandCL/F [Eqs. (1, 2 and 3)],
145 and a proportional error (ε) model (Eq. 4):
Ka¼θKa; ð1Þ
Vd=F¼θVd=F ∙e
ηV d=F; ð2Þ
CL=F¼θCL=F ∙eηCL=F; ð3Þ
Cij¼Cpred;ij 1þεij
; ð4Þ
146 where Cijindicates thej-th observations ofi-th individual,
147 Cpred, ijindicates the model-predicted Cij, andεijindicates
148 the proportional residual error.
149 The following equations [Eqs. (5) and (6)] describe the 150 rate of change in drug amount in a one-compartment
system:
dAd
dt ¼−KaAd; ð5Þ
dAc
dt ¼KaAd− CL=F
Vd=F Ac; ð
6Þ
151 whereAdandAc are the drug amounts in the depot and
152
central compartments, respectively, and t denotes the
153
time.
154 The data set used for simulation consisted of six
indi-155 viduals with eight sampling points within 24 h after
dos-156 ing for each individual. The population mean of PK
157 parameters were assumed to be 2 L/h, 40 L, and 10 L/h
158 for Ka, Vd/F, and CL/F, respectively and their IIV levels
159 (variance parameter ω2) were assumed to be 5%, 10%,
160 20%, 30%, 50%, and 80% coefficient of variance (CV%)
161 (Eq. 7).
CVð Þ ¼% ffiffiffiffiffiffiffiffiffiffiffiffieω2
−1 p
100%: ð7Þ
162 Data sets were simulated 100 times for each level of
163 IIV (total of 600 data sets) and tested to compare
esti-164 mation performance in NONMEM.
165 Estimation methods
166 The population model was fitted to each of the
simu-167 lated data sets using estimation methods with different
168 estimation options and open or fixedω2values, as
sum-169
marized in Table1. T1
170 The FOCE-I method is a classical estimation method
171 that is applied by most users and has a short run-time
172 for estimation of population mean and distribution for
173 simple models [9, 10]. The BAYES method is a newly
174 introduced method in NONMEM and is more suitable
175 for estimation of population mean and distribution for
176 complex PK/PD models [10]. In this study, the other
177 estimation methods such as ITS, IMP, IMPMAP, and
178 SAEM were not tested because these methods were
179 expected to perform similar or below the performance
180 of BAYES as these methods are based on EM algorithms.
181 EM algorithms consist of an expectation (E) and a
182 maximization step (M), where these methods differed in
183 the way step E was performed, which involves the
184 approximation of likelihood. Additionally, the BAYES
185 method creates a large sample of probable parameters, f1:1 Fig. 1Scheme of the study design. Different steps of the study are outlined in the figure
186 unlike other EM-based methods that attempt to obtain a 187 single“most likely”set of estimates.
188 In this study, true parameter values, i.e., the parameter 189 values used in the simulation step, were established as 190 initial estimates in all estimation methods. In NON-191 MEM, convergence criteria for a FOCE-I are based only 192 on the parameter estimation gradient and are tested by 193 default. The number of significant digits for the estima-194 tion of each parameter was set to three (SIG = 3) for the 195 FOCE-I method. In the BAYES estimation method, the 196 convergence test type was set to 3 (CTYPE = 3), where 197 changes in objective function value, THETAs, OMEGAs, 198 and SIGMAs, are accessed. The number of significant 199 digits to which the objective function was evaluated was 200 set to 8 (SIGL = 8). In the BAYES methods, the max-201 imum number of iterations for which to perform the 202 burn-in phase was set to 4000 (NBURN = 4000), and the 203 number of iterations for which to perform the stationary 204 distribution for BAYES analysis was set to 10,000 205 (NITER = 10,000), both of which are default values in 206 NONMEM. The former option ensured that all parame-207 ters and objective functions did not appear to move in a 208 specific direction, but appeared to instead move around 209 a stationary region, and the latter provides a large set 210 (10,000) of likely population parameters.
211 Assessment and comparison of estimation methods
212 The estimation methods were assessed by relative root 213 mean squared error (rRMSE) and relative estimation 214 error (REE) for fixed-effect as well as random-effect pa-215 rameters to calculate and visualize the magnitude of dif-216 ferences between the true value and the estimated value. 217 The rRMSE [Eq. (8)] provides a combined measure of 218 bias and precision.
rRMSE¼
ffiffiffiffiffiffiffiffiffiffiffiffiffiffiffiffiffiffiffiffiffiffiffiffi PðPest−PtrueÞ2
Ptrue
n2
s
ð8Þ
219 where Pest is the estimated parameter value, Pest is the
220
true parameter values used at the simulation step, andn
221
is the number of simulations for each set of Ptrue (n=
222
100).
223 REE was calculated [Eq. (9)] and plotted as box plots;
224 the plot represents the relative bias by the median of the
225 REE values and precision by distribution of REE about zero.
REE¼
ffiffiffiffiffiffiffiffiffiffiffiffiffiffiffiffiffiffiffiffiffi
Pest−Ptrue
Ptrue : r
ð9Þ
226 Case study
227 The THEO data set available in the NONMEM
distribu-228 tion media was used as a case study. The estimated PK
229 parameters and IIV from the final model fitted to the
230 THEO data (called THEO model hereafter) was
consid-231 ered to be the population (true) mean values for PK
pa-232 rameters and IIV. SSE was performed using the THEO
233 model, where 100 data sets were simulated from the
234 model with six individuals in each data sets and four
dif-235 ferent estimation methods were used, listed in Table 1,
236 to estimate the PK parameters and their IIV from the
237 100 data sets.
238
Results
239 The rRMSE values of the estimated parameters
(fixed-ef-240 fect and random-effect) versus the level of IIV, stratified
241 based on the different PK parameters, are shown in
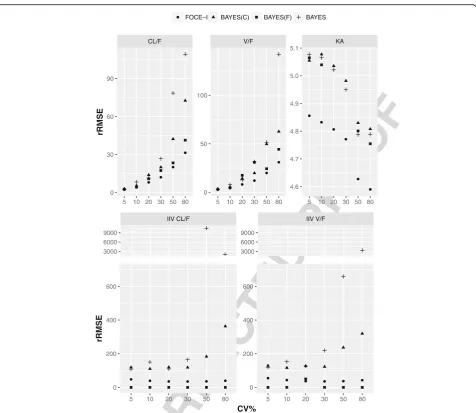
242 Fig.2. The scale for each of the plots are adjusted to in- F2
243 clude all values. The analysis of all parameter rRMSE
244 values showed that all four tested estimation methods
245 performed equally at the lower IIV levels (5–30%), while
246 the performance degraded with an increase in IIV. The
247 FOCE-I method performed better than the other three
248 EM-based estimation methods; this was more apparent
249 at higher IIV levels (above 30%) for both fixed-effect and
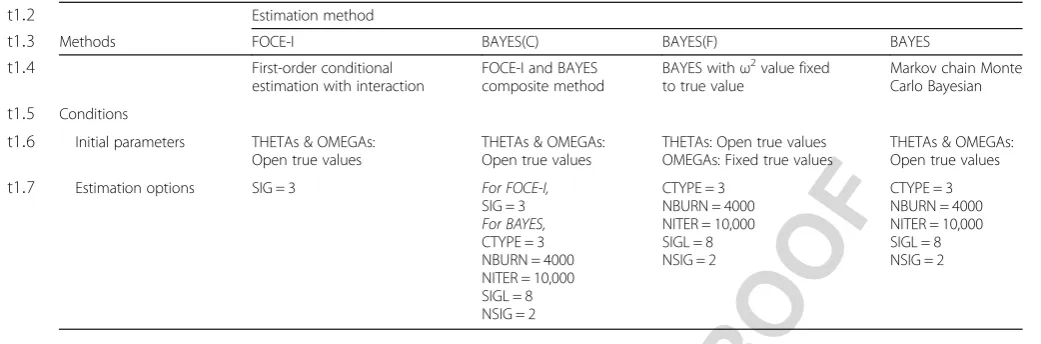
250 random-effect parameters. Performance of both the t1:1 Table 1Estimation methods and their conditions for initial parameters and estimation options
Q3
t1:2 Estimation method
t1:3 Methods FOCE-I BAYES(C) BAYES(F) BAYES
t1:4 First-order conditional
estimation with interaction
FOCE-I and BAYES composite method
BAYES withω2value fixed
to true value
Markov chain Monte Carlo Bayesian
t1:5 Conditions
t1:6 Initial parameters THETAs & OMEGAs:
Open true values
THETAs & OMEGAs: Open true values
THETAs: Open true values OMEGAs: Fixed true values
THETAs & OMEGAs: Open true values
t1:7 Estimation options SIG = 3 For FOCE-I,
SIG = 3
For BAYES,
CTYPE = 3 NBURN = 4000 NITER = 10,000 SIGL = 8 NSIG = 2
CTYPE = 3 NBURN = 4000 NITER = 10,000 SIGL = 8 NSIG = 2
251 BAYES(C) and BAYES methods were poor at an IIV 252 greater than 30% in terms of rRMSE. All parameter esti-253 mates at 50% and 80% IIV had exceptionally high 254 rRMSE. The BAYES(F) performance was intermediary 255 between FOCE-I and BAYES(C)/BAYES estimation 256 methods in terms of rRMSE.
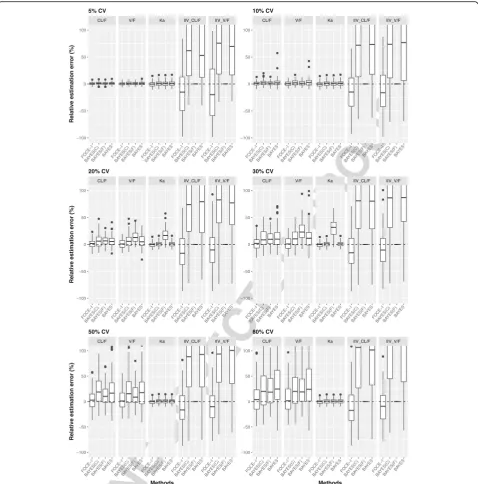
257 The REE of both fixed-effect and random-effect pa-258 rameters versus the estimation methods, stratified by dif-259 ferent levels of IIV, are shown in Fig.
F3 3. The plots were
260 adjusted to include ±100% REE for the purpose of clar-261 ity. In general, all estimation methods overestimated 262 fixed-effect parameters to some extent. At a lower level 263 of IIV (5–10%), all estimation methods estimated fixed-264 effect parameters with negligible bias and reasonable 265 precision. However, the bias as well imprecision
266 increased with an increase in IIV variability. Overall,
267 FOCE-I estimated fixed-effect parameters with REE near
268 zero at all tested levels of IIV, while the distribution of
269 REE increased with an increase in IIV. The other
270 remaining three methods, BAYES(C), BAYES(F), and
271 BAYES, had comparatively higher REE with a wider
dis-272 tribution range compared with the FOCE-I method.
273 The estimation of random-effect parameters had
pro-274 nounced bias and imprecision, irrespective of the
estima-275 tion method used or the level of IIV (with the exception
276 of the BAYES(F) method, where the variance parameter
277 was fixed to the true value) as shown in Fig. 3. Both
EM-278 based methods, BAYES(C) and BAYES, performed poorly
279 with higher bias and impression. Across all tested levels of
280 IIV, BAYES(C) and BAYES methods had high bias and
CL/F V/F KA
5 10 20 30 50 80 5 10 20 30 50 80 5 10 20 30 50 80 4.6
4.7 4.8 4.9 5.0 5.1
0 50 100
0 30 60 90
rRMSE
FOCE−I BAYES(C) BAYES(F) BAYES
IIV CL/F IIV V/F
3000 6000 9000
3000 6000 9000
5 10 20 30 50 80 5 10 20 30 50 80
0 200 400 600
0 200 400 600
CV%
rRMSE
f2:1 Fig. 2rRMSE plot for simulated data sets with 10%, 20%, 30%, 50% and 50% inter-individual variability. Relative root mean square error (rRMSE) of f2:2 fixed-effect and random-effect parameters from simulated data sets with 10%, 20%, 30%, 50% and 50% inter-individual variability using FOCE-I (●), f2:3 BAYES(C) (▲), BAYES(F) (■) and BAYES (┼) estimation methods
281 precision with skewed distribution of positive REE. The 282 FOCE-I method consistently performed better compared 283 with other methods with much lower and slightly negative 284 bias where the distribution of REE overlapped with the 285 zero value.
286 The overall stability of estimations were high with a 287 100% success rate of minimization and covariance step 288 for BAYES(C), BAYES(F), and BAYES methods. For the 289 FOCE-I method, the minimization step had a 100%
290 success rate, but the rate of the successful covariance
291 step was 52% at 5% IIV while other estimations had a
292 successful covariance step close to 100%.
293 The THEO data set used as a case study had 132
294 observations from 12 subjects, 11 observations per
indi-295 vidual after an oral dose of 320 mg theophylline. A
one-296 compartment PK model with first order absorption
297 described the data well and it was used as a final model.
298 The PK parameters from the THEO data set were:CL/F CL/F V/F Ka IIV_CL/F IIV_V/F
FOCE−I BAYES(C)BA
YES(F)BA YES
FOCE−I BAYES(C)BA
YES(F)BA YES
FOCE−I BAYES(C)BA
YES(F)BA YES
FOCE−I BAYES(C)BA
YES(F)BA YES
FOCE−I BAYES(C)BA
YES(F)BA YES −100 −50 0 50 100
Relative estimation err
or (%)
5% CV
CL/F V/F Ka IIV_CL/F IIV_V/F
FOCE−I BAYES(C)BAYES(F)BA
YES FOCE−I
BAYES(C)BAYES(F)BA YES
FOCE−I BAYES(C)BAYES(F)BA
YES FOCE−I
BAYES(C)BAYES(F)BA YES
FOCE−I BAYES(C)BAYES(F)BA
YES −100 −50 0 50 100
Relative estimation err
or (%)
20% CV
CL/F V/F Ka IIV_CL/F IIV_V/F
FOCE−I BA YES(C) BAYES(F)BA YES FOCE−I BA YES(C) BAYES(F)BA YES FOCE−I BA YES(C) BAYES(F)BA YES FOCE−I BA YES(C) BAYES(F)BA YES FOCE−I BA YES(C) BAYES(F)BA YES −100 −50 0 50 100 Methods
Relative estimation err
or (%)
50% CV
CL/F V/F Ka IIV_CL/F IIV_V/F
FOCE−I BAYES(C)BA
YES(F)BA YES
FOCE−I BAYES(C)BA
YES(F)BA YES
FOCE−I BAYES(C)BA
YES(F)BA YES
FOCE−I BAYES(C)BA
YES(F)BA YES
FOCE−I BAYES(C)BA
YES(F)BA YES −100 −50 0 50 100 10% CV
CL/F V/F Ka IIV_CL/F IIV_V/F
FOCE−I BAYES(C)BAYES(F)BA
YES FOCE−I
BAYES(C)BAYES(F)BA YES
FOCE−I BAYES(C)BAYES(F)BA
YES FOCE−I
BAYES(C)BAYES(F)BA YES
FOCE−I BAYES(C)BAYES(F)BA
YES −100 −50 0 50 100 30% CV
CL/F V/F Ka IIV_CL/F IIV_V/F
FOCE−I BA YES(C) BAYES(F)BA YES FOCE−I BA YES(C) BAYES(F)BA YES FOCE−I BA YES(C) BAYES(F)BA YES FOCE−I BA YES(C) BAYES(F)BA YES FOCE−I BA YES(C) BAYES(F)BA YES −100 −50 0 50 100 Methods 80% CV
f3:1 Fig. 3REE box-plot for simulated data sets with 10%, 20%, 30%, 50% and 50% inter-individual variability. Box-plot of relative estimation error (REE) f3:2 of fixed-effect and random-effect parameters from simulated data sets with 10%, 20%, 30%, 50% and 50% inter-individual variability using FOCE-I, f3:3 BAYES(C), BAYES(F) and BAYES estimation methods
Q4
299 = 2.88 l/h,Vd/F= 33.01 l and ka= 1.46 1/h and IIV were
300 25.69%, 13.48% and 65.39%, respectively. The rRMSE 301 plots (Additional file 1) of the PK parameters from the 302 THEO model show that the performance of the four 303 estimation methods were similar for estimates of CL/F
304 and Vd/F both of which had lower IIV, below 30%.
305 Whereas, overall higher rRMSE for estimate of Ka was
306 observed, particularly from EM based methods. The esti-307 mation methods followed similar pattern of performance 308 as indicated by rRMSE for estimation of random effect 309 parameters. Similarly, REE box plots (Additional file 2) 310 for estimated PK parameters show that CL/F and Vd/F
311 estimated by all four estimation methods were very close 312 to the true values, where both of them had true IIV 313 below 30%. For the estimate ofKa, FOCE-I method
esti-314 mated values were closes to the true value while esti-315 mated values from other three EM based method were 316 positively biased (median REE above 25%) with low pre-317 cision. Estimation of random effect parameters were 318 poor for all the estimation methods, but the FOCE-I 319 method performed relatively better in terms of bias and 320 precision.
321 Discussion
322 For an estimation method, the most desirable features 323 are a low bias and high precision. In this study, we used 324 rRMSE and REE to evaluate these features. The rRMSE 325 provides a single value that indicates both bias and pre-326 cision. Moreover, rRMSE provides a way to compare 327 performance across parameters and models. However, 328 the REE allows for comparison of different parameters 329 with varying magnitudes in a single plot while acknow-330 ledging bias and precision. For an estimation method to 331 be unbiased and precise, the REE should have a normal 332 distribution with a median of 0 and a narrow range of 333 values.
334 The FOCE-I method performed better among the four 335 methods tested based on the overall rRMSE. This per-336 formance was supported by the REE plot, which did not 337 show any significant bias for any fixed effect parameters 338 at any given level of IIV. The median REE values for the 339 random-effect parameters were not greater than−17% at 340 any given level of IIV. A resembling result of negative 341 bias was observed with the FOCE-I algorithm in a simi-342 lar studies comparing different estimation methods [9]. 343 The FOCE-I method has been shown to work suffi-344 ciently well for simple models when compared to other 345 EM based algorithms in previous studies. Furthermore, 346 when the IIV was low, the performance of classical esti-347 mation methods and EM based methods were very close. 348 Similar results were observed in a previous study for 349 such simple model (1-compartment model), where the 350 performance of those estimation methods were found to 351 be nearly equal [5].
352 On the other hand, rRMSE values for the three
BAYES-353 based methods were significantly higher for both
fixed-354 and random-effect parameters at higher levels of IIV. The
355 higher rRMSEs were due to the wider spread of outliers,
356 more so at higher levels of IIV. A similar trend of rRMSE
357 of estimated parameters was observed using BAYES
358 methods by Johansson et al., where the highly distorted
359 rRMSE rendered the estimated parameters meaningless
360 [9]. The performances of the BAYES-based methods were
361 poor, with high bias and low precision. Even with the
362 utilization of true values for all initial parameters, the
363 BAYES(F) method was not able to estimate parameters
364 close to the true values. Similarly, the median REE for all
365 three methods based on the BAYES-method was
com-366 paratively higher for fixed-effect parameters and
signifi-367 cantly higher for random-effect parameters, compared
368 with those of the classical FOCE-I method. There was also
369 a general trend of an increase in REE (positive) with an
370 increase in IIV. These observations with BAYES-based
371 methods can be attributed to the way in which the BAYES
372 method estimates the parameters i.e., by generating a large
373 set of probable population parameters and variance
374 parameters that represent the distribution according to
375 their ability to fit the data [11]. Therefore, the limited
376 number of subjects used in the study may be the reason
377 for the poor performance of the three BAYES-based
378 methods. However, a previous study showed that the
379 BAYES method can provide robust estimates of complex
380 PK/PD models with rich data and reliable priors [10].
381 The classical estimation method, FOCE-I, and
max-382 imum likelihood EM-based BAYES method differ in
383 their convergence criteria, where the former is based on
384 changes in the parameter estimation gradient and are
385 tested by default, and the latter is based on changes in
386 objective function value and parameter estimates. The
387 BAYES method can also define the convergence test
388 type, and one can choose from no test, tests accessing
389 changes in objective function, thetas and sigmas only,
390 the addition of diagonals of omegas, or the addition of
391 all omegas. For these reasons, the convergence rate was
392 not included as a factor for comparison of estimation
393 methods. However, all four methods tested at any level
394 of IIV showed a 100% convergence rate. Additionally, in
395 all estimation methods, the default or generally used
396 values were used for options in the $ESTIMATION
397 block. It is possible to optimize the outcomes by
chan-398 ging the values for different options in $ESTIMATION
399 block [4]. However, this aspect of the estimation method
400 was not compared, as this study only explored the
prac-401 tice of most users.
402 In this study, FOCE-I, the classical method, performed
403 better with lower bias and higher precision compared
404 with other BAYES-based methods. Moreover, the
406 other new methods [9, 12]. The work presented here 407 compares a classical estimation method, FOCE-I, and 408 BAYES method, with different options in the $ESTIMA-409 TION block and fixed OMEGA values (BAYES(C), 410 BAYES(F), and BAYES) for population analysis of data 411 with a low number of subjects (n= 6). Moreover, the 412 models built had only one compartment, with basic PK 413 parameters and random effects on two PK parameters. 414 Therefore, it should be noted that the structure and 415 complexity of a model might vary (increase or decrease) 416 in different pharmacometric projects or within the same 417 project from the initial to final step. In contrast to our 418 study, other studies have shown that for complex models 419 with highly non-linear functions [12], highly skewed 420 count distributions [13, 14], and/or low variability or 421 very rare events [15], the classical methods exhibit 422 marked bias and impression. Additionally, the selection 423 of an estimation method for a particular modeling pro-424 ject can depend on various aspects including bias, preci-425 sion, robustness, runtime, data type, timeframe of 426 project, application of results etc. which are objective in 427 nature as well as subjective aspect such as preference for 428 particular estimation method based on knowledge and 429 previous experience. Ultimately, a pharmacometrician 430 needs to make a choice for an estimation method based 431 on multiple aspects.
432 The data sets used in this study, unlike real clinical 433 data, were simulated. IIV for all PK parameters were 434 assumed to be the same for an individual; i.e., IIV 435 was either 5%, 10%, 20%, 30%, 50%, or 80% for Ka,
436 CL/F, and Vd/F. In clinical scenarios, the CV may
437 vary widely among the PK parameters within an indi-438 vidual. Therefore, to access the relevance of results 439 obtained from simulated data, a clinical data of theo-440 phylline involving 12 subjects, THEO data set, was 441 used as a case study. The limitation of using real data 442 is that the expected true parameters value is un-443 known. So, SSE was performed, where the parameter 444 estimates from final THEO model was considered to 445 be true parameters. And the parameter estimates 446 from different estimation methods were compared to 447 so-called true values for compare their performance. 448 Similarity in the performance of all four estimations 449 methods at lower IIV and better performance of 450 FOCE-I methods at higher IIV was demonstrated by 451 the rRMSE and REE of the estimated parameters. 452 This further supports the results from the simulated 453 data. Another limitation of this study is that only 454 FOCE-I and BAYES methods were tested and com-455 pared. To further explore the best estimation method 456 when dealing with a low number of subjects, other 457 methods in NONMEM, such as LAPLACE, ITS, IMP, 458 IMPMAP, and SAEM should also be evaluated in 459 future studies.
460
Conclusions
461 The FOCE-I, a classical estimation method, yielded better
462 results in terms of bias and precision across all levels of IIV
463 in comparison to three variations of BAYES estimation
464 methods. The difference in performance between FOCE-I
465 and three BAYES estimation methods in estimating
fixed-466 effect parameters were significant only at the IIV level
467 greater than 30%. The bias and imprecision of
random-468 effect parameters were higher compared with fixed-effect
469 parameters, however, it was consistently lower for FOCE-I
470 method compared to those estimated using BAYES(C) and
471 BAYES methods. These results were further supported by
472 the results from the THEO data, where clinical data was
473 used to simultaneously simulate and estimate PK
parame-474 ters using FOCE-I and three BAYES estimation methods.
475 In conclusion, the classical FOCE-I method estimated
476 the PK parameters more reliably than the BAYES
477 method when using a simple model and data containing
478 only a few subjects. After the base modeling step is
479 complete and/or at the pivotal modeling step, use of
480 other EM-based estimation methods can be considered
481 for adapting to specific needs of the project.
482
Additional files
483 485 Additional file 1:rRMSE plot for THEO data set. Relative root mean
486 square error (rRMSE) of fixed-effect and random-effect parameters from
487 THEO data set using FOCE-I (●), BAYES(C) (▲), BAYES(F) (■) and BAYES
488 (┼) estimation methods. (PDF 6 kb)
489 Additional file 2:REE box for THEO data set. Box-plot of relative
estima-490 tion error (REE) of fixed-effect and random-effect parameters from THEO
491 data set using FOCE-I, BAYES(C), BAYES(F) and BAYES estimation methods.
492 (PDF 8 kb)
493
Abbreviations
494
BAYES:Markov chain Monte Carlo Bayesian; BAYES(C): First-order conditional 495 estimation with interaction and Markov chain Monte Carlo Bayesian
496 composite method; BAYES(F): Markov chain Monte Carlo Bayesian with
497 variance parameter fixed to true value; CL/F: Apparent clearance;Ɛ: Residual
498 variability; EM: Expectation maximisation; FOCE: First-order conditional
499 estimation; FOCE-I: First-order conditional estimation with interaction;
500 IIV: Inter-individual variability; IMP: Important sampling; IMPMAP: Important
501 sampling assisted by mode a posterior; ITS: Iterative two-stage;
502 Ka: Absorption rate constant;ƞ: Inter-individual variability;
503 PK: Pharmacokinetic; REE: Relative estimation error; rRMSE: Relative root mean
504 square error; SAEM: Stochastic approximation expectation maximization;
505 SSE: Stochastic simulation and estimation; Vd/F: Apparent volume of
506
distribution Q2
507
Acknowledgements
508 Not applicable.
509
Funding
510 This research was supported by the Basic Science Research Program through
511 the National Research Foundation of Korea (NRF), funded by the Ministry of
512 Science, ICT & Future Planning (Grant 2009-0093815 and 2014R1A1A1006006)
513 and supported by a grand of the Korea Health Technology R&D Project
514 through the Korea Health Industry Development Institute (KHIDI), funded by
515 the Ministry of Health & Welfare, Republic of Korea (Grand number:
516 HI17C0927).
517 This work was also supported by research funds from Chungnam National
519 Availability of data and materials
520 Data used in this study was simulated in NONMEM using SSE tool. THEO 521 data used as a case study is available in the NONMEM distribution media.
522 Authors’contributions
523 SP and BS made substantial contributions to conception and design of the 524 study and performed the simulation and estimation part with assistance 525 from JL. SP and BS drafted the manuscript. JC, KIK, HB and NH assisted in 526 critical analysis and interpretation of data as well as revising the contents 527 critically for every draft of the manuscript. This work was performed under 528 direct supervision and guidance of KK and HY, they guided the team from 529 initial concept of the project through many iterative modifications in 530 methods, data analysis and interpretation, critically revising every draft of 531 manuscript and approving final version to be submitted. All authors agree to 532 be accountable for all aspects of the work in ensuing the questions related 533 to the accuracy or integrity of any part of the work are appropriately 534 investigated and resolved.
535 Ethics approval and consent to participate
536 Not applicable.
537 Consent for publication
538 Not applicable.
539 Competing interests
540 The authors declare that they have no competing interests.
541 Publisher’s Note
542 Springer Nature remains neutral with regard to jurisdictional claims in 543 published maps and institutional affiliations.
544 Author details
545 1College of Pharmacy, Chungnam National University, Daejeon 34134,
546 Republic of Korea.2Academic Planning Department, Yonsung Fine
547 Chemicals, Suwon 16675, Republic of Korea.3Department of Pharmacy,
548 Faculty of Science, National University of Singapore, Singapore 117543,
549 Singapore.4College of Pharmacy, Korea University, Sejong 30019, Republic of
550 Korea.5College of Pharmacy, Chungnam National University, Daejeon
551 305-764, South Korea.
552 Received: 25 January 2017 Accepted: 15 November 2017 553
554 References
1.
555 Duffull SB, Wright DF, Winter HR. Interpreting population pharmacokinetic-556 pharmacodynamic analyses - a clinical viewpoint. Br J Clin Pharmacol. 2011; 557 71(6):807–14. https://doi.org/10.1111/j.1365-2125.2010.03891.x.
2.
558 Mould DR, Upton RN. Basic concepts in population modeling, simulation, 559 and model-based drug development-part 2: introduction to
560 pharmacokinetic modeling methods. CPT Pharmacometrics Syst Pharmacol. 561 2013;2:e38. https://doi.org/10.1038/psp.2013.14.
3.
562 Wang Y. Derivation of various NONMEM estimation methods. J 563 Pharmacokinet Pharmacodyn. 2007;34(5):575–93. https://doi.org/10.1007/ 564 s10928-007-9060-6.
4.
565 Gibiansky L, Gibiansky E, Bauer R. Comparison of Nonmem 7.2 estimation 566 methods and parallel processing efficiency on a target-mediated drug 567 disposition model. J Pharmacokinet Pharmacodyn. 2012;39(1):17–35. https:// 568 doi.org/10.1007/s10928-011-9228-y.
5.
569 Liu X, Wang Y. Comparing the performance of FOCE and different 570 expectation-maximization methods in handling complex population 571 physiologically-based pharmacokinetic models. J Pharmacokinet
572 Pharmacodyn. 2016;43(4):359–70. https://doi.org/10.1007/s10928-016-9476-y. 6.
573 Beal SL, Sheiner LB, Boeckmann AJ, Bauer RJ. NONMEM 7.3.0 User Guides. 574 ICON Dev Solut. 2013;
Q5
7.
575 Keizer RJ, Karlsson MO, Hooker A. Modeling and simulation workbench for 576 NONMEM: tutorial on Pirana, PsN, and Xpose. CPT Pharmacometrics Syst 577 Pharmacol. 2013;2:e50. https://doi.org/10.1038/psp.2013.24.
8.
578 R Development Core Team. R: a language and environment for statistical 579 computing. Vienna, Austria: R Foundation for Statistical Computing; 2014.
9.
580 Johansson AM, Ueckert S, Plan EL, Hooker AC, Karlsson MO. Evaluation of 581 bias, precision, robustness and runtime for estimation methods in NONMEM
582 7. J Pharmacokinet Pharmacodyn. 2014;41(3):223–38. https://doi.org/10.
583 1007/s10928-014-9359-z.
10. Bauer RJ, Guzy S, Ng C. A survey of population analysis methods and 584 585 software for complex pharmacokinetic and pharmacodynamic models with
586 examples. AAPS J. 2007;9(1):E60–83. https://doi.org/10.1208/aapsj0901007. 11. Bauer RJ. Technical guide on the expectation-maximization population 587
588 analysis methods. ICON Dev Solut. 2013;
12. Plan EL, Maloney A, Mentre F, Karlsson MO, Bertrand J. Performance 589 590 comparison of various maximum likelihood nonlinear mixed-effects
591 estimation methods for dose-response models. AAPS J. 2012;14(3):420–32.
592 https://doi.org/10.1208/s12248-012-9349-2.
13. Plan EL, Maloney A, Troconiz IF, Karlsson MO. Performance in population 593 594 models for count data, part I: maximum likelihood approximations. J
595 Pharmacokinet Pharmacodyn. 2009;36(4):353–66. https://doi.org/10.1007/
596 s10928-009-9126-8.
14. Savic R, Lavielle M. Performance in population models for count data, part II: 597 598 a new SAEM algorithm. J Pharmacokinet Pharmacodyn. 2009;36(4):367–79.
599 https://doi.org/10.1007/s10928-009-9127-7.
15. Karlsson KE, Plan EL, Karlsson MO. Performance of three estimation methods 600 601 in repeated time-to-event modeling. AAPS J. 2011;13(1):83–91. https://doi.
602 org/10.1208/s12248-010-9248-3.
• We accept pre-submission inquiries
• Our selector tool helps you to find the most relevant journal
• We provide round the clock customer support
• Convenient online submission
• Thorough peer review
• Inclusion in PubMed and all major indexing services
• Maximum visibility for your research
Submit your manuscript at www.biomedcentral.com/submit