R E S E A R C H
Open Access
Evaluating the intersection of a regional wildlife
connectivity network with highways
Samuel A Cushman
1*, Jesse S Lewis
2and Erin L Landguth
3Abstract
Background:Reliable predictions of regional-scale population connectivity are needed to prioritize conservation actions. However, there have been few examples of regional connectivity models that are empirically derived and validated. The central goals of this paper were to (1) evaluate the effectiveness of factorial least cost path corridor mapping on an empirical resistance surface in reflecting the frequency of highway crossings by American black bear, (2) predict the location and predicted intensity of use of movement corridors for American black bear, and (3) identify where these corridors cross major highways and rank the intensity of these crossings.
Results:We used factorial least cost path modeling coupled with resistant kernel analysis to predict a network of movement corridors across a 30.2 million hectare analysis area in Montana and Idaho, USA. Factorial least cost path corridor mapping was associated with the locations of actual bear highway crossings. We identified corridor-highway intersections and ranked these based on corridor strength. We found that a major wildlife crossing overpass structure was located close to one of the most intense predicted corridors, and that the vast majority of the predicted corridor network was“protected”under federal management. However, narrow, linear corridors connecting the Greater Yellowstone Ecosystem to the rest of the analysis area had limited protection by federal ownership, making these additionally vulnerable to habitat loss and fragmentation.
Conclusions:Factorial least cost path modeling coupled with resistant kernel analysis provides detailed, synoptic information about connectivity across populations that vary in distribution and density in complex landscapes. Specifically, our results could be used to quantify the structure of the connectivity network, identify critical linkage nodes and core areas, map potential barriers and fracture zones, and prioritize locations for mitigation, restoration and conservation actions.
Keywords:American black bear, Connectivity, Corridor, Crossing structures, Highways, Northern Rocky Mountains, Road effects, UNICOR
Background
Population connectivity is important for maintaining genetic diversity and demographic exchange in regional populations [1-3], and for species to shift geographic ranges in response to climate change [4]. As a result, evaluating population connectivity and mapping linkage zones are of high importance in the face of increasing habitat loss and fragmentation and the threat of climate change [5-7]. Roads are unprecedented features in the ecological history of landscapes and potentially affect
many ecological processes [8-10]. For example, road density has strong negative relationships to habitat qual-ity and is one of the most powerful predictors of occur-rence for many large mammals, such as grizzly bears [11,12], elk [13-15], and wolves [16-18]. In addition, car-nivores are often particularly sensitive to habitat loss and fragmentation given their large area requirements and sensitivity to human disturbance, and are frequently used as focal species to guide broad-scale landscape connectiv-ity planning [19-24].
Many past population connectivity assessments have focused on narrow linear corridors of habitat between core populations [25-27]. Although small, narrow, lin-ear habitat corridors can be important in some land-scapes (e.g., areas with high habitat fragmentation), it * Correspondence:[email protected]
1
U.S. Forest Service, Rocky Mountain Research Station, 2500 S Pine Knoll Dr., Flagstaff, AZ 86001, USA
Full list of author information is available at the end of the article
is increasingly recognized that connectivity planning must be applied to broad landscapes to conserve plant and ani-mal populations [2,28-31]. It has been argued that the nar-row focus on movement among discrete habitat patches via narrow linear corridors should be subsumed as a spe-cial case of the general process of organisms traversing re-sistant landscapes [32,33], and that identifying areas where organism movement is concentrated or where it is blocked is a fundamentally important task in guiding conservation [33]. Thus, an important goal in applied movement ecol-ogy is intersecting predicted corridor networks with road networks across broad landscapes to identify and prioritize corridors and recommend where the potential impacts of roads on animals can be mitigated.
Reliable prediction of corridor networks for animals depends on knowledge of three things: (1) the distribu-tion and abundance of the species, (2) the dispersal and movement ability of the species and (3) the pattern of differential movement cost, or resistance, across the landscape [34,35]. Resistance models used to predict connectivity should be based on empirical data that reli-ably reflect the effects of landscape features on organism movement [36]. However, the vast majority of connectivity analyses have used resistance maps that are based on un-validated expert opinion [34,36]. Reliable predictions of population connectivity should be based on resistance sur-faces that are empirically derived [37], and ideally pro-duced through multi-step empirical modeling (sensu [36]). For example, there is particular value in estimating resist-ance through several methods using independent data. However, very few examples of empirically validated resist-ance surfaces produced with multiple methods applied to independent data exist (but see [38,39]).
In this paper we evaluated regional connectivity for
American black bear (Ursus americanus) populations
and specifically evaluate the intersection of the network of predicted corridors with highways. Cushman et al. [40] used individual-based landscape genetics analysis to pre-dict landscape resistance for black bear in the northwest-ern part of the analysis area, and found that population connectivity is facilitated by middle elevation forest and resisted by non-forest areas and roads. Subsequently, Cushman and Lewis [38] tested the validity of this resist-ance map using independent movement data and con-firmed the relationships between landscape resistance, forest cover, human land use and roads. Further valid-ation was conducted through process-pattern modeling with this resistance map using spatially-explicit, individual-based simulations [41,42]. Short Bull et al. [39] evaluated the consistency of this resistance model by conducting a meta-replicated landscape genetics study in which the same candidate resistance hypotheses were tested in 12 analysis areas across the northern Rocky Mountains, and confirmed that forest cover at middle elevations facilitates
movement and roads and non-forest land cover resist it across the full extent of the present analysis area.
Our goal in this paper was to use the resistance map produced and validated in these earlier studies to predict the location and strength of movement corridors across a 30.2 million hectare analysis area in Montana and Idaho, USA, and identify locations where predicted corridors intersect major highways. Our analysis is motivated by four objectives. First, we evaluated the effectiveness of factorial least cost path corridor mapping on an empir-ical resistance surface in reflecting the frequency of highway crossings by American black bear. Second, we predicted the location and intensity of movement corri-dors for American black bear. Third, we identified where these corridors cross major highways and rank the inten-sity of these crossings. Finally, we evaluated the optimality of placement of 34 recently created crossing structures on one stretch of highway in the analysis area for black bear movement.
Results and discussion
Location and intensity of movement corridors
The results are based on least cost corridor modeling on an empirically derived resistance surface (Figure 1), which reflects relative movement cost across the land-scape [3,38]. Our factorial least cost path analysis pre-dicted the strength of movement corridors across this resistance map, producing a gradient of corridor intensity across the analysis area (Figure 2). A total of just over 30% of the 30.2 million hectare analysis area was pre-dicted to be covered by our least cost corridor network (Table 1). The proportion of the landscape covered by different corridor intensities declined rapidly with in-creasing corridor intensity. For example, just over 2% of the analysis area was covered by corridors of intensity 100 or greater, and less than 1/10thof 1% of the analysis area was covered by corridors of intensity greater than 500 (Table 1).
edge of the Bob Marshall Wilderness Complex to the Greater Yellowstone Ecosystem along the Big Belt and Little Belt Mountains (Figure 2c).
The network of predicted least cost corridors also shows extensive areas of lesser corridor intensity (Figure 2). Areas where the landscape is highly permeable and in which the optimal least-cost route is only marginally more optimal than alternative routes are indicated by wide areas of lesser corridor intensity. Conversely, areas where the predicted corridor routes are narrow indicate locations in the analysis area where local landscape resistance surrounding the opti-mal corridor route is high, constraining available move-ment path choices.
Intersection of the least cost corridor network with federally managed lands shows that most of the predicted corridor network is on public land (Table 1, Figure 3). For example, over 75% of the total predicted corridor network is on federal lands (Table 1), and the proportion increases for the portions of the corridor network of highest intensity, such as over 90% of the corridors with intensity value of 500 or greater occur on federal lands. This is particularly true in the western part of the analysis area. In the eastern and southeastern parts of the analysis area public land is less extensive and generally concentrated along north–south oriented moun-tain ranges. The dominant predicted corridor routes
run along these ranges, but there are multiple locations where they traverse private land and low elevation, non-forested valleys.
Effectiveness of corridor mapping in predicting highway crossings by American black bear
We evaluated the effectiveness of our corridor network in predicting highway crossing locations of black bears in northern Idaho. The corridor intensity was higher for bear crossing locations (median corridor intensity of 56 observations was 115.84, while mean and stand-ard deviation of the medians of 1x10⁶spatial randomi-zations were 83.8 and 23.6, respectively). Only 7.5% of
the 1x10⁶randomizations produced a median corridor
intensity larger than that of the 56 bear highway cross-ing locations, indicatcross-ing that corridor intensity predic-tions for the interpolated bear crossing locapredic-tions were higher than expected based on the available crossing locations.
Intersection of corridors and highways
We identified all locations where predicted corridor routes crossed major highways. We ranked these by cor-ridor intensity at the crossing location, and mapped the 200 locations with the highest intensities (Figure 3). These intersections are potential barrier locations, given
that they are places where potentially important move-ment routes intersect potentially important barriers (high-ways), and are clustered in the central and south-central parts of the analysis area. In contrast there are relatively few potential major corridor intersections with highways
in the Northern Continental Divide, Central Idaho, and Idaho-Panhandle-Northwest Montana regions. The rank-ing, geographical coordinates, and corridor intensity values of these crossings are in Additional file 1.
Evaluating potential effectiveness of existing crossing structures for black bear
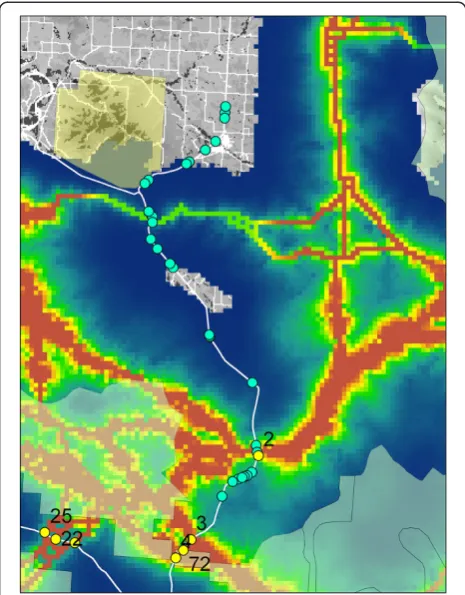
We evaluated the potential effectiveness of a wildlife crossing structure project recently completed along U.S. 93 between Evaro Hill and Ronan, Montana, for black bears. Figure 4 shows the locations of the crossing struc-tures relative to the predicted major corridor crossing locations. There are two crossing structures placed at the second most intense corridor location in the entire analysis area (Figure 4). Importantly, one of these struc-tures is a major wildlife overpass bridge, which entailed the largest capital investment and was intended to be the keystone linkage in the crossing structure system. There are three crossing structures co-located with an-other relatively weak predicted corridor route near the junction of U.S. 93 and Hwy 200.
Table 1 Extent of corridors of differentintesnsity and percent protected by federal management
Corridor strength Hectares Percent federal
> 0 9,106,597 75.1
> 100 683,014 82.2
> 200 231,776 80.0
> 300 90,551 72.2
> 400 41,959 80.6
> 500 12,139 92.6
>0–all predicted corridors, > 100–predicted corridors with intensity greater than 100, >200–predicted corridors with intensity greater than 200, >300– predicted corridors with intensity greater than 300, >400–predicted corridors with intensity greater than 400, >500–predicted corridors with intensity greater than 500. Intensity is defined as the concentration of number of least cost routes predicted to traverse a given cell.
Predicting synoptic regional population connectivity
Our project provides one of the first synoptic evaluations of population connectivity for a wildlife species across a regional analysis area based on an empirically developed and empirically verified resistance map. Our analysis is strengthened by its use of a resistance map that was de-rived from empirical optimization of genetic differenti-ation in reldifferenti-ation to multiple landscape variables [40], and which was subsequently verified in a large meta-replicated landscape genetics study [39] and by a study linking move-ment path selection to genetic differentiation [38]. Further-more, the analysis reported here verifies that the corridors predicted on the basis of this resistance map have some success predicting the actual locations where black bears have been recorded crossing a major federal highway in the analysis area. Locations where bears were observed crossing the highway were on average 38% higher in pre-dicted corridor intensity than locations where they were not, and the randomization test showed modestly signifi-cant difference in the probability of crossing based on cor-ridor intensity (p = 0.075).
Many previous regional scale connectivity approaches model movement from a small number of source patches
to a small number of destination patches (e.g., [43,44]; but see [45,46]), which may oversimplify the characterization and distribution of habitat patches and exclude multiple core patches from the analysis. The framework we adopted incorporates additional information about how landscape resistance across broad landscapes affects regional con-nectivity synoptically across a vast land area, which enables the identification of key nodes of connectivity, ranking of corridor intensity, and prioritizing locations for mitigation action based on the potential severity of impacts of roads on important predicted corridors.
Cushman et al. [32] used a variation of the factorial least cost path analysis presented here to evaluate popu-lation connectivity for American black bear between the Greater Yellowstone Ecosystem and the Canadian border, and highlighted two main routes with limited width and crossing more than 20 potential highway barriers between the Greater Yellowstone Ecosystem and the Northern Continental Divide Ecosystem and Canada. That analysis, however, provided no additional information on synoptic connectivity across the analysis area, and is limited to in-ferences about connectivity between Yellowstone to the Canadian border, while this analysis enables predicting of
connectivity from any location to any other location in the analysis area. However, boundary effects, which are inher-ent with broad-scale analyses, might be presinher-ent and evalu-ating connectivity at even broader extents would provide a clearer depiction of connectivity to adjoining areas in the US and Canada.
The analysis presented here is consistent with the find-ings of Cushman et al. [35] who predicted the existence of narrow predicted corridors linking Greater Yellowstone to the rest of the analysis area, and also provides additional prediction of connectivity from location to location across the entire region. The results highlight two important pat-terns. First, the existence of major connectivity“nodes”of high corridor intensity depict the major routes predicted to be dominantly important in regional connectivity for black bear. Second, this analysis combined the use of factorial least cost path modeling to locate optimal move-ment routes with resistant kernels to evaluate the select-ivity of these optimal routes relative to the resistance of the local landscape in which they are embedded. This allowed us to evaluate the locations of the landscape
where connectivity is“funneled”along the least cost corri-dors due to restricted movement driven by high resistance of the surrounding landscape, and identify regions where the surrounding landscape is nearly as suitable for move-ment as the predicted corridor route and likely to receive nonlocalized use in movement.
The overlay of the predicted corridor connectivity net-work with federal land and highways indicated three important things. First, the vast majority of the
corri-dor network is “protected” under federal management
(Table 1). This is consistent with Cushman et al. [23] who found that for species, such as the American black bear, that are associated with mid-to-high elevation forest, fed-eral lands protected the vast majority of the connectivity network. However, they also found that species associated with lower elevations and non-forest habitats were very poorly protected by the network of federal lands. Thus, our results for American black bear do not suggest high regional connectivity and high sufficiency of protected lands for species associated with different habitats. Second, the pattern of major intersections of the corridor network with highways shows that in the western and northern parts of the analysis area there are relatively few“major” corridor-highway crossings given that there are many al-ternative movement routes through these well connected landscapes coupled with relatively few major highways. In the central part of the analysis area there are somewhat more restricted movement corridors among more strongly defined mountain ranges separated by large valleys and a higher density of major highways, leading to the highest density of major intersections between highways and pre-dicted movement corridors. Third, the prepre-dicted corridors connecting the Greater Yellowstone Ecosystem to the rest of the analysis area are those that also have the least complete protection by federal ownership. This makes them additionally vulnerable to habitat loss and fragmen-tation as the population grows and private land is devel-oped. As previously found by Cushman et al. [32], there are a number of locations where narrow and restrictive movement corridors between the Greater Yellowstone Ecosystem and other parts of the analysis area intersect major highways.
Evaluating the optimality of wildlife crossing structure placement
In the past several decades enormous investments have been made to install highway crossing and fencing struc-tures to reduce wildlife-vehicle collisions while enabling wildlife to traverse the landscape [47-50]. In most cases the placement of these structures has been guided by ei-ther expert opinion or fine scale data about local animal movements in proximity to the highway [48,51]. Few ef-forts have evaluated optimality of placement of crossing structures relative to broad-scale connectivity across the
population. Predicting optimal placement of highway crossing structures is critical to ensure they accomplish their objectives of maintaining regional scale population connectivity.
The US Highway 93 reconstruction project in Montana is one of the most extensive wildlife-sensitive highway in-stallations in North America [49], involving 41 fish- and wildlife crossing structures and extensive wildlife exclusion fencing. Our results indicated that several of these wildlife crossing structures were located close to some of the strongest predicted corridors in the analysis area. In par-ticular, a major wildlife overpass bridge structure, by far the largest and most important structure installed, was located at our second highest ranked corridor-highway crossing location in the entire analysis area. While the sit-ing of these crosssit-ing structures was not intended to be op-timal for black bear movement, it is encouraging that the design seems to provide substantial connectivity for this forest generalist species.
The regional-scale connectivity map we produced and the locations and ranking of intersections with the high-way network could be of utility in future efforts to design and locate wildlife highway crossing structures in other parts of the analysis area. The ranking of the 200 most in-tense corridor-highway intersections could be used to guide crossing structure placement and be compared to other studies that evaluated habitat selection of road cross-ing location at multiple spatial extents (e.g., [52]). Black bear could potentially be used as a surrogate to protect generalist forest mammals (e.g. [7]); however, recent re-search suggests that black bears might not act as an effect-ive connectivity umbrella for many other species (e.g. [53]).
Validation of predicted corridors
Corridors produced by modeling have been criticized for lacking supporting movement data [29,30] and because they may contain errors in model parameters or incor-rect assumptions [37]. Our study mitigated this by using a resistance map that was empirically optimized [40], verified in a large-scale meta-replicated study [39], tested against a large sample of movement data [38], and vali-dated by pattern-process modeling [33,41]. However, an-other key consideration is the degree to which dispersing American black bears select paths that match the predic-tions of our corridor network. Several field studies have evaluated the efficacy of existing corridors [54,55] and cor-ridors constructed as part of landscape-level experiments [56,57]. However, formal evaluation of the performance of corridors has rarely been done at landscape scales [42]. Our analysis is one of the first to use independent move-ment data to validate predicted corridor networks, and verified that the intensity of our predicted corridors was related to the locations where bears crossed a major highway. Our randomization test results were moderately
strong (p = 0.075 with 38% effect size), and there are sev-eral possible reasons why they were not stronger. First, the resistance map was produced by optimizing landscape resistance in relation to the genetic structure of the popu-lation and the movement data were taken from adult resi-dent bears. Gene flow is mediated primarily by juvenile dispersal, and this may not be governed by the same fac-tors that drive movement of adults within permanent home ranges. Cushman and Lewis [38] evaluated how well a resistance layer produced by analyzing movement path-ways of resident adult black bears matched that produced by landscape genetic analysis of gene flow within this study area. They found a general agreement, with both models supporting low resistance for forest and middle el-evations, and both suggesting higher resistance for non-forest, roads and high elevation areas. The models did dif-fer in the relative resistance of these variables, however, which could partly explain the modest effect size seen in the randomization test reported here.
Conclusions
Factorial least cost path modeling coupled with resistant kernel analysis provides detailed, synoptic information about connectivity across populations that vary in distri-bution and density in complex landscapes. We identified several “linkage nodes” where a large number of least cost routes were funneled through the same cells. These are predicted to be the dominant routes for movement and gene flow of black bear across the analysis area. Con-versely, we identified a number of areas where there were predicted to be no movement paths. These are predicted to be barriers for black bear movement. The vast majority of the predicted corridor network was “protected” under federal management. However, narrow, linear corridors connecting the Greater Yellowstone Ecosystem to the rest of the analysis area had limited protection by Federal own-ership, making them particularly vulnerable to habitat loss and fragmentation. The ranking of intensity of corridor-highway intersections (Additional file 1) may be of use in prioritizing locations for conservation or mitigation, and in optimizing the siting of projects aimed at enhancing permeability of highways to black bear dispersal. Specific-ally, our results could be used to quantify the structure of the connectivity network, identify critical linkage nodes and core areas, map potential barriers and fracture zones, and prioritize locations for mitigation, restoration and conservation actions.
Methods Analysis area
Fish and Wildlife Service and Bureau of Land Manage-ment. The analysis area also includes extensive private land, mainly in the large valleys which lie between major mountain ranges. The human population in the analysis area is growing more rapidly than most areas of the United States (U.S. Census Data), and is concentrated in these val-ley locations. In addition, an extensive network of Federal, State and Interstate highways traverses the analysis area, potentially impeding animal movement.
Resistance map
The genetic characteristics of individuals sampled across landscapes allows one to identify population units, localize genetic barriers, and quantify the influence of landscape features on gene flow [58,59]. Cushman et al. [40] pre-dicted landscape resistance to black bear gene flow in a sub-region of the analysis area using a multi-model least cost-path analysis based on molecular genetics. Their ana-lysis identified forest cover and elevation as major factors affecting gene flow, with gene flow facilitated by closed canopy forest at middle elevations and resisted by non-forest and extremely high elevations (Figure 1). Subse-quently, Short Bull et al. [39] evaluated the generality of the Cushman et al. [40] resistance map by evaluating the same suite of hypotheses regarding landscape effects on gene flow in eleven additional analysis areas distributed across Montana. They confirmed that elevation, forest cover and roads had strong influences on gene flow, supporting the generality of the Cushman et al. [40] resistance model.
The strongest inferences about landscape resistance to movement and gene flow are yielded by studies in which several methods and datasets yield convergent results. Cushman and Lewis [38] utilized this approach to evalu-ate the degree to which movement behavior of individual black bears explained the pattern of genetic differenti-ation described in Cushman et al. [40]. Their study con-firmed that black bear movement path selection was driven by elevation, forest cover, roads and human land use, consistent with the landscape resistance model in-ferred from landscape genetic analyses by Cushman et al. [40]. In this study, we apply the Cushman et al. [40] resist-ance model across the full extent of the analysis area and use it as a base for factorial least cost path analyses.
Least cost path analysis
We predicted the extent and strength of the corridor network for black bears across the analysis area with a combination of factorial least cost path and resistant ker-nel analysis, using the UNICOR software [60]. The factor-ial least cost path analysis maps the least cost routes among all combinations of source locations distributed at 5 km spacing across all forested areas in the analysis area, amounting to a total of 3,837 points. UNICOR uses
Dijkstra’s algorithm [61] to solve the single source shortest path problem from every mapped source location on a landscape to every other source location [60], pro-ducing predicted least-cost path routes from each source point to each destination point (7,359,366 individual least cost paths).
These least cost paths are single pixel in width, and record the route of a least cost path from the source to the destination pixel. Animals utilizing real landscapes are unlikely to know and use these narrow optimal paths. To more realistically represent the probability of utilization of each location in the landscape as a move-ment path we used a cost-kernel to predict relative cost of using pixels in the vicinity of the least cost path. This was accomplished in two steps. First, we produced the cumulative least cost path network by summing all indi-vidual least cost paths among indiindi-viduals (e.g., [32]). The value of this summation is corridor intensity, and equals the number of least cost paths that pass through any given pixel. Second, we calculated resistant kernels [33,62] from each cell containing a link in the least-cost path network, with the volume of the kernel proportional to the value of the summed cumulative least cost path network at that lo-cation. Resistant kernels predict the extent and shape of the area reachable by dispersal from a source, based on a least-cost hull on a resistance surface. By placing these on every pixel within the factorial least cost path network and scaling the volume proportional to the corridor intensity at each pixel in the network, the resistant kernels produce a map of predicted corridors that are not restricted to sin-gle pixel least cost paths, but smoothed as a function of cumulative cost and corridor intensity. The kernels were calculated in UNICOR with a 10,000 m maximum disper-sal ability in ideal habitat (cells with resistance 1 in the resistance map).
of individual animals, lack of perfect knowledge of the sur-rounding environment, and the pattern of relative cost of different local movement choices across the landscape.
Validating predicted corridors
The corridor network produced in this analysis is based on least cost paths across a resistance surface that was derived from empirical analysis of gene flow across mul-tiple analysis areas and path-level analysis of bear move-ment behavior. However, the goal of this paper is to predict bear movement, in particular highway crossings. As such it is important to further validate the corridor predictions with observations of actual bear highway crossing locations. We use movement data obtained by Lewis et al. [52] to test the congruence of our predicted corridor network with the locations of actual bear high-way crossing events. Specifically, bears were trapped
from June to mid-August in 2004–2006 in the Purcell
Mountain range of northern Idaho using Aldrich foot snares [63] and fitted with Lotek 3300 L GPS collars. Collars were programmed to record a location every 20 min from April (den emergence) to November (den entrance) and information was stored on the collar, pro-viding consistent fine scale movement data with high fix rates and small location errors [52]. This movement data set provided 56 instances where collared bears crossed US Highway 95 in northern Idaho.
We used these instances of highway crossing as a dependent variable set to test the null hypothesis that the observed bear crossings do not depend on the con-nectivity score of the landscape, by comparing the 56 observed crossings to the distribution of 56 randomly sampled crossings. We sampled corridor intensity along the entire length of highway 95 within the analysis area at 30 m intervals. Corridor intensity is the value of the corridor grid at that location, and reflects the number of least cost paths among source locations that pass through that location. Heuristically, the intensity of the corridor grid reflects the relative probability of use of that location of the network. We evaluated the association between ac-tual bear crossings and the predicted corridor network through a spatial randomization test. The dependent vari-able in this randomization test is the median value of cor-ridor intensity for the 56 actual crossing locations. The randomization test conducts a random draw, without re-placement, of 56 locations from the population of all loca-tions along Highway 95 within the analysis area, and calculates the median corridor intensity of this random sample of potential highway crossing sites. We repeated this 1x10⁶times, and then compared the median corridor intensity of the 56 actual highway crossings, to the distri-bution of 1x10⁶ median corridor intensities of available highway crossings produced through the randomization. Spatial randomization testing of this kind is recommended
in cases, such as this, where there is spatial depend-ence among observations, and produces an unbiased estimate of the probability of the observed outcome given the data [64].
Intersecting corridors with highways
One of our primary goals was to identify where predicted corridors cross major highways and rank the intensity of these crossings across the full 30.2 million hectare analysis area. To accomplish this objective we intersected state, fed-eral and interstate highways with our predicted corridor network. We ranked these intersections based on the in-tensity of the corridor, as defined above, at the site of its intersection with the highway. We mapped the 200 inter-sections of the corridor network with highways that had the highest corridor intensity.
Evaluating the optimality of a wildlife highway crossing structure project
The US Highway 93 (US 93) reconstruction project in-stalled 41 fish- and wildlife crossing structures and ap-proximately 26.7 km of wildlife exclusion fencing. The mitigation measures were aimed at improving safety for the traveling public through reducing wildlife-vehicle colli-sions and allowing wildlife to continue to move across the landscape and the road. Both the road length and number of wildlife crossing structures in the US 93 project make it the most extensive mitigation project of its kind in North America to date [49]. Thirty-four of the 41 crossing struc-tures are deemed suitable for usage by bears (M. Sawaya pers. comm.). We evaluated the location of these relative to our predicted movement corridors to assess the opti-mality of placement relative to the regional-scale corridor network.
Availability of supporting data
The data sets supporting the results of this article are available in the University of Montana Computational Ecology Laboratory repository, [unique persistent identi-fier and hyperlink to dataset(s) in http://format].
Additional file
Additional file 1:Listing of the 200 most intense intersections of the predicted corridor network and highways, as ranked by the intensity value of the corridor network at the location of the highway intersection.X and Y are coordinates of the crossing in an Albers conformal conic projection. Latitude and Longitude are coordinates in decimal degrees. Datum is NAD83.“Corridor”is the corridor network intensity at the location of the highway intersection. Parameters of the Albers projection: False_Easting: 600000; False_Northing: 0; Central_Meridian: -109.5; Standard_Parallel_1: 46.0; Standard_Parallel_2: 48.0; Latitude_Of_Origin: 44.0.
Competing interests
Authors’contributions
SC developed the resistance model, designed the study, developed the coupling of factorial least cost path with resistant kernel analysis, ran the analysis, and was primarily responsible for writing the paper. JL provided the bear movement data used to validate the corridor predictions, and contributed to the writing of the paper. EL was primarily responsible for developing the UNICOR modeling tool used for this analysis, and contributed to the writing of the paper. All authors read and approved the final manuscript.
Acknowledgements
Funding for this analysis was provided by the U.S. Forest Service Rocky Mountain Research Station. We thank J.L.Rachlow, W.L. Wakkinen, J. Hayden, P. Zager, the Idaho Transportation Department, the University of Idaho, and Idaho Department of Fish and Game for support, guidance, and assistance in collecting movement data for black bears.
Author details
1U.S. Forest Service, Rocky Mountain Research Station, 2500 S Pine Knoll
Dr., Flagstaff, AZ 86001, USA.2Graduate Degree Program in Ecology, Department of Fish, Wildlife, and Conservation Biology, Colorado State University, Fort Collins, CO 80523, USA.3Division of Biological Sciences, University of Montana, Missoula, MT 59812, USA.
Received: 14 August 2013 Accepted: 11 October 2013 Published: 22 November 2013
References
1. Fahrig F:Effects of habitat fragmentation on biodiversity.Annual Review of Ecology, Evolution, and Systematics2003,34:487–515.
2. Crooks KR, Sanjayan M:Connectivity Conservation.Cambridge, UK: Cambridge University Press; 2006.
3. Cushman SA:Effects of habitat loss and fragmentation on amphibians: a review and prospectus.Biol Conserv2006,128:231–240.
4. Heller NE, Zavaleta ES:Biodiversity management in the face of climate change: a review of 22 years of recommendations.Biological conservation
2009,142:14–32.
5. Noss RF:A regional landscape approach to maintain biodiversity.
Bioscience1983,33:700–706.
6. Beier P:Noss RF:Do habitat corridors provide connectivity?Conserv Biol
1998,12:1241–1252.
7. Beier P, Majka DR, Spencer WD:Forks in the road: Choices in procedulres for designing wildland linkages.Conserv Biol2008,22:836–851. 8. Forman RTT:Estimate of the area affected ecologically by the road
system in the United States.Conserv Biol1995,14:31–35.
9. Forman RTT, Alexander LE:Roads and their major ecological effects.
Annual Review in Ecology and Systematics1998,8:629–644. 10. Trombulak SC, Frissell CA:Review of ecological effects of roads on
terrestrial and aquatic communities.Conserv Biol2000,14:8–30. 11. McLellan BN, Shackleton DM:Grizzly bears and resource-extraction
industries: effects of roads on behavior, habitat use and demography.
J Appl Ecol1988,25:451–460.
12. Nielsen SE, Stenhouse GB, Boyce MS:A habitat-based framework for grizzly bear conservation in Alberta.Biol Conserv2006,130:217. 13. Irwin LL, Peek JM:Elk habitat use relative to forest succession in Idaho.
J Wild Manage1983,47:664–672.
14. Lyon LJ:Road density models for describing habitat effectiveness for elk.
J For1983,81:592–595.
15. Cole EK, Pope DM, Anthony RG:Effects of road management on movements and survival of Roosevelt elk.J. Wild.Manage.1997,61:1115–1126.
16. Thiel RP:Relationship between road densities and wolf habitat suitability in Wisconsin.Am Midl Nat1985,113:404–407.
17. Fuller TK:Population dynamics of wolves in north-central Minnesota.
Wildl Monogr1989,105.
18. Mladenoff DJ, Sickley TA, Wydeven AD:Predicting gray wolf landscape recolonization: logistic regression models vs. new field data.Ecol Appl
1999,9:37–44.
19. Eisenberg JE:The density and biomass of trpical mammals.InConservation Biology: an Evolutionary-Ecological Perspective.Edited by Soule ME, Wilcox BA. Sunderland, MA: Sinauer Associates Inc.; 1980:35–55.
20. East R:Species-area curves and populations of large mammals in African savanna reserves.Biol Conserv1981,21:111–126.
21. Soule ME:Viable populations for conservation.Cambridge, UK: Cambridge University Press; 1987.
22. Peterson RO:The pit or the pendulum: issues in large carnivore management in natural ecosystems.In Edited by Agee JK, Johnson DR. University of Washington, Seattle: Ecosystem management for parks and wilderness; 1988:105–117.
23. Shafer CL:Nature reserves: Island Theory and Conservation Practice.
Washington DC: Smithsonian Institution; 1990.
24. Noss RF, Quigley HB, Hornocker MG, Merrill T, Paquet PC:Conservation biology and carnivore conservation in the Rocky Mountains.Conserv Biol
1996,10:949–963.
25. Harris LD, Gallagher PB:New initiatives for wildlife conservation: the need for movement corridors.InDefense of Wildlife: Preserving Communities and Corridors.Edited by Mackintosh G. Washington D.C.: Defenders of Wildlife; 1989.
26. Beier P, Loe S:In my experience: a checklist for evaluating impacts to wildlife movement corridors.Wildl Soc Bull1992,20:434–440.
27. Harrison S, Bruna E:Habitat fragmentation and large‐scale conservation: what do we know for sure?Ecography1999,22:225–232.
28. Hobbs RJ:The role of corridors in conservation: solution or bandwagon.
Trends Ecol Evol1992,7:389–392.
29. Simberloff D, Farr JA, Cox J, Mehlman DW:Movement corridors: conservation bargains or poor investments?Conserv Biol1992,6:493–504. 30. Rosenberg DK, Noon BR, Meslow EC:Biological corridors: form, function,
and efficacy.Bioscience1997,47:677–687.
31. Theobald DM, Reed SE, Fields K, Soule M:Connecting natural landscapes using a landscape permeability model to prioritize conservation activities in the US.Conserv Lett2012,5:123–133.
32. Cushman SA, McKelvey KS, Schwartz MK:Use of empirically derived source‐destination models to map regional conservation corridors.
Conserv Biol2009,23:368–376.
33. Cushman SA, McRae B, Adriaensen F, Beier P, Shirley M, Zeller K:Biological corridors and connectivity.Key Topics in Conservation Biology2013a, 2:384–404.
34. Spear SF, Peterson CR, Matocq MD, Storfer A:Landscape genetics of the blotched tiger salamander (Ambystoma tigrinum melanostictum).
Mol Ecol2005,14:2553–2564.
35. Cushman SA, Landguth EL, Flather CH:Evaluating the sufficiency of protected lands for maintaining wildlife population connectivity in the US northern Rocky Mountains.Divers Distrib2012a,18:873–884. 36. Zeller KA, McGarigal K, Whiteley AR:Estimating landscape resistance to
movement: a review.Landscape Ecol2012,27:777–797.
37. Spear SF, Balkenhol N, Fortin M-J, McRae BH, Scribner KIM:Use of resistance surfaces for landscape genetic studies: considerations for parameterization and analysis.Mol Ecol2010,19:3576–3591.
38. Cushman SA, Lewis JS:Movement behavior explains genetic differentiation in American black bears.Landscape ecology2010,25:1613–1625.
39. Short Bull RA, Cushman SA, Mace R, Chilton T, Kendall KC, Landguth EL, Schwartz MK, McKelvey KS, Allendorf FW, Luikart G:Why replication is important in landscape genetics: American black bear in the Rocky Mountains.Mol Ecol2011,20:1092–1107.
40. Cushman SA, McKelvey KS, Hayden J, Schwartz MK:Gene flow in complex landscapes: testing multiple hypotheses with causal modeling.Am Nat
2006,168:486–499.
41. Cushman SA, Landguth EL:Spurious correlations and inferences in landscape genetics.Mol Ecol2010,19:3592–3602.
42. Cushman SA, Landguth EL, Shirk AS:Re-evaluating causal modeling with mantel tests in landscape genetics.Divers2013,5:51–72. doi:10.3390/ d501005.
43. Adriaensen F, Chardon JP, De Blust G, Swinnen E, Villalba S, Gulinck H, Matthysen E:The application of‘least-cost’modelling as a functional landscape model.Landscape and urban planning2003,64:233–247. 44. Singleton PH, Gaines WL, Lehmkuhl JH:Landscape permeability for large
carnivores in Washington: a geographic information system weighted-distance and least-cost corridor assessment.Portland, OR: US Department of Agriculture, Forest Service, Pacific Northwest Research Station; 2002. 45. Spencer WD, Beier P, Penrod K, Parisi M, Pettler A, Winters K, Strittholt J,
46. Washington Wildlife Habitat Connectivity Working Group (WHCWG):
Washington Connected Landscapes Project: Statewide Analysis.Olympia, WA: Washington Departments of Fish and Wildlife, and Transportation; 2010. 47. Clevenger AP, Chruszcz B, Gunson KE:Highway mitigation fencing reduces
wildlife-vehicle collisions.Wildl Soc Bull2001,29:646–653.
48. Barnum S:Identifying the best locations to provide safe highway crossing opportunities for wildlife.UC Davis: Road Ecology Center; 2003. Retrieved from: http://escholarship.org/uc/item/6ts509wb.
49. Huijser MP, Allen TDH, Camel W:US 93 Post-Construction Wildlife-Vehicle Collision and Wildlife Crossing Monitoring and Research on the Flathead Indian Reservation between Evaro and Polson, Montana. Annual Report 2010.Bozeman, MT, USA: Western Transportation Institute (WTI-MSU), Montana State University; 2010:34. Available from the internet: http:// www.mdt.mt.gov/research/projects/env/wildlife_crossing.shtml. 50. McDonald W, St Clair CC:Elements that promote highway crossing
structure use by small mammals in Banff National Park.J Appl Ecol2004, 41:82–93.
51. Alexander SM, Waters MN:The effects of highway transportation corridors on wildlife: a case study of Banff National Park.Transportation Research Part C: Emerging Technologies2000,1:307–320.
52. Lewis JS, Rachlow JL, Horne JS, Garton EO, Wakkinen WL, Hayden J, Zager P: Identifying habitat characteristics to predict highway crossing areas for black bears in a human-modified landscape.Landsc Urban Plan2011, 101:99–107.
53. Cushman SA, Landguth EL:Multi-taxa population connectivity in the Northern Rocky Mountains.Ecol Model2012b,231:101–112. 54. Hill CJ:Linear strips of rainforest vegetation as potential dispersal
corridors for rainforest insects.Conserv Biol1995,9:1559–1566.
55. Castellon TD, Sieving KE:An experimental test of matrix permeability and corridor use by an endemic understory bird.Conserv Biol2006,20:135–145. 56. Berggren A, Birath B, Kindvall O:Effect of corridors and habitat edges on dispersal behavior, movement rates, and movement angles in Roesel’s Bush‐Cricket (Metrioptera roeseli).Conserv Biol2002,16:1562–1569. 57. Haddad NM, Bowne DR, Cunningham A, Danielson BJ, Levey DJ, Sargent S,
Spira T:Corridor use by diverse taxa.Ecology2003,84:609–615. 58. Balkenhol N, Gugerli F, Cushman SA, Waits LP, Coulon A, Arntzen JW,
Holderegger R, Wagner HH:Identifying future research needs in landscape genetics: where to from here?Landsc Ecol2009,24:455–463. 59. Segelbacher G, Cushman SA, Epperson BK, Fortin M-J, Francois O, Hardy DJ,
Holderegger R, Taberlet P, Waits LP, Manel S:Applications of landscape genetics in conservation biology: concepts and challenges.Conserv Genet
2010. doi: 10.1007/s10592-009-0044-5.
60. Landguth EL, Hand BK, Glassy J, Cushman SA, Sawaya MA:UNICOR: a species connectivity and corridor network simulator.Ecography2011, 34:001-006-14.
61. Dijkstra EW:A note on two problems in connexion with graphs.
Numerische Mathematik1959,1:269–271.
62. Compton BW, McGarigal K, Cushman SA, Gamble LR:A resistant-kernel model of connectivity for amphibians that breed in vernal pools.
Conserv Biol2007,21:788–799.
63. Johnson KG, Pelton MR:Prebaiting and snaring techniques for black bears.The Wildlife Society Bulletin1980,8:46–54.
64. Fortin M-J, Dale MRT:Spatial Analysis: A Guide for Ecologists.Cambridge, UK: Cambridge University Press; 2005.
doi:10.1186/2051-3933-1-12
Cite this article as:Cushmanet al.:Evaluating the intersection of a regional wildlife connectivity network with highways.Movement Ecology
20131:12. Submit your next manuscript to BioMed Central
and take full advantage of:
• Convenient online submission
• Thorough peer review
• No space constraints or color figure charges
• Immediate publication on acceptance
• Inclusion in PubMed, CAS, Scopus and Google Scholar
• Research which is freely available for redistribution
![Figure 1 Analysis area location and resistance map produced by empirically optimizing the correlation between genetic differentiationamong individual black bears and landscape features [40], and verified in a meta-replicated landscape genetic study [39] an](https://thumb-us.123doks.com/thumbv2/123dok_us/9151841.1909886/3.595.58.538.88.336/resistance-empirically-optimizing-correlation-differentiationamong-individual-landscape-replicated.webp)