VOLUME 36, ARTICLE 47, PAGES 1435
,
1452
PUBLISHED 3 MAY 2017
http://www.demographic-research.org/Volumes/Vol36/47/ DOI: 10.4054/DemRes.2017.36.47
Descriptive Finding
The compositional effects of education and
employment on Greek male and female fertility
rates during 2000–2014
Christos Bagavos
Alexandra Tragaki
© 2017 Christos Bagavos & Alexandra Tragaki.
This open-access work is published under the terms of the Creative Commons Attribution NonCommercial License 2.0 Germany, which permits use, reproduction & distribution in any medium for non-commercial purposes, provided the original author(s) and source are given credit.
1 Introduction 1436
2 Data and methods 1437
2.1 Data on births by educational and employment status 1437 2.2 Estimation of the compositional effect of educational and
employment status on the changes in total fertility levels
1438
3 Results 1441
3.1 Trends over time in male and female fertility by educational level and employment status
1441
3.2 Changes over time in education- and employment-specific
distributions 1444
3.3 Decomposing the trends in male and female fertility: Large gender discrepancies
1444
4 Discussion and conclusion 1447
5 Acknowledgments 1448
The compositional effects of education and employment on Greek
male and female fertility rates during 2000–2014
Christos Bagavos1 Alexandra Tragaki2
Abstract
BACKGROUND
As many of the advanced countries that were hit hard by the recent economic recession also have persistently low fertility rates, researchers are increasingly interested in examining how the education‒employment gradient shapes fertility outcomes.
OBJECTIVE
Our aim in this paper is to enrich the discussion about variation in crisis-driven fertility patterns by focusing on male fertility, and by comparing the fertility behavioral patterns and the compositional factors of male and female fertility under “Great Recession” conditions.
METHODS
We estimate the education- and employment-specific fertility rates of men and women for the 2000–2014 period in Greece. Using a mixed standardization and decomposition method, we estimate the influence of changes in educational levels and employment status on total male and female fertility, which we call the “compositional effect;” and of changes in fertility behavior, which we call the “fertility effect.”
RESULTS
During the recent economic recession, the decline in fertility has been far from uniform across genders, educational levels, and employment statuses. Moreover, it appears that the changes in male and female fertility rates have been driven by different underlying forces. We find that among men, negative shifts in employability were exclusively responsible for the decline in fertility rates; whereas among women, changes in the TFR were steadily conditioned by the pure fertility effect.
CONCLUSIONS
Our findings suggest that the compositional effect on the period total fertility rate might
be more important than fertility behavior per se, especially during time periods when economic variables clearly contribute to fertility outcomes.
1. Introduction
In recent years, scholars have been trying to understand the links between fertility and economic factors in advanced countries with persistently low fertility rates, primarily by focusing on the education‒employment gradient. The outcomes of these studies have been interesting, albeit sometimes contradictory. While it has long been assumed that educational attainment and employment rates are negatively associated with female fertility (Rindfuss, Morgan, and Offutt 1996; Surkyn and Lesthaeghe 2004; Van de Kaa 2006; Zhang 2011; Thomson, Winkler-Dworak, and Kennedy 2013), there is both theoretical and empirical evidence that in certain countries, the sign of the latter association has been reversed (Adserà 2004; Engelhardt and Prskawetz 2004). Meanwhile, the assumption that male fertility is positively associated with educational attainment and employment has gone largely unchallenged (Zhang 2011).
In light of these findings, some intriguing questions arise. Are population shifts caused by increases in educational attainment and changes in economic conditions; and, if so, how have these compositional shifts affected fertility rates? More specifically, we can ask whether the decrease in fertility rates can be sufficiently explained by changing childbearing behavior, and whether and to what extent fertility rates have been influenced by shifts in education and employment distributions. In this study, we seek to analyze and quantify the compositional effect on the differences in the TFRs of men and women, and to compare the size of the compositional effect with that of the pure fertility effect. We use the term ‘compositional effect’ to describe the influence of changes in educational levels and employment statuses on total male and female fertility. We differentiate this effect from the ‘fertility effect,’ a term we use to refer to changes in fertility behavior. The magnitude of the compositional effect depends on shifts in fertility rates across employment and educational categories.
among the male population. Over the same period, the male TFR declined from 1.30 to 1.20 and the female TFR fell from 1.48 to 1.30.
In this study, we extend previous findings on male fertility in Greece (Tragaki and Bagavos 2014) in three ways. First, because we cover a longer period of time (up to 2014), we can better distinguish the role the recent economic recession has played in the compositional aspects of fertility trends. Second, because we examine both male and female fertility rates, we are able to provide evidence on gender differences in the fertility and compositional effects on changes in TFRs. Third, we build on the existing methodology by taking into account the relative importance of interactions between components.
2. Data and methods
2.1 Data on births by educational and employment status
Our analysis relies on period counts of births broken down by the mother’s and the father’s demographic and socioeconomic attributes, such as age, educational level, and employment status. These counts were compiled for the National Vital Statistics Births report, which is published annually by the Hellenic Statistic Authority (EL.STAT. 2016). The data are tabulated by five-year age groups (15–19, 20–24, ... up to 60–64 for men and up to 45–49 for women), by six categories of employment status, and by five educational groups. For compatibility reasons, we have reorganized the educational data into three groups: low, or up to secondary education; medium, or upper and postsecondary education; andhigh, or the first or second stage of tertiary education. For the same reasons, we have reassigned the employment data to two employment status groups:employed andnonemployed.The nonemployed group consists of unemployed or inactive individuals, such as retirees and students. We thus divided men and women into separate sets of six educational level and employment status groups.
on male fertility (Tragaki and Bagavos 2014) excluded all of the incomplete birth registrations from the analysis. As our goal here is to make robust gender comparisons, we decided to distribute the missing data on the fathers’ characteristics across different groups in accordance with the overall pattern of births. For this reason, the male fertility rates obtained here differ slightly from those used in the previous paper.
To calculate the employment‒education-specific male and female TFRs, it is necessary to estimate the average female and male populations by age, educational level, and employment status for the noncensus years. This estimation is based on data from two different sources: demographic statistics (Eurostat 2016a) and the Labour Force Survey (LFS) (Eurostat 2016b, 2016c). Following a suggestion made by Tragaki and Bagavos (2014), we apply the age, education, and employment distributions in the annual results of the Labor Force Survey to the average population figures provided by the Eurostat demographic statistics. This is a simple and reasonably accurate way to estimate population subgroups that enables us to overcome data limitations without undermining the comparability of the data.
2.2 Estimation of the compositional effect of educational and employment status on the changes in total fertility levels
Since Kitagawa’s (1955) influential work, decomposition methods have been widely applied in demographic analysis (Cho and Retherford 1973; Canudas Romo 2003). These methods have mainly been used to estimate the educational composition effect on fertility developments (Brzozowska 2014; Nisén et al. 2014; Ní Bhrolcháin and Beaujouan 2012; Rendall et al. 2010; Neels and de Wachter 2010; Neels 2009; Retherford et al. 2004; Rindfuss, Morgan, and Offutt 1996). By contrast, there have been relatively few studies that have examined the combined effects of education and employment on fertility (Tragaki and Bagavos 2014). The methodological approaches used in these studies varied in terms of the perspective they took (cohort or period), the aspect of fertility they examined (delay in childbearing or changes in fertility quantum), and the gender (male or female fertility) they focused on.
In our approach, education and employment are not examined as factors that influence the decision to have a child, but as compositional components of fertility rates. Since differences in fertility rates by employment status are less pronounced among women than among men, changing shares in the respective populations of reproductive ages may have differing effects on the overall TFRs of men and women, even if the variations in the group-specific fertility rates are rather similar.
class (weights) affect male and female TFRs, respectively. To estimate this compositional effect, we attribute different weights to each of the employment‒ education-specific groups. The weights given to each of the five-year interval age groups are the product of the group-specific education share and the employment rate. The weights are calculated on an annual basis, separately for men and women.
To provide a numerical example of how the weights are calculated, let us take the case of men aged 30–34 in 2008. Of the men in this age group, 31.7% have a low level of education. Of this group, 91.3% were employed and 8.7% were nonemployed. Therefore, the weight assigned to the “low educated employed men” group is calculated from the share of less educated individuals in the male population, multiplied by the employment rate in the low education group. The result is 28.9% (=0.317*0.913). Accordingly, the weights for the medium and highly educated employed men in this age group are 41.7% and 21.2%, respectively. The sum of those weights (0.289+0.417+0.212) provides the overall employment rate (91.9%) of this age group.
In our analysis, we use a mixed standardization and decomposition method in which the compositional effect of the changes in the education shares (or the employment rates) alone over a period of time is calculated by maintaining the fertility rates and the employment (or the education) distribution at the levels observed at the beginning of the period. Likewise, the “fertility effect” is given by the fertility levels that would have resulted if the education shares and the employment rates had been kept constant over the examined period. This approach allows us to calculate the interactions between each of the variables, as well as the interaction effect between the compositional and the fertility effects, in order to fully decompose the changes in the real TFRs over time (Bagavos 2014).
Letfbe the age-specific fertility rates, C refers to the proportional representation of education and employment groups within the population (weights),E indicates the relative frequency of each education group,R refers to the proportion of individuals by employment status (employment vs. nonemployment rates), i (i=1,2,3) expresses the education group, j (j=1, 2) indicates the employment status, andx signifies the age of the individuals.
Then, the age-specific fertility rate of males or females at agex in a single year is given by the sum of the product of the proportional representation of each of the six education‒employment groups within the population at age x, multiplied by their age-specific fertility rates at age x:
,
,
The decomposition of its change (∆) at age x between two particular years (in our case, 2000 and 2008 or 2008 and 2014) is:
∆ = ∆( ,
,
∗ , ) = ,
,
∗ ∆ , + , ∗ ∆ ,
,
+ ∆ , ∗ ∆ ,
,
(2)
In relation (2), the rates and the proportions refer to the initial year (i.e., 2000 for the changes that occurred between 2000 and 2008, and 2008 for the changes that occurred between 2008 and 2014).
Given that in every agex
= , ∗ , (3)
which means that
∆ = ∆( , ∗ , ) = , ∗ ∆ , + , ∗ ∆ , + ∆ , ∗ ∆ , (4)
Using (4) the relation (2) is modified as follows:
∆ = ∑, , , ∗ ∆ , + ∑, , , ∗ ∆ , + ∑, , , ∗ ∆ , +
∑ ∆(, , ∗ , ) ∗ ∆ , + ∑, , ∗ (∆ , ∗ ∆ , ) (5)
where the first component∑ , ,
, ∗ ∆ , estimates the fertility effect, the second component ∑ , , ∗ ∆ ,
, estimates the education effect, the third component
∑ , , ∗ ∆ ,
, estimates the employment effect, and ∑ ∆(, , ∗ , ) ∗ ∆ , + ∑, , ∗ (∆ , ∗ ∆ , ) estimates the interaction effect.
Given that the TFR of the population is:
=
The equation (5) can then be easily expressed in terms of changes in the TFR, attributing shifts in total period fertility to its three components and to the corresponding interaction effect as:
, ,
,
∗ ∆ ,
, , ∗ ∆ ,
,
, , ∗ ∆ ,
,
for the three components, respectively, and
∑ ∑ ∆( , ∗ , ) ∗ ∆ ,
, + ∑ ∑, , ∗ (∆ , ∗ ∆ , )
for the interaction effect.
3. Results
3.1 Trends over time in male and female fertility by educational level and employment status
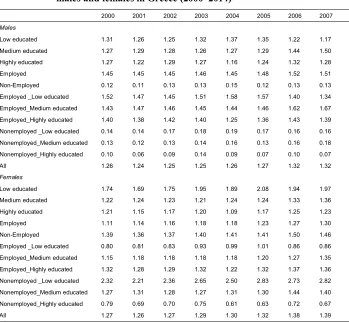
Since 2000, male and female total fertility rates in Greece have been fluctuating at very low levels, and have remained consistently below 1.4 for men and 1.5 for women (Table 1). It is, however, noteworthy that the fertility rates of men and women vary according to educational level and employment status. Female fertility decreases with education, with college graduates tending to have fewer children than their less educated counterparts (Table 1). This negative association between educational attainment and fertility rates does not apply to men as less educated men have lower fertility levels than their counterparts with medium or high levels of education (Table 1).
Table 1: Total fertility rate by educational level and employment status for males and females in Greece (2000–2014)
2000 2001 2002 2003 2004 2005 2006 2007
Males
Low educated 1.31 1.26 1.25 1.32 1.37 1.35 1.22 1.17 Medium educated 1.27 1.29 1.28 1.26 1.27 1.29 1.44 1.50 Highly educated 1.27 1.22 1.29 1.27 1.16 1.24 1.32 1.28 Employed 1.45 1.45 1.45 1.46 1.45 1.48 1.52 1.51 Non-Employed 0.12 0.11 0.13 0.13 0.15 0.12 0.13 0.13 Employed _Low educated 1.52 1.47 1.45 1.51 1.58 1.57 1.40 1.34 Employed_Medium educated 1.43 1.47 1.46 1.45 1.44 1.46 1.62 1.67 Employed_Highly educated 1.40 1.38 1.42 1.40 1.25 1.36 1.43 1.39 Nonemployed _Low educated 0.14 0.14 0.17 0.18 0.19 0.17 0.16 0.16 Nonemployed_Medium educated 0.13 0.12 0.13 0.14 0.16 0.13 0.16 0.18 Nonemployed_Highly educated 0.10 0.06 0.09 0.14 0.09 0.07 0.10 0.07 All 1.26 1.24 1.25 1.25 1.26 1.27 1.32 1.32
Females
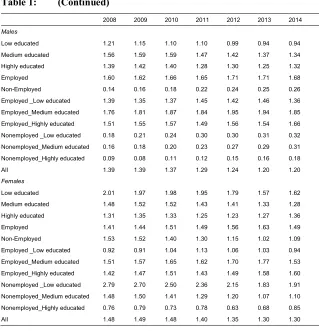
Table 1: (Continued)
2008 2009 2010 2011 2012 2013 2014
Males
Low educated 1.21 1.15 1.10 1.10 0.99 0.94 0.94 Medium educated 1.56 1.59 1.59 1.47 1.42 1.37 1.34 Highly educated 1.39 1.42 1.40 1.28 1.30 1.25 1.32 Employed 1.60 1.62 1.66 1.65 1.71 1.71 1.68 Non-Employed 0.14 0.16 0.18 0.22 0.24 0.25 0.26 Employed _Low educated 1.39 1.35 1.37 1.45 1.42 1.46 1.36 Employed_Medium educated 1.76 1.81 1.87 1.84 1.95 1.94 1.85 Employed_Highly educated 1.51 1.55 1.57 1.49 1.56 1.54 1.66 Nonemployed _Low educated 0.18 0.21 0.24 0.30 0.30 0.31 0.32 Nonemployed_Medium educated 0.16 0.18 0.20 0.23 0.27 0.29 0.31 Nonemployed_Highly educated 0.09 0.08 0.11 0.12 0.15 0.16 0.18
All 1.39 1.39 1.37 1.29 1.24 1.20 1.20
Females
Low educated 2.01 1.97 1.98 1.95 1.79 1.57 1.62 Medium educated 1.48 1.52 1.52 1.43 1.41 1.33 1.28 Highly educated 1.31 1.35 1.33 1.25 1.23 1.27 1.36 Employed 1.41 1.44 1.51 1.49 1.56 1.63 1.49 Non-Employed 1.53 1.52 1.40 1.30 1.15 1.02 1.09 Employed _Low educated 0.92 0.91 1.04 1.13 1.06 1.03 0.94 Employed_Medium educated 1.51 1.57 1.65 1.62 1.70 1.77 1.53 Employed_Highly educated 1.42 1.47 1.51 1.43 1.49 1.58 1.60 Nonemployed _Low educated 2.79 2.70 2.50 2.36 2.15 1.83 1.91 Nonemployed_Medium educated 1.48 1.50 1.41 1.29 1.20 1.07 1.10 Nonemployed_Highly educated 0.76 0.79 0.73 0.78 0.63 0.68 0.85
All 1.48 1.49 1.48 1.40 1.35 1.30 1.30
Sources: Own calculations based on EL.STAT. National Vital Statistics, Eurostat Demographic Statistics and Labor Force Surveys, 2000–2014.
than those of the employed. By contrast, the fertility levels of the employed women with medium education gradually surpassed those of their nonemployed counterparts. It is interesting to note that at the end of the study period, fertility was increasing with education among the employed women, but was decreasing with education among the nonemployed women. In 2014, the employed women with high education had the highest total fertility rate (1.60) out of all of the employment‒education groups, except for the nonemployed women with low education (1.91).
3.2 Changes over time in education- and employment-specific distributions
Some results that are not presented here in detail indicate that an uninterrupted improvement in educational attainment has been observed among both males and females since the 2000s: The shares of the highly educated in the population increased by 8.8 percentage points among men and by 12.2 percentage points among women, while the shares of less educated men and women in the population have been shrinking. Over the same period, changes in employment rates followed a more uneven path. Among both men and women, employment rates rose between 2000 and 2008 (from 71.8% to 74.1% for men and from 42.0% to 48.7% for women), and then fell sharply to 57.7% for men and 41.2% for women in 2014. In both periods, the employment patterns differed considerably by gender: In the years prior to the crisis, women benefited more than men from increasing employment rates; whereas during the recession, employment rates decreased more for men than for women.
Over the period examined, the improvements in educational attainment relative to the changes in employment rates have modified the shares of the education‒ employment-specific groups in the total population, and have thus altered the compositional dimension of overall fertility. The changes were most pronounced for two particular groups: The share of less educated employed individuals in the population declined (from 32.1% to 16.9% for men and from 15.7% to 9% for women), while the share of highly educated employed individuals in the population increased (from 12.9% to 17.1% for men and from 9.7% to 16.1% for women).
3.3 Decomposing the trends in male and female fertility: Large gender discrepancies
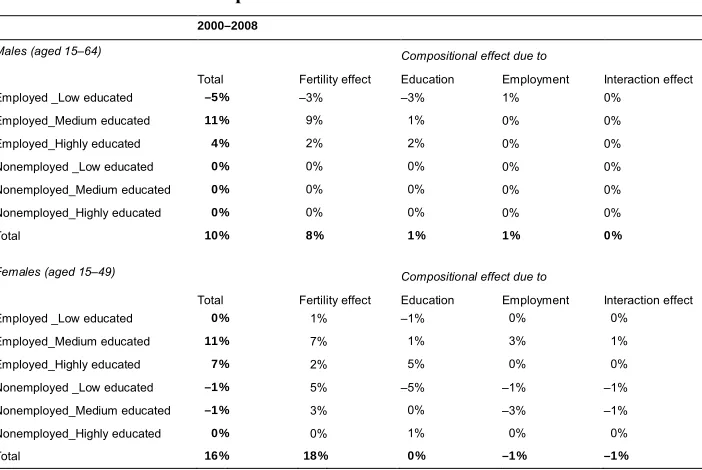
births per 1,000 women aged 15 to 49 increased 16%. Both of these increases were primarily due to the fertility effect, with the compositional effect being almost negligible. However, the fertility effect was much more pronounced for women than for men (18% versus 8%). Moreover, the changes in male fertility behavior affected employed men only, whereas the changes in female fertility behavior were independent of women’s employment status.
Table 2: Fertility and compositional effects on the changes in male and female TFRs over the periods 2000–2008 and 2008–2014
2000–2008
Males (aged 15–64)
Total Fertility effect
Compositional effect due to
Interaction effect Education Employment
Employed _Low educated –5% –3% –3% 1% 0%
Employed_Medium educated –11% –9% –1% 0% 0% Employed_Highly educated –4% –2% –2% 0% 0% Nonemployed _Low educated –0% –0% –0% 0% 0% Nonemployed_Medium educated –0% –0% –0% 0% 0% Nonemployed_Highly educated –0% –0% –0% 0% 0%
Total –10% –8% –1% 1% 0%
Females (aged 15–49)
Total Fertility effect
Compositional effect due to
Interaction effect Education Employment
Employed _Low educated –0% 1% –1% –0% –0% Employed_Medium educated –11% 7% –1% –3% –1% Employed_Highly educated –7% 2% –5% –0% –0% Nonemployed _Low educated –1% 5% –5% –1% –1% Nonemployed_Medium educated –1% 3% –0% –3% –1% Nonemployed_Highly educated –0% 0% –1% –0% –0%
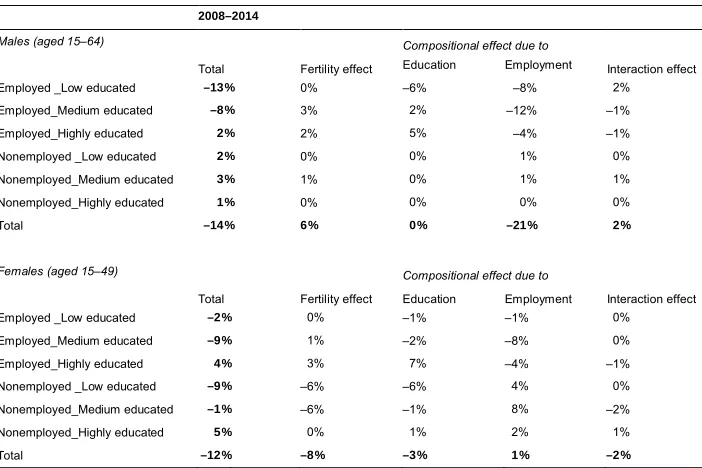
Table 2: (Continued)
2008–2014
Males (aged 15–64)
Total Fertility effect
Compositional effect due to
Interaction effect Education Employment
Employed _Low educated –13% 0% –6% –8% –2% Employed_Medium educated –8% 3% –2% –12% –1% Employed_Highly educated –2% 2% –5% –4% –1% Nonemployed _Low educated –2% 0% –0% –1% –0% Nonemployed_Medium educated –3% 1% –0% –1% –1% Nonemployed_Highly educated –1% 0% –0% –0% –0%
Total –14% 6% –0% –21% –2%
Females (aged 15–49)
Total Fertility effect
Compositional effect due to
Interaction effect Education Employment
Employed _Low educated –2% –0% –1% –1% –0% Employed_Medium educated –9% –1% –2% –8% –0% Employed_Highly educated –4% –3% –7% –4% –1% Nonemployed _Low educated –9% –6% –6% –4% –0% Nonemployed_Medium educated –1% –6% –1% –8% –2% Nonemployed_Highly educated –5% –0% –1% –2% –1%
Total –12% –8% –3% –1% –2%
Sources: Own calculations based on EL.STAT. National Vital Statistics, Eurostat Demographic Statistics and Labor Force Surveys, 2000–2014.
Further decomposition on different population subgroups allows for the estimation of employment, education, and fertility effects on total fertility. Over the 2000–2008 period, positive fertility effects can be observed for employed men and women of all educational levels, except for less educated men. Surprisingly, this trend continued during the economic recession (which started in 2008/09), although the exceptional status of less educated men was less apparent. In contrast, the fertility effect became negative for the nonemployed women, and remained moderate for the nonemployed men (Table 2). During the recession years, the employment effect was negative for employed men and women of all educational levels, and especially for medium educated men (–12%) and women (–8%) and for less educated men (–8%); but was positive for all nonemployed groups, and especially for medium educated women (+8%).
4. Discussion and conclusion
Over the 2000–2014 period, the male TFR ranged from 1.2 to 1.4, while the female TFR ranged from 1.25 to 1.5. Using a modified decomposition method, our analysis suggests that during this period, employment status and educational level were linked to fertility differently among men than among women. We found large differences in fertility among men, but only limited differences in fertility among women, depending on whether they were employed or nonemployed. Our results also indicated that female fertility was negatively correlated with education, whereas the relationship between male fertility and education was more ambiguous. However, we found that gender discrepancies in the relationship between employment status and fertility were attenuated in the highly educated groups.
are still expected to be breadwinners, regardless of their educational level or the employment status of their spouse. It therefore appears that Greek men approach breadwinning as an obligation, while Greek women see participation in paid employment as an opportunity or a choice (Bagavos 2017). Thus, over our study period, female fertility was dependent on the fertility outcomes of both employed and nonemployed women, and was positively associated with education. Being in employment was positively correlated with fertility outcomes among women with medium and especially high levels of education, but not among women with low levels of education.
In this paper, we used the TFR to estimate variations over time and differences between groups in the male and the female populations. Our decision to use the TFR was based mainly on data availability. When interpreting these results, it is important to keep in mind that the TFR represents a summary of rates, and that its value does not correspond to the average number of children of an actual group of people. The possibility that variations in the TFR might reflect differences in the timing rather than in the quantum of fertility should also be taken into account. Yet despite these weaknesses, the TFR remains the most commonly used fertility indicator, mainly due to data availability.
Although data limitations did not allow us to distinguish between inactive and unemployed individuals, the results of this study suggest that the compositional effect merits further examination. Our analysis has shown that the impact of this effect on shifting demographic rates risks is often underestimated or even ignored, especially during periods in which the explanatory power of economic variables seems indisputable.
5. Acknowledgments
References
Adserà, A. (2004). Changing fertility rates in developed countries: The impact of labor market institutions.Journal of Population Economics 17(1): 17–43.doi:10.1007/ s00148-003-0166-x.
Bagavos, C. (2014). Decomposing and standardizing fertility trends: Methodological insights and applications [unpublished manuscript]. Athens: Panteion University, Department of Social Policy (in Greek).
Bagavos, C. (2017). Do different educational pairings lead to different fertility outcomes? A cohort perspective for the Greek case. Vienna Yearbook of Population Research (forthcoming).
Brzozowska, Z. (2014). Fertility and education in Poland during state socialism. Demographic Research 31(12): 319–336.doi:10.4054/DemRes.2014.31.12. Canudas Romo, V. (2003). Decomposition methods in demography. [PhD Thesis].
Groningen: Rijksuniversiteit Groningen.
Cho, L.J. and Retherford, R.D. (1973). Comparative analysis of recent fertility trends in East Asia. In: IUSSP (ed.). Proceedings of the 17th general conference of the IUSSP. Liège: IUSSP: 163–181.
EL.STAT. (2016). Annual data on births in Greece by father’s age, education level and employment status, 1992–2014 [electronic resource]. Piraeus: Hellenic Statistical Authority. http://www.statistics.gr/pls/apex/f?p=105:1030:326444671 1800828::NO
Engelhardt, H. and Prskawetz, A. (2004). On the changing correlation between fertility and female employment over space and time. European Journal of Population 20(1): 35–62.doi:10.1023/B:EUJP.0000014543.95571.3b.
Eurostat (2016a). Population on 1 January by age and sex [electronic resource]. Luxembourg: Eurostat.
Eurostat (2016b). LFS series – Detailed annual survey results: Population, aged 15 to 74 years, by sex, age and highest level of education attained (1000) [electronic resource]. Luxembourg: Eurostat.
Joyner, K., Peters, H.E., Hynes, K., Sikora, A., Taber, J.R., and Rendall, M. (2012). The quality of male fertility data in major U.S. surveys. Demography 49(1): 101–124.doi:10.1007/s13524-011-0073-9.
Kitagawa, E.M. (1955). Components of a difference between two rates.Journal of the American Statistical Association 50(272): 1168–1194. doi:10.1080/01621459. 1955.10501299.
Neels, K. (2009).Postponement and recuperation of cohort fertility. Paper presented at IUSSP XXVI International Population Conference, Marrakesh, Morocco, September 27–October 3, 2009.
Neels, K. and de Wachter, D. (2010). Postponement and recuperation of Belgian fertility: How are they related to rising female educational attainment? Vienna Yearbook of Population Research 8: 77–106. doi:10.1553/populationyearbook 2010s77.
Ní Bhrolcháin, M. and Beaujouan, E. (2012). Fertility postponement is largely due to rising educational enrolment. Population Studies 66(3): 311–327. doi:10.1080/ 00324728.2012.697569.
Nisén, J., Martikainen, P., Silventoinen, K., and Myrskylä, M. (2014). Age-specific fertility by educational level in the Finnish male cohort born 1940‒1950. Demographic Research 31(5): 119–136.doi:10.4054/DemRes.2014.31.5. Rendall, M., Aracil, E., Bagavos, C., Couet, C., Derose, A., Digiulio, P., Lappegård, T.,
Robert-Bobée, I., Rønsen, M., Smallwood, S., and Verropoulou, G. (2010). Increasingly heterogeneous ages at first birth by education in Southern European and Anglo-American family-policy regimes: A seven-country comparison by birth cohort. Population Studies 64(3): 209–227. doi:10.1080/00324728.2010. 512392.
Retherford, R.D., Ogawa, N., Matsukura, R., and Ihara, H. (2004).Trends in fertility by education in Japan: 1966–2000. Tokyo: Nihon University Population Research Institute.
Rindfuss, R.R., Morgan, P., and Offutt, K. (1996). Education and the changing age pattern of American fertility: 1963–1989. Demography 33(3): 227–290.
doi:10.2307/2061761.
Thomson, E., Winkler-Dworak, M., and Kennedy, S. (2013). The standard family life course: An assessment of variability in life course pathways. In: Evans, A. and Baxter, J. (eds.). Negotiating the life course: Stability and change in life pathways. Dordrecht: Springer: 35‒52.doi:10.1007/978-90-481-8912-0_3. Tragaki, A. and Bagavos, C. (2014). Male fertility in Greece: Trends and differentials
by education level and employment status. Demographic Research 31(6): 137– 160.doi:10.4054/DemRes.2014.31.6.
Van de Kaa, D. (2006). Temporarily new: On low fertility and the prospect of pro-natal policies.Vienna Yearbook of Population Research 4: 193–211.
Zhang, L. (2011). Male fertility patterns and determinants. Dordrecht: Springer.