World Maritime University World Maritime University
The Maritime Commons: Digital Repository of the World Maritime
The Maritime Commons: Digital Repository of the World Maritime
University
University
World Maritime University Dissertations Dissertations
2001
Computer assisted economic modelling for establishing value
Computer assisted economic modelling for establishing value
based tariffs.
based tariffs.
Lancelot Arnold
WMU
Follow this and additional works at: https://commons.wmu.se/all_dissertations
Recommended Citation Recommended Citation
Arnold, Lancelot, "Computer assisted economic modelling for establishing value based tariffs." (2001). World Maritime University Dissertations. 1099.
https://commons.wmu.se/all_dissertations/1099
WORLD MARITIME UNIVERSITY
Malmö, Sweden
COMPUTER ASSISTED ECONOMIC MODELING
FOR ESTABLISHING VALUE BASED TARIFFS
By
LANCELOT ARNOLD
Saint Lucia
A dissertation submitted to the World Maritime University in partial fulfilment of the requirements for the award of the degree of
MASTER OF SCIENCE
In
PORT MANAGEMENT
2001
DECLARATION
I certify that all the material in this dissertation that is not my own work has been identified, and that no material is included for which a degree has previously been conferred on me.
The contents of this dissertation reflect my own personal views, and are not necessarily endorsed by the University.
Signature ………..
Date ………..
Supervised by: Professor Tor Wergeland
World Maritime University
Assessor: Professor Shou Ma
Institution/organisation: World Maritime University
Co-assessor: Carlos Canamero
ACKNOWLEDGEMENT
I wish to express my sincere gratitude to Mr. Vincent Hippolyte, General Manager of the Saint Lucia Air and Sea Ports Authority, for encouraging and nominating me for my course of study at the World Maritime University. I also extend my gratitude to the IMO-Norway Technical Co-operation Programme for awarding me a fellowship to pursue this program.
Special thanks and appreciation is also extended to my supervisor, Professor Tor Wergeland, Professor Shou Ma and Mr. Carlos Canamero of UNCTAD for their guidance and assistance in helping me to develop and improve this dissertation. I wish to thank the staff of the World Maritime University Library, Diane Spencer-Mauricette of the Saint Lucia Air and Sea Ports Authority, and Fabian Joseph of the Customs Department of Saint Lucia for their tireless efforts in assisting me with the relevant material which formed part of this dissertation.
ABSTRACT
Title of Dissertation: Computer Assisted Economic Modeling For Establishing Value-Based Tariffs.
Degree: MSc
This dissertation examines the topic of port pricing and in particular develops and proposes a computer based model to assist ports wishing to adopt a value based wharfage tariff for cargoes transported in containers and as break-bulk.
The proliferation of various types of ownership of ports around the world means that numerous and varied approaches are taken to address the issue of pricing for the services and facilities provided in ports. As a consequence, UNCTAD has proposed an approach called the Cost-Performance-Value approach which seeks to enable ports to accurately develop tariffs for their various facilities and services irrespective of the overall type of ownership of the port.
By focusing on the value aspect of this approach, the analysis conducted within this dissertation differentiates and identifies the value afforded to consignees of cargo transported in containers and in so doing develops a computer based model that gives a range within which a port may establish the wharfage tariff for the type of cargo trade. The CIF value of the cargoes is used as a proxy or measurement of the level of value afforded to individual users of the port. The lower end of the range allows ports to recover the annual depreciation expense of the berths whilst the upper end allows for a maximization of revenues.
TABLE OF CONTENTS
Declaration ii
Acknowledgements iii
Abstract iv
Table of Contents vi
List of Tables viii
List of Figures ix
List of Abbreviations x
1 Introduction
1.1 The concept of logistics and supply chain management 1 1.2 Role of ports within the supply and transport chain 2
1.3 Port Pricing 3
1.3.1 Cost-Performance-Value Strategy 3 1.4 Problem Identification 4
1.5 Objective 5
1.6 Significance of research 6
1.7 Methodology 6
1.8 Limitations of research 7
2 Overview of Port Pricing
2.1 Background 8
2.2 Traditional cost Based Approach 9 2.3 Economic Approach to Pricing 9 2.4 Congestion Pricing approach 11
2.5 Strategic Pricing 11
2.6 General discussion 13
3 Port Castries and the Saint Lucia Air and Sea Ports Authority
3.1 The island of Saint Lucia 15 3.2 Basic facts about the island of Saint Lucia 15 3.3 Overview of SLASPA 16 3.4 Physical characteristics of Port Castries 16
3.4.1 Management and operation of Port Castries 17
3.4.2 Tariffs 18
3.4.3 Traffic 19
3.4.3(b) Containerised Cargo 21
4 The Value Chain and existing Tariff structure of Port Castries
4.1 Value chain and tariff structure of Port Castries 26 4.2 Value added services to the ship 26
4.2.1 Safe navigation 27
4.2.2 Services at the berth 28 4.3 Value added services to the cargo 31
4.3.1 Cargo storage 31
4.3.2 Cargo processing 32 4.4 Other services to users 32 4.5 Other port activities 33 4.6 General discussion 33
5 Development of a computer based model
5.1 Identification of the wharfage component within the 35 container charge
5.1.1 Calculation of cargo handling costs 35 5.1.2 Identifying the wharfage charge 38
5.2 The computer model for containerised cargo 40 5.2.1 Estimation of elasticity 41 5.2.2 Determination of base and maximum charge 43
5.3 The computer model for break-bulk cargo 46 5.3.1 Determination of base and maximum charge 46
5.4 General Discussion of the models 47
6 Summary and Conclusions 50
References 53
Appendices
Appendix A The Port’s Value Chain 55
Appendix B Determination of Wharfage charge 56
Appendix C Questionnaire & Responses 58
Appendix D LCL & FCL computer model 61
LIST OF TABLES
Table 3.1 Break-bulk cargo including banana exports handled at 20 Port Castries 1992-2000 (Short tons)
Table 3.2 Break-bulk cargo excluding banana exports handled at 21 Port Castries 1992 – 2000 (Short Tons)
Table 3.3 Imported and exported containerized cargo at Port Castries 21 1992 – 2000 (TEUs)
Table 3.4 Tonnages of imported and exported cargo transported in 22 containers at port Castries 1992 – 2000 (Short Tons)
Table 3.5 Comparison of Break-bulk and containerized cargo 22 handled at Port Castries 1992 – 2000
Table 5.1 Personnel Costs Incurred Dockside 36
Table 5.2 Equipment Costs Incurred Dockside 37
Table 5.3 Estimation of Wharfage Charges per Container 39
Table 5.4 Comparison of Container Charge with Cargo Handling and 40 Cargo Dues
LIST OF FIGURES
Figure 3.1 Composition of import tonnages by break-bulk 23 and containerised cargo 1992 – 2000
Figure 3.2 Percentage contribution to total import tonnage by break-bulk 24 and containerized cargo 1992 – 2000
Figure 3.3 Composition of export tonnages by break-bulk and 24 containerized cargo 1992 – 2000
Figure 3.4 Percentage contribution to total export tonnage by break-bulk 25 and containerized cargo 1992 – 2000
LIST OF ABBREVIATIONS
CIF Cost Insurance Freight
CPV Cost-Performance-Value Strategy EC Eastern Caribbean
ECD Eastern Caribbean Dollars FCL Full Container Load FLT Forklift Truck
GDP Gross Domestic Product GNP Gross National Product GRT Gross Registered Tonnage
ISO International Organisation for Standardization LCL Less than Container Load
LOA Length Overall
MSOC Marginal Social Opportunity Cost SLASPA Saint Lucia Air and Sea Ports Authority SLMTL Saint Lucia Marine Terminals Limited TEU Twenty Foot Equivalent Unit
1
INTRODUCTION
1.1 The Concept Of Logistics And Supply Chain Management
In recent times the advent of Globalisation has had a profound impact on all aspects of trade and transportation. Goods are no longer necessarily produced in one place but instead may consist of many individually manufactured components from various parts of the globe. Consequently, manufacturers are now increasingly utilizing the concept of Logistics Management to better manage the global scope of their businesses. As defined by the Council of Logistics Management, logistics management is
the process of planning, implementing and controlling, the efficient, effective flow and storage of goods, services, and related information from point of origin to point of consumption for the purpose of conforming to customer requirements. (Lambert, Stock & Ellram 1998,3)
Rather then viewing the manufacturing process as comprising separate and distinct components, modern managers must now take heed of what is termed the supply chain. This chain follows closely the definition of logistics management described above, the aim of which is to provide the customer with value.
1.2 Role Of Ports Within The Supply And Transport Chain
Given the shift in focus to that of an integrated supply chain, ports now represent critical nodal points within that chain since the bulk of world trade is transported via the sea. The importance of ports within the supply chain can easily be illustrated if one understands that a minimum of two ports is required for the effective operation of a sea transport activity. Consequently, high levels of inefficiency or exorbitant port tariffs can impact negatively on the various supply chains both in terms of actual cost and time. Alternatively, efficient and fairly priced ports can improve the supply chain.
In recent times, faced with increased competition from other ports and forms of transportation, ports have responded by attempting to provide added value to their customers. In adopting such strategies, ports (knowingly or unknowingly) have further integrated themselves into the transport and supply chains. No longer are ports simply nodes for the exchange of cargo from ships to other forms of transport. Instead they play an increasing role of processing/refining cargo within the port compounds prior to onward delivery. Additionally, ports provide logistical solutions by acting as major distribution centres for multinational companies serving varied regions. A classic example of this can be seen at the Port of Copenhagen, which acts as a major regional distribution centre for both UNICEF and Sony Co. Numerous other examples abound around the world.
1.3 Port Pricing
In seeking to provide services to its varied users ports incur costs that have to be recovered in one form or another. However, the issue of its recovery is one that has produced much debate over the years because of the varied forms of ownership of ports around the world. Based on the various forms of ownership, the services provided by the ports have been viewed at one extreme, as serving the general public economic interest whose costs should be paid through taxation and at the other extreme as a purely commercial venture which needs to recover its costs from the users of its services and facilities (Strandenes & Marlow 2000). An overview of this debate will be provided in chapter 2.
Emanating from this debate and with the increasing trend towards commercially oriented ports, agencies such as UNCTAD have attempted to provide ports with a method of cost recovery and pricing strategy suitable to varied forms of port ownership. First proposed in 1975, UNCTAD advised ports to develop tariffs for their services based on three elements: a) costs, to recover expenses incurred by the port in providing services and facilities; b) utilization, to promote the better use of port assets; and c) prices structured on what the traffic can bear (UNCTAD 1995). This approach is known as the Cost-Performance-Value approach. They argued that use of this approach would not only allow for adequate recovery of the costs incurred in the delivery of the port services but at the same time allow ports to use pricing as a main tool to achieve their operational, financial and marketing objectives.
1.3.1 Cost-Performance-Value Strategy
port is provided in Appendix A. Each component of the strategy is tailored to suit the individual objectives of the port body as described in the chart below:
Pricing Strategy Objectives
Cost • Revenues sufficient to maintain the quality of service
• Revenues to fund new business activities
• Prices to reflect costs and provide cost mechanism
Performance • Prices high enough to encourage efficient use of service
Value • Prices low enough to compete for new cargoes
• Prices not so high as to discourage growth of captive cargoes
• Prices high enough to capture profit from those who benefit most from port services
Adapted from UNCTAD. (April 1999).
1.4 Problem Identification
Whilst Ports readily adapt the cost and performance components of the CPV pricing strategy, the value-based component presents a unique challenge. As proposed by UNCTAD the value-based pricing strategy can be applied to differentiated cargoes through broad definitions such as general cargo including break-bulk and containerised cargo, dry and liquid bulk cargoes. However, the substitution effect as evidenced by global movements away from trade in break-bulk cargo for containerised cargo will cause a rethinking of the value-based component of the CPV pricing strategy as it is applied to cargo.
very premise of the value-based tariff will be eroded since original break bulk cargo would now all be transported as LCL containers. In this situation, ports are seeking to implement a value based tariff system for cargo dues / wharfage would need to differentiate those cargo owners who stand to benefit the most from the use of the port services. However, since the port’s break bulk cargo traffic has been converted to containerised cargo, the imposition of a fixed charge (cargo dues / wharfage) to all containers handled, regardless of the type and value of the cargo contained therein, means that the charge levied represents a higher proportion of the lower valued cargoes as compared with the higher valued cargoes. For example, a fixed wharfage charge of $100/box levied against one box loaded with computers valued at $500,000 and another loaded with textiles valued at $100,000 results in the following. The wharfage on the box with the computers represents only 0.02% of the value of the computers whereas it amounts to 0.1% of the value of the textiles. The incidence of the wharfage applied in this manner thus distorts the true value of the respective cargoes transported in the containers. Therefore, the new challenge to ports is to apply value-based tariffs (e.g. cargo dues/wharfage) to cargoes transported in containers perhaps based upon the differentiation and value of the actual items transported. This would ensure that port pricing is in keeping with the cost structure of the relevant supply chains thereby meeting the strategic objective of the port itself.
1.5 Objective
The main aim of this thesis is to assess the efficacy of a computer based model (using appropriate computer software) that will assist ports wishing to utilize a market driven pricing strategy in the establishment of value-based tariffs for cargoes transported in containers and as break bulk. In seeking to address the above this thesis will: -
2. Explore the efficacy of applying value-based tariffs for break bulk cargoes based upon their respective values.
Such a model, when provided with the required inputs will propose an upper and lower limit within which the tariff may be set.
1.6 Significance Of Research
The rapid spread of globalisation and supply chain management continues to place increased pressure on port administrators to abolish traditional port management methods in favour of modern business practices. Consequently, port pricing plays an important role since it has the ability to adversely affect the supply chain and in so doing the value afforded to the end customers. As containerisation continues to replace break-bulk cargo transport, port administrators will be hard pressed to adopt modern pricing policies, such as value-based strategies, that will augment rather than distort the relevant value chains within the supply chain. Port administrators will therefore be provided with an alternative method for the application of value based pricing strategies on cargo transported in containers and break-bulk cargo.
1.7 Methodology
Statistics and data gathered from the Saint Lucia Air and Sea Ports Authority (SLASPA), which owns and operates the Port of Castries situated on the island of Saint Lucia in the West Indies, was utilised in seeking to explore the efficacy of a computer based model for the establishment of a value-based tariff.
Microsoft Excel (a spreadsheet computer software) was used for research and development of the proposed model.
1.8 Limitations Of The Research
Ø Difficulty in obtaining all pertinent information regarding CIF values for cargoes imported/exported through Port Castries from the Customs Department or SLASPA
2
OVERVIEW OF PORT PRICING
2.1 Background
The various approaches to the issue of port pricing have been greatly influenced by the differing types of ownership of the ports themselves. As mentioned in the introductory chapter, the ownership of ports vacillates between State (local or regional government) owned to that of a private commercial enterprise. Within these two extremes ownership of ports around the world take on varied forms and combinations, which then impact on the approaches taken to port pricing. This occurs because each type of ownership would have its own objective. For instance, a state owned port might seek to advance the economic interests of the country at the expense of any financial goal. Thus the port would not seek to recover all of its costs from the users of its services. Rather, its operation would be financed through taxation that would then be received as a direct subsidy from the government. At the other end of the spectrum is a privately owned port whose main objective would be that of profit maximization. Consequently, the users of its services would be made to cover all costs plus an added premium (Strandenes & Marlow 2000).
or at least be able to stand on their own. Nevertheless, it is generally agreed that common to all these approaches is the use of economic techniques and principles to solve the question of port pricing
2.2 Traditional Cost Based Approach
Prior to the 1970’s most ports practised some form of traditional cost based pricing wherein a financial approach to pricing was utilized. This practise is continued in some measure to the present day. Under this approach to pricing, tariffs are usually set at levels that seek to recover fixed and variable costs while providing an adequate return on investment and working capital employed (Frankel, E.G. 1987). Consequently, average cost is most often used in the determination of the tariff levels. However, as stipulated by Frankel (1987), use of this approach is extremely complex since pricing generally determines the level of demand and in doing so affects the long-run cost and the level of return.
2.3 Economic Approach To Pricing
During the 1970’s developments in the area of port pricing attempted to change the traditional approach of using purely accounting costs (fixed and variable costs) to establish port tariffs. Using economic theory, it was argued that prices should be developed on the amount of resources used in providing that particular service rather than on what the service produced. Essentially, the marginal cost should be used as the base rather than average costs. Jansson and Ryden (1979) proposed a two-part tariff scheme based upon the usage of marginal costs. They proposed a charge to be levied per tonne on cargo differentiated with respect to its elasticity of demand and another charge to be levied on the carrier to reflect the opportunity cost of using the facility.1
1
Departing slightly from this approach, writers such as Button (1979) attempted to introduce a system wherein the users of the port would be required to pay the full marginal social opportunity cost (MSOC) of the resources they use at the port. The MSOC pricing approach starts from the axiom that the port provides a public service and as such its main objective is the economic good of the state or country that it serves. Consequently the port seeks, at best, to break even financially with regard to its operating costs. Following from this premise it can easily be conferred that the State owns the port. Button (1979) attempted to formalise this approach utilizing ‘New Welfare Economics’. Differing slightly from the theorists at that time, Button applied economic theories based upon parking space allocation rather than on road usage that was commonly used. He argued that the MSOC system of pricing acted as a rationing mechanism that gave priority to potential users who were prepared to pay all costs (including external costs) for utilizing the port’s services (Button 1979). However, in discussing this method of pricing, Button acknowledged that economies of scale experienced in most ports would present particular problems if the short run marginal cost pricing was used. Under conditions of increasing returns, the capital costs associated with investment in items such as infrastructure and superstructure would not be recoverable. As a result Button proposed three alternative ways of recovering these capital expenditures. He suggested that the government could directly subsidize the investments or alternatively the port authority could practise a system of discriminate pricing. As another alternative, Button proposed that the port could adopt a two-part tariff using the MSOC pricing for the cargo handled and a fixed periodic charge for the right to use the facility. This user charge would then reflect the capital expenditures.
government subsidies would allow for the continued operation of the ports. Nevertheless, they cautioned the use of such subsidies since they realised that there were significant practical arguments against its use.
2.4 Congestion Pricing Approach
Having realised that excessive demand for port services creates congestion within ports, Bennathan and Walters (1979) suggested that the use of congestion levies and surcharges might provide ports the opportunity to earn high profits. They argued that increasing the price (congestion levy) would provide users the incentive to economise on the scarce resource. Similar to this approach, Strandenes and Marlow (2000) advocate the use of congestion pricing to obtain efficient exploitation of the port capacities. Nevertheless they contend that the main part of the congestion cost is related to the opportunity cost of vessel time since it reflects the alternative income the vessel foregoes by postponing the next fixture and the capital cost of the cargo itself. Whilst not articulated in that precise form, Bennathan and Walters (1979) indicated that ship owners were quick to add their queuing costs to the freight rates. Thus any increase or application of congestion levies would perhaps benefit the port at the expense of the shippers if the demand for port services was inelastic. They also contended that its practical application would present problems especially if the congestion tended to be seasonal. As a result, prices would vary over the season making it difficult to administer.
2.5 Strategic Pricing
approach to port pricing it was suggested that ports should focus on three elements: costs, to recover the expenses incurred in providing port services and facilities; utilization, to rationalize the use of port assets; and prices structured on what the traffic can bear (UNCTAD 1995). Utilizing this multi-faceted approach to pricing meant that ports could now use port pricing as a main tool in assisting ports to achieve their strategic goals and objectives. Consequently, the term strategic pricing as defined by UNCTAD 1995 is “the use of pricing as a mechanism for achieving competitive advantage.” This approach to pricing was enhanced by Arnold (1985), who also suggested that port tariffs should be based on a mix of pricing strategies that were designed to reflect the demand for port services, the competition amongst ports, and the costs incurred in providing those services.2
In furthering the idea of focusing on three elements in order to set port tariffs, UNCTAD (1975) proposed the ‘cost, performance, value (CPV) approach.’ They claim that this approach allows managers to accomplish different sets of objectives through the use of tariffs. As described by Strandenes and Marlow (2000), “cost based tariffs can maximise the use of port services; performance based tariffs can maximise the throughput and reduce congestion; value based tariffs generate sufficient revenue to cover the port’s costs.” In effect it is argued that the CPV approach provides flexibility for the port managers in establishing tariff limits. Thus, since the port cannot charge less than the incremental cost of providing the service, and cannot charge more than the value received by the user, the approach establishes both a floor and a ceiling for pricing purposes (Strandenes & Marlow 2000).
The use of pricing as a strategic element in meeting the strategic goals and objectives of ports has been further developed and applied to the recent phenomena of port privatisation. Ashar, A (2001) discusses the use of this principle for newly privatised ports and seeks to develop a formal methodology for performing strategic pricing
2
analysis. In doing so he recommends that adoption of this approach would facilitate stability and avert possible price wars.
2.6 General Discussion
Having reviewed the literature on port pricing it is evident that the issue has been the subject of much thought and discussion especially during recent times. Whilst no one writer has been able to satisfactorily argue for any one approach to pricing, there appears to be a gradual shift towards the use of strategic pricing for all the various types of port ownership. As ports continue to evolve, they are no longer viewed as providing a public service and are consequently challenged to be self-sustaining and to operate along commercial lines. In this regard, the use of the CPV approach as suggested by UNCTAD appears to be aptly suited to this purpose. Nevertheless, one of the major drawbacks to its use is the high level of data that is required by the port in order to correctly utilize this approach to tariff setting.
Although first mooted in 1975 for the port sector, the value-based approach to price setting is currently widely used in other forms of business. One example of this was
cited by George Cressman, a product-pricing consultant at Strategic Pricing Group Inc. in Marlboro, Massachusetts (Steadman, C. 2000) who indicated
3
PORT CASTRIES
AND
THE SAINT LUCIA AIR AND SEA PORTS AUTHORITY
3.1 The Island Of Saint Lucia
The island of Saint Lucia is located midway down the eastern Caribbean chain of islands. At coordinates 13.53° N and 60.68° W, Saint Lucia is one of the Windward Islands of the Lesser Antilles. Situated between the islands of Martinique to the north and Saint Vincent to the south, Saint Lucia is bordered by the Atlantic Ocean on its eastern coast and the Caribbean Sea on the west. Measuring 27 miles (43 km) at its longest point and 14 miles (22 km) across at its widest point, Saint Lucia approximately covers 238 sq miles (381 sq km). Within this relatively small landmass, the island supports two deep-water harbours – Port Castries located in the northern part of the island and Port Vieux-Fort located at the southern most tip of the island. Two airports assist in meeting the needs of air transport to and from Saint Lucia. Hewanorra Airport located in the south of the island has a runway length of 9,000 ft (2,744 metres) and George F. L. Charles Airport located in the north has a runway length of 6,200 ft (1,890 metres). (Saint Lucia Air and Sea Ports Authority 2000).
3.2 Basic Facts About Saint Lucia
shared by eight small island economies of the Eastern Caribbean comprising Anguilla, Antigua and Barbuda, Commonwealth of Dominica, Grenada, Montserrat, St Kitts and Nevis, St Lucia, and St Vincent and The Grenadines and is managed by a central monetary authority, the Eastern Caribbean Central Bank. (Eastern Caribbean Central Bank, 1999). Saint Lucia recorded an estimated GDP in 1999 of 650 million US dollars that translated into a GNP per capita of USD 3,770 (The World Bank Group, 2000).
3.3 Overview Of The Saint Lucia Air And Sea Ports Authority (SLASPA)
Established by Parliamentary Act No. 10 of 1983, the Saint Lucia Air and Sea Ports Authority (SLASPA) is charged with the responsibility of providing for co-ordinated and integrated systems of airports, seaports and port services. (Saint Lucia Air and Sea Ports Authority Act, Government of Saint Lucia Printing Office 1983) Thus responsibility for the management of both airports and both seaports falls within the purview of SLASPA. Being governed by this act means that SLASPA is a statutory body which ultimately reports jointly to the Minister of Finance and the Minister of Communications and Works. As customary for organisations of this type, SLASPA is administered by a ten-member council whom are appointed by the Head of State whilst a management team manages the day-to-day operations.
As stipulated by the Act, the revenues of SLASPA are derived from all dues and charges levied with respect to the services that it provides. However, supplementary income may be derived from loans acquired from the Government or other organisations.
3.4 Physical Characteristics Of Port Castries
channel width of 400 ft (122 metres), a draught of 42 ft (13 metres) and a turning circle radius of 1400 ft (427 metres). Being a multipurpose terminal, Port Castries comprises 5 berths (3 of which are continuous) totalling 2542 ft (775 metres) with a maintained depth alongside of 32 ft (9.75 metres). The majority of break-bulk operations are handled at berths 2 and 3, which have a combined quay length of 750 ft (229 metres). Berths 4 and 5 handle the majority of the container traffic with berth 5 having the ability to handle ro-ro vessels. The main export of the island, bananas, is handled at berth 6 which is also used to handle a range of bagged and bulk commodities including lumber, cement etc. Two additional berths are provided as part of a dedicated cruise ship facility. These berths measure 400 ft (122 metres) and 300 ft (91 metres) respectively with a maintained draft of 36 ft (11 metres).
Storage facilities at the port include 6 individual sheds for dry cargo with a combined covered shed storage area of 120,000 sq ft (11,200 m2.). Four cold storage facilities are also provided with a combined storage capacity of 66,402 cu ft (1881 m3). Sixty refrigerated containers can be simultaneously serviced at the port through connections to the reefer points located at the port. The space available for storage of containers at the container park is currently limited to 400 teu ground slots.
Two mobile shore cranes, one of which was newly commissioned in April 2000, provide cargo-handling capability at the port. Four high capacity top handlers and an empty container handler provide quay transfer, stacking, delivery and receipt operations for containerised cargo. This is supplemented by terminal tractor-trailer yard operating equipment. Stuffing and stripping container operations and break-bulk handling is carried out using various capacity forklift trucks (Flt’s).
3.4.1 Management And Operation Of Port Castries
Terminals Limited (SLMTL), that is a subsidiary of SLASPA. In this relationship Port Vieux Fort is a tool port with all the infrastructure and superstructure provided by SLASPA for which leasing fees and dividends are paid in return by SLMTL. Nevertheless, all management and stevedoring operations at Port Castries are still provided by SLASPA who recruits labour from the Seamen Waterfront and General Workers Union. Consequently, SLASPA is deemed an operating port authority at Port Castries.
3.4.2 Tariffs
The tariff schedule established and governed by Statutory Legislation in 1985 for all services rendered at the ports in Saint Lucia continue to the present without any amendments having been made. As stipulated in the tariff, SLASPA does not recognise individual owners of cargo but rather imposes all applicable dues on the vessels themselves. Nevertheless, charges such as storage for cargo held at the port in excess of the regulated free period is directly charged to the cargo owner. Identical tariffs are levied in the Port of Vieux-Fort since SLMTL is a subsidiary company of SLASPA.
This thesis will concentrate on the application of ‘Cargo dues’ (Wharfage) levied against break-bulk and containerised cargo. The following is extracted from the Saint Lucia Air and Sea Ports Authority (Seaport Tariff) Regulations with regards to the application of ‘cargo dues’ for break-bulk and containerised cargo:
SCHEDULE 4 (BREAK-BULK)
4. Cargo Dues Ships using a Port shall pay Cargo Dues as
follows:-
(I) Cargo carried in ships over 100 GRT - $6.00 per
ton or part thereof landed or loaded.
(II) Cargo N.O.S. carried in ships under 100 GRT -
(III) Cargo consisting of agricultural products of Saint
Lucia carried in ships under 100 GRT – 50 cents
per ton or part thereof landed or loaded.
SCHEDULE 6
DUES AND CHARGES FOR CONTAINERS
2. Other Dues and Charges Other dues and charges for containers shall
be as follows:-
(I) For landing or shipping a container loaded with
cargo - $400.00 per TEU
(II) For landing or shipping an empty container -
$100.00 per TEU
The charges in (I) and (II) above shall include Cargo
Dues and Cargo Handling but shall not include
stevedoring, storage charges or any stuffing and
unstuffing.
It should be noted that the charges quoted above and throughout this thesis are and will be in the local Eastern Caribbean Currency. Although both cargo handling and cargo dues are incorporated into one charge for containers, they will be separated when the aspect of containers is dealt with in chapter 5.
3.4.3 Traffic
3.4.3(a) Break-bulk Cargo
Port Castries handled a total of 158,634 tons of imported and exported break-bulk in the year 2000. Imported break-bulk of 111,373 tons accounted for approximately 70% of that total whilst exports, inclusive of banana exports, comprised 47,261 tons representing 30% of the total. The following table shows the tonnages of break-bulk imported and exported through Port Castries for the period 1992 – 2000.
Table 3.1 – Break-bulk cargo including banana exports handled at Port
Castries 1992 – 2000 (Short Tons)
YEAR IMPORT EXPORT TOTAL
1992 133707 83824 217531 1993 126759 75296 202055 1994 114682 58747 173429 1995 116130 65124 181254 1996 115267 57978 173245 1997 118044 34807 152851 1998 118956 37157 156113 1999 130232 40664 170896 2000 111373 47261 158634
Source: Compiled from SLASPA annual Statistical Digest 1993, 1996, 1998, 1999, 2000
Analysis of the above reveals that Port Castries recorded a 27% reduction in total break-bulk imported and exported through the port as compared with 1992 tonnages. Exports of break-bulk recorded a 43.7% reduction in exported tonnages in the year 2000 as compared with 1992 tonnages. Imports of break-bulk also reduced by 16.7% in 2000 as compared with 1992 levels.
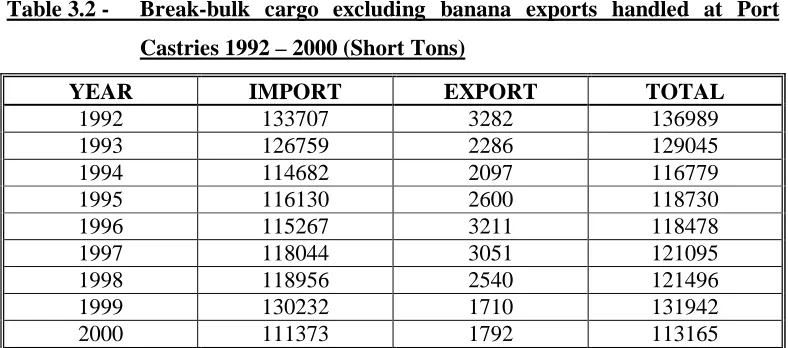
Table 3.2 - Break-bulk cargo excluding banana exports handled at Port
Castries 1992 – 2000 (Short Tons)
YEAR IMPORT EXPORT TOTAL
1992 133707 3282 136989 1993 126759 2286 129045 1994 114682 2097 116779 1995 116130 2600 118730 1996 115267 3211 118478 1997 118044 3051 121095 1998 118956 2540 121496 1999 130232 1710 131942 2000 111373 1792 113165
Source: Compiled from SLASPA Annual Statistical Digest 1993, 1996, 1998, 1999, 2000
3.4.3(b) Containerised Cargo
In the year 2000, Port Castries handled a total of 27,050 TEUs, which comprised import, export, and transhipment of both full and empty containers. This represented an increase of 7.8% over 1999 levels. However, as indicated earlier, cargo dues are only levied on imported or exported containers at Port Castries. Accordingly, only the levels of imported and exported containers are highlighted in the following table. Nevertheless, it should be pointed out that transhipment business conducted at Port Castries amounted to 1,281 teu’s in the year 2000.
Table 3.3 - Imported and exported containerised cargo at Port Castries 1992
– 2000 (TEUs)
IMPORT EXPORT TOTAL TOTAL
YEAR Empty Full Empty Full Import Export Imp/Exp
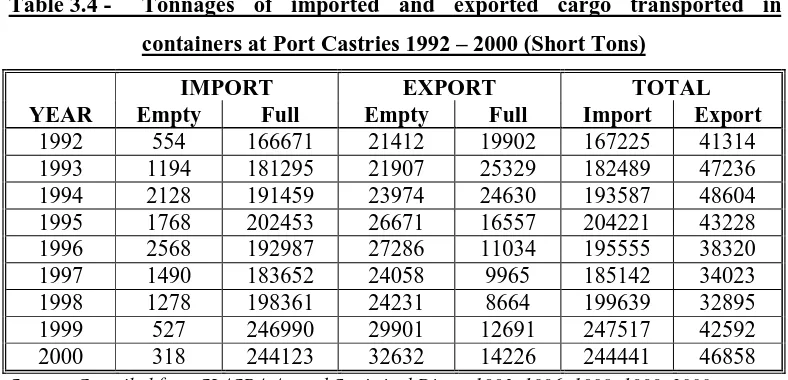
The trends observed for both break-bulk and containerised cargo handled at Port Castries suggests that the port might be experiencing a substitution effect from cargo being transported as break-bulk to that transported in containers. Consequently, the tonnages of cargo transported in containers for the same period was compiled in order to allow for comparison with break-bulk activity. The result is illustrated in the following tables.
Table 3.4 - Tonnages of imported and exported cargo transported in
containers at Port Castries 1992 – 2000 (Short Tons)
IMPORT EXPORT TOTAL
YEAR Empty Full Empty Full Import Export
1992 554 166671 21412 19902 167225 41314 1993 1194 181295 21907 25329 182489 47236 1994 2128 191459 23974 24630 193587 48604 1995 1768 202453 26671 16557 204221 43228 1996 2568 192987 27286 11034 195555 38320 1997 1490 183652 24058 9965 185142 34023 1998 1278 198361 24231 8664 199639 32895 1999 527 246990 29901 12691 247517 42592 2000 318 244123 32632 14226 244441 46858
Source: Compiled from SLASPA Annual Statistical Digest 1993, 1996, 1998, 1999, 2000
Table 3.5 - Comparison of break-bulk and containerised cargo handled at
Port Castries 1992 – 2000
YEAR IMPORT EXPORT TOTAL
General Cargo Containers General cargo Containers GC CONT
1992 45% 55% 14% 86% 42% 58%
1993 41% 59% 8% 92% 38% 62%
1994 37% 63% 8% 92% 35% 65%
1995 36% 64% 14% 86% 35% 65%
1996 37% 63% 23% 77% 37% 63%
1997 39% 61% 23% 77% 38% 62%
1998 37% 63% 23% 77% 37% 63%
1999 35% 65% 12% 88% 34% 66%
2000 31% 69% 11% 89% 30% 70%
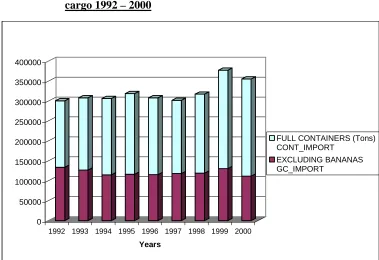
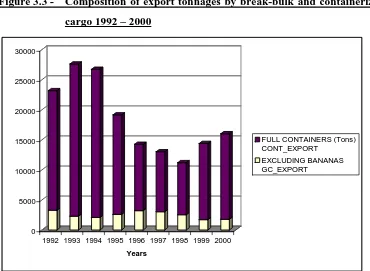
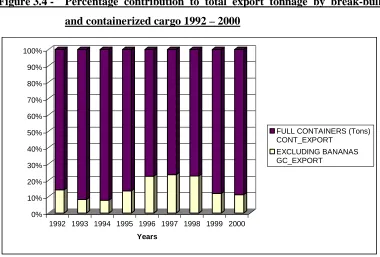
It can be ascertained from the above data that the percentage share of break-bulk tonnages to the overall tonnages of import and export cargo handled at the port decreased over the period. More specifically, whilst break-bulk imports represented 45% of total imports in 1992 this decreased to 31% in 2000. Similarly, break-bulk exports decreased from 14% in 1992 to 11% in 2000. This scenario is presented in the following figures.
Figure 3.1 - Composition of Import tonnages by Break-bulk and containerized
cargo 1992 – 2000
0 50000 100000 150000 200000 250000 300000 350000 400000
1992 1993 1994 1995 1996 1997 1998 1999 2000
Years
FULL CONTAINERS (Tons) CONT_IMPORT
Figure 3.2 - Percentage contribution to total import tonnage by break-bulk
and containerized cargo 1992 – 2000
0% 20% 40% 60% 80% 100%
1992 1993 1994 1995 1996 1997 1998 1999 2000
Years
FULL CONTAINERS (Tons) CONT_IMPORT
EXCLUDING BANANAS GC_IMPORT
Figure 3.3 - Composition of export tonnages by break-bulk and containerized
cargo 1992 – 2000
0 5000 10000 15000 20000 25000 30000
1992 1993 1994 1995 1996 1997 1998 1999 2000
Years
FULL CONTAINERS (Tons) CONT_EXPORT
Figure 3.4 - Percentage contribution to total export tonnage by break-bulk
and containerized cargo 1992 – 2000
0% 10% 20% 30% 40% 50% 60% 70% 80% 90% 100%
1992 1993 1994 1995 1996 1997 1998 1999 2000
Years
FULL CONTAINERS (Tons) CONT_EXPORT
EXCLUDING BANANAS GC_EXPORT
4
THE VALUE CHAIN AND EXISTING TARIFF STRUCTURE
OF
PORT CASTRIES
4.1 Value Chain and Tariff Structure of Port Castries
4.2 Value Added Services to the Ship
The services to the ship provided by SLASPA can be broken down into two main categories namely safe navigation and services at the berth. Thus the value added from these activities is provided to the shipowner and the various freight forwarders operating at the port. This value is created through the speedy and careful handling of cargo to and from the ships within a reasonable time period (UNCTAD 1995) and the safe berthing of ships.
4.2.1 Safe navigation
SLASPA provides value to the ship through activities and facilities such as the provision of aids to navigation, adequate depth of the channel and alongside the berths, compulsory pilotage for ships over 100GRT and towage for ships greater than 250 feet LOA. These services ensure that all vessels entering or leaving the port are provided with safe navigation. Recovery of the costs associated with the provision of these facilities and services is sought by various charges as detailed in the Seaport Tariff.
The charge for pilotage is calculated per move differentiated according to the GRT of the vessel serviced. This charge starts at EC$25 per move for vessels under 100 GRT up to a maximum of EC$300 per move corresponding to vessels over 20,000 GRT. Since the pilots are monthly paid workers of SLASPA, the charge attempts to recover the fixed costs associated with the salaries of the pilots and the fixed and variable costs associated with the capital cost and the variable operational costs of the pilot vessels.
Similar to pilotage, the charge for towage is calculated per move starting at EC$400.00 per move for vessels measuring 400 feet LOA to a maximum of EC$500.00 per move for vessels 500 feet and over. However, although towage is charged by SLASPA the service is provided by a private company, Tugs Ltd, who invoices SLASPA based upon a different scale. The amounts actually billed to SLASPA by Tugs Ltd for the towage services performed are calculated at a rate of EC$1.24per foot per move. In addition, although SLASPA does not charge towage to ships below 400 feet LOA they nevertheless pay Tugs Ltd a flat fee of EC$350 per ship per move for all ships below 400 feet LOA. Consequently, SLASPA subsidizes the cost of towage charged to all ships.
4.2.2 Services at the berth
This aspect of the value chain provided at Port Castries includes berthing, stevedoring, equipment, water, bunkers, garbage removal, communications and wharf handling. Although all of these services that add value to the ship, are available at the berth, they are not all provided by SLASPA. Individual service providers who invoice the ship separately provide all the services of water, bunkers, garbage removal and communications. The Water and Sewerage Company provides water at the berths; various individual contractors hired by the ship’s agents themselves provide garbage removal; local agents of Shell and Texaco provide bunkers via tanker lorries and the sole telecommunications provider, Cable and Wireless St. Lucia Ltd offers landside communication services.
berthing, the tariff is segmented into three areas including running lines, pratique and clearance.
Running Lines is charged on the arrival, shifting and departure of ships and is calculated in accordance with the GRT of the vessel. A minimum charge of EC$15.00 is applied for ships under 100 GRT up to a maximum of EC$80.00 for ships over 5,000 GRT between the hours of 0800 and 1600 Monday to Friday. This tariff is doubled for work conducted at any other time. Although the charges are applied and calculated by SLASPA, a private company, Lawrencin Lines Ltd performs the tasks on SLASPA’s behalf. Consequently, they are paid 70% of the revenues generated from the tariff applied by SLASPA for running lines.
The tariff for ‘pratique’ is calculated and applied similar to that of running lines. A charge of EC$10.00 is charged to all ships under 100 GRT that is not engaged in commercial trading at any time. However, a similar charge of EC$10.00 is applicable to ships under 100 GRT who are engaged in trading but increases to EC$20.00 for ships over 100 GRT. Again this charge is only applicable between 0800 hrs to 1600 hrs Monday to Friday. The respective charge for vessels engaged in trading doubles for work conducted at any other time. The clearance charge on the other hand is a singular charge of EC$20 for all ships using the berth regardless of type, size or business orientation.
15,000 GRT. The cumulative vessel charges collected in the financial year 2000/2001 were approximately EC$2.1 million.
Cargo dues are paid in accordance with the weight of break bulk cargo carried by ships in port. Ships over 100 GRT pay EC$6.00 per ton of cargo carried and ships under 100 GRT pay EC$1.00 per ton of break bulk cargo carried. These cargo dues are also applied to transhipment cargo on both movements. Ships carrying containerised cargo also incur cargo dues but this charge is incorporated cargo handling charges into a singular charge of EC$400.00 per TEU for full containers and EC$100.00 per TEU for empty containers.
Passenger dues of EC$10.00 per passenger embarking or disembarking is charged to all ships carrying passengers at the port. For passengers in transit, a charge of US$5.00 (Head tax) is charged instead of the embarkation or disembarkation tariff quoted above. However, it must be mentioned that the passenger in transit levy is applied on behalf of the government of St. Lucia for which SLASPA is given 25% of the revenues generated from this tariff item. Nevertheless, the portion of the head tax received by SLASPA is used to recover a EC 30 million dollar investment in two dedicated cruise ship berths constructed and commissioned in 1999. The application of the tariff for passengers including that for in transit passengers contributed EC$2.7 million for the financial year 2000/2001.
Various other charges apply for break bulk cargo overlanded or overcarried, sorting of cargo within a bill of lading and for coopering (handling damaged cargo or repairing the packaging). A charge of EC$16.00 per ton is also charged for handling break bulk transhipment cargo. Containerised cargo on the other hand is charged at a rate of EC$400.00 per TEU for landing or shipping a full container and EC$100.00 per TEU for landing or shipping an empty container. As stated earlier, this charge also includes cargo dues for use of the berths. Transhipment containers are charged EC$200.00 per TEU for full containers and EC$100.00 per TEU for empties. Additional charges of EC$70.00 per TEU per move for full containers and EC$20.00 per TEU per move for empty containers is levied for shifting containers during stevedoring operations. Total charges to cargo contributed EC$11.2 million to revenue for the financial year 2000/2001.
4.3 Value Added Services to the Cargo
Value added services rendered to cargo at Port Castries consist of cargo processing, storage and information processing. However, SLASPA’s tariff is limited to that of cargo processing and storage.
4.3.1 Cargo storage
Storage at Port Castries is limited to that of short-term storage and consequently the charges for storage are penal. Import and export cargo are allowed a free storage period of five days, excluding Saturdays, Sundays and Public Holidays. Transhipment cargo is granted 21 free days and empty containers are allowed 30 days free excluding the weekends and Public holidays as mentioned for import and export cargo. Cargo stored in excess of the allotted time incurs a cost of EC$3.50 per ton for the first two succeeding days directly following the free period. This amount increases to EC$8.00 per ton for each succeeding three day period following 21 days in excess of the free storage period. Cargo stored in excess of three months at the port are placed on auction to recover the cost associated with the storage and also the recovery of any Customs duties that may be payable.
4.3.2 Cargo processing
4.4 Other Services to Users
Other value added services provided by SLASPA at Port Castries centres around leasing of warehouses and office spaces and the provision of security. Currently, SLASPA provides 80,000 cubic feet of cold storage facilities which are leased to private companies. As part of the leasing arrangements, SLASPA provides maintenance and security whilst the private operators are responsible for the payment of monthly rentals and utilities. All leasing fees are negotiated but SLASPA ensures that the agreed monthly rentals adequately covers the costs associated with the general maintenance and security of these facilities.
In 1996, SLASPA invested approximately EC$3 million and converted a cargo shed into a modern duty free shopping complex to service the in transit passengers onboard cruise ships. The shops within this complex are leased to various private individuals and companies who pay SLASPA a monthly rental. The negotiated leasing fees were calculated to recover the initial investment costs alongside other costs including maintenance, administration and security.
The security service available at Port Castries is provided by a permanent department of Port Police existing within the SLASPA establishment. Consequently, although SLASPA does not charge any user directly for its security services, the costs associated with the provision of this service are calculated and factored into other user charges. Thus both the ship and cargo owner benefits and pays for security services provided by SLASPA.
4.5 Other Port Activities
having to pay for it directly. The necessary funding is acquired from a multitude of other tariff items, most of which were discussed above.
4.6 General Discussion
5
DEVELOPMENT OF A COMPUTER BASED MODEL
5.1 Identification Of The Wharfage Component Within The Container Charge
As stated in earlier chapters, wharfage forms part of a unitary charge levied on containers passing through the Port of Castries with the exception of transhipment containers. Consequently, the wharfage component has to be identified in order to allow further analysis regarding its conversion to a value-based format.
The first step in seeking to disaggregate the wharfage component is to detail all the various components included within that unitary charge. A review of the tariff schedule shows that the charge of EC$400/TEU for loaded containers and EC$100/TEU for empty containers includes both cargo handling and cargo dues (wharfage). The inclusion of only these two charges allows for easier computation.
5.1.1 Calculation Of Cargo Handling Costs
charges incurred at the Port with the exception of storage charges). Thirdly, all stevedoring charges are applied separately.
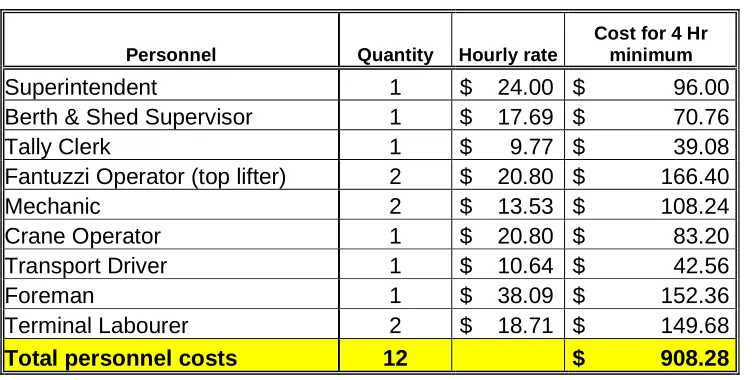
Following from this information the necessary second step is the identification of the personnel costs incurred by SLASPA on the dockside. Table 5.1 below identifies the various personnel involved in the dockside operations and calculates the total costs incurred over the four-hour minimum period.
Table 5.1 - Personnel Costs Incurred Dockside
Personnel Quantity Hourly rate
Cost for 4 Hr minimum
Superintendent 1 $ 24.00 $ 96.00 Berth & Shed Supervisor 1 $ 17.69 $ 70.76 Tally Clerk 1 $ 9.77 $ 39.08 Fantuzzi Operator (top lifter) 2 $ 20.80 $ 166.40
Mechanic 2 $ 13.53 $ 108.24
Crane Operator 1 $ 20.80 $ 83.20 Transport Driver 1 $ 10.64 $ 42.56
Foreman 1 $ 38.09 $ 152.36
Terminal Labourer 2 $ 18.71 $ 149.68
Total personnel costs 12 $ 908.28
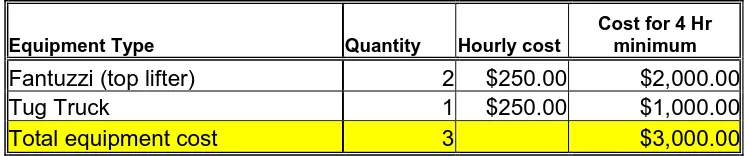
Table 5.2 – Equipment Costs Incurred Dockside
Equipment Type Quantity Hourly cost
Cost for 4 Hr minimum
Fantuzzi (top lifter) 2 $250.00 $2,000.00
Tug Truck 1 $250.00 $1,000.00
Total equipment cost 3 $3,000.00
Given these costs, the average cargo handling cost per TEU can then be calculated utilising the personnel and equipment costs calculated above in conjunction with the average productivity (estimated at 13 TEU per hour as provided by SLASPA) of the container gang. The resultant calculation is provided below.
Figure 5.1 - Calculation of Cargo Handling Cost per TEU
Total personnel cost 908 Total equipment costs 3000 Total personnel and equipment costs 3908 General administrative cost (10%) 391 Total Handling cost over 4 hr minimum 4299
Average productivity (TEU/ hr) 13 Average TEUs handled in 4 hour period 52 Estimated average cargo handling cost per TEU $82.68
5.1.2 Identifying The Wharfage Charge
Knowledge of the cargo handling charge is relevant but insufficient to estimate the wharfage component of the unitary charge levied on containers. Given that SLASPA was unable to provide the relevant basis upon which the wharfage for containerised cargo was levied, it became necessary that an assumption be made regarding the basis of application of the wharfage component as it relates to containers. This assumption was developed based upon an analysis of reasoning behind the application of any wharfage charge.
it is that ‘weight’ that passes over the wharf. Consequently, wharfage can be applied based on the gross weight of containers passing over the wharf or berth.
Based on the above discussion of wharfage, the assumption made at this juncture is that wharfage for containers at Port Castries is applied similar to that of general cargo on ships over 100 GRT as stated in the Tariff of the Port and outlined in Chapter 3. Using this assumption implies that EC$6 per short ton is charged to all containers both loaded and empty. The suitability of this assumption is assessed using the estimated cargo handling costs in conjunction with the container charges.
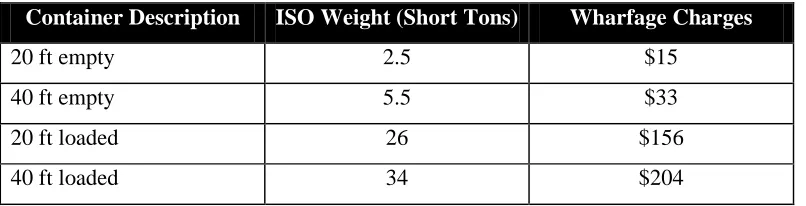
Use of the ISO standardized container weights (both empty and full) in conjunction with the assumed Wharfage charge of EC$6.00 per ton would allow the Port to calculate wharfage charges as indicated in the following table. The ISO standardized container weight is used since SLASPA keeps a uniform charge on all containers regardless of their individual weights, which may vary when loaded.
Table 5.3 – Estimation of Wharfage Charges per Container
Container Description ISO Weight (Short Tons) Wharfage Charges
20 ft empty 2.5 $15
40 ft empty 5.5 $33
20 ft loaded 26 $156
40 ft loaded 34 $204
Table 5.4 – Comparison Of Container Charge With Cargo Handling And Cargo
Dues
Container
description Charge
Cargo handling
cost Cargo dues Total cost Difference
20 ft empty $ 100 $ 83 $ 15 $ 98 $ 2 40 ft empty $ 200 $ 165 $ 33 $ 198 $ 2 20 ft loaded $ 400 $ 83 $ 156 $ 239 $ 161 40 ft loaded $ 800 $ 165 $ 204 $ 369 $ 431
5.2 The Computer Model for Containerised Cargo
In developing the model, sample data regarding the number of containers, type (LCL or FCL) and the respective CIF values of the cargoes transported within was collected from SLASPA and the Customs Department of Saint Lucia for the period January to March 2001. This data was then sorted in descending order according to the CIF values. In order to facilitate further manipulation and analysis of the data, a subjective decision was then taken as to the relevant grouping of the data into three distinct value groups. Additionally, this action was taken since it was anticipated that the varying numbers, values and types (FCL, LCL) of containers occurring within the sample data would respond differently to price changes. This reasoning is developed further in the following section on the estimation of price elasticities. Since the values sampled ranged from approximately EC$1,000 to EC$900,000 the data was then segregated into the following groups:
Group A Less than EC$100,000 Group B EC$100,000 to EC$200,000 Group C Over EC$200,000
These groupings were then analysed to determine the proportion of FCL to LCL containers contained within each group. This information was deemed necessary in order to make an estimation of elasticity required for the model.
5.2.1 Estimation of Elasticity
In order to determine how the incidence of the value-based wharfage tariff would affect the trade of cargo in containers it was necessary that an estimation of the price elasticity of the container trade be calculated. Without the luxury of time wherein the price (wharfage) could be fluctuated and the ensuing change in container trade could be measured, another method or proxy had to be developed to assist with the estimation of the price elasticity.
operating in Saint Lucia was conducted using a questionnaire as illustrated in Appendix C. The response to this questionnaire although only received from a very small sample indicated that all the port charges (including wharfage) were passed on to the shippers or consignees of the cargo. This suggested that the trade in containerised cargo would be less elastic to price changes since the shipping lines did not have to bear the increase in costs. Whilst this knowledge was very informative it nevertheless could not be incorporated into the model. Consequently, an assumption was made using the knowledge obtained from the questionnaire and the corresponding number of consignees associated with FCL and LCL containers transiting the port. From the data received it was realised that LCL containers have many consignees for the cargo transported within whereas FCL containers are usually consigned to one consignee. In the situation of Port Castries, all LCL containers are destuffed at the port since none of the shipping lines or freight forwarders offer destuffing services outside of the port compound. Consequently, it was generally assumed that traffic involving LCL containers would be less elastic to price changes than FCL containers since the increase in costs would be shared amongst many consignees of cargo within each box. This increase in cost would probably represent a small cost per consignee as opposed to that borne by a single consignee of an FCL shipment. This assumption regarding elasticity was then incorporated into the model. Consequently, trade in containers was deemed to be price elastic if FCL containers within any group amounted to more than 60% of the total boxes handled in that group. Conversely, the trade in containers was deemed to be price inelastic if the percentage of FCL containers was less than 60% of total boxes handled in that group. For the purposes of calculations in the model, price elasticity was valued between 1 and infinity (1 < Ed < ∝). Price inelasticity was
valued between 0 and 1 (0 < Ed < 1). This followed the convention of multiplying
Following this logic, the elasticities for the container trades within each value group was subjectively estimated at (2) for the Group A with cargo below EC$100,000, (0.85) for Group B with cargo within the range EC$100,000 - EC$200,000 and (0.5) for Group C with cargo valued above EC$200,000. The respective elasticities were chosen because FCL containers represented 64% of containers handled in Group A which suggested that the trade would be price elastic, Group B with an elasticity of 0.85 was price inelastic since the FCL containers amounted to 35% of boxes handled whereas Group C was treated as more price inelastic with a value of 0.5 since FCL containers comprised only 25% of boxes handled. It must be noted that these elasticity values were subjectively assigned and as such field experiments would need to be conducted in order to ascertain their appropriateness.
5.2.2 Determination of Base and Maximum Charge
respective total CIF values for break bulk cargo and containerised cargo must be calculated and expressed as percentages of their combined CIF value (i.e CIF value of break bulk plus CIF value of containerised cargo). The annual berth depreciation expense is then allocated to the various cargo traffic based upon the respective percentages of the total value of break bulk and containerised cargo handled at the port or berth as explained earlier. The minimum wharfage is then calculated as indicated above using this new figure.
The maximum wharfage charge per box, expressed as a percentage of the CIF value of the cargo transported inside, is calculated to maximise total wharfage revenue given the estimate of elasticity for the particular container trade. Thus, in instances of the trade being price elastic the wharfage revenue can only be maximised by reducing the tariff to an appropriate level wherein both trade and total revenue would be maximised. Conversely, the model also allows for the maximisation of wharfage revenue for instances when the trade in containers is deemed to be price inelastic. The model also provides the relevant effect on quantity traded whenever elasticity or price is varied. This task of maximising wharfage revenue is accomplished by use of the excel function ‘solver’ which allows the user to set the ‘wharfage revenue after price change’ to a maximum by varying the new price. Further analysis including determining the ‘elasticity value’ that will enable the port to maximise revenue for a given price increase can be performed by the model through use of either the ‘goal seek’ or ‘solver’ function.
a percentage of the average CIF value of the box (as calculated above), is calculated using the existing wharfage charge to provide the model with the initial tariff from which to analyse the impact of price and resultant trade movements. An illustration of the model is presented in Appendix D. The overall results as obtained by the model are presented in the following table.
Table 5.5 – Results Of Computer Model For Containerised Cargo
Group A Group B Group C
Less than 100000 100000 - 200000 Greater than 200000
Estimated Elasticity 2 0.85 0.5
Initial Traffic (Boxes) 25 20 8
Average CIF value per box $ 45,458 $ 138,123 $ 394,705
Initial Wharfage Charge as % of
average CIF value per box 0.37% 0.13% 0.05%
Estimated initial wharfage
revenue as predicted by model $ 4,188 $ 3,696 $ 1,488
Estimated maximum wharfage
revenue as predicted by model $ 4,712 $ 3,720 $ 1,674
Difference $ 524 $ 24 $ 186
Wharfage charge corresponding
to maximised wharfage revenue 0.28% 0.15% 0.07%
Predicted Traffic (Boxes) 38 19 6
Initial wharfage revenue based on
empirical data $ 4,188 $ 3,696 $ 1,488
Predicted wharfage revenue
based on empirical data $ 3,141 $ 4,022 $ 2,232
Difference $ (1,047) $ 326 $ 744
Minimum Wharfage as calculated
by model 0.014% 0.014% 0.014%
cargo-handling tariff is one such area that would allow the port to increase its overall revenue as it relates to the container trade.
5.3 The Computer Model for Break Bulk Cargo
Similar to the analysis conducted above for the container trade, basic parameters must be established prior to the actual analysis itself. One such factor is the estimation of price elasticity. In the absence of detailed analysis of price elasticity of break bulk cargo it is generally assumed that the trade is price elastic since the packages tend to belong to only one consignee who must bear the full cost of transiting or using the port. Based on this assumption, the elasticity assigned to that of break bulk is (3) since it is assumed that the trade is more elastic than the container trade in Group A mentioned earlier.
Another parameter that has to be established is an average CIF value per short ton of break bulk cargo handled at the port. Similar to that devised for the container trade, this average CIF value per short ton of cargo is kept constant and used by the model in the future prediction of cargo trade and revenues. As in the case of the container trade, this weakness can be rectified through continuous data collection and analysis in order to assist with the identification and prediction of any trends that would allow the model to be refined.
5.3.1 Determination of Base and Maximum Charge
The calculation of a minimum wharfage charge for break-bulk cargo is proposed to cover that portion of the berth depreciation expense, attributed to break-bulk cargo handling. This base charge is calculated by expressing the allocated berth depreciation expense as a percentage of the estimated annual value of break-bulk cargo transiting the port. Whilst the limitation of the data provided by the Customs department did not allow for the exact replication of this proposal, a base charge was developed for the period under review by extrapolating the depreciation expense for the same period as covered by the data provided.
Having developed the model along the same lines as fashioned for the container trade, the maximum wharfage charge is determined by maximizing the wharfage revenue given the allocated elasticity for the trade. This is achieved via use of the ‘solve’ function in Microsoft Excel in which the model is developed. A curious scenario occurred when this wharfage charge was determined. The model indicated that the minimum charge was higher than that proposed to maximise the wharfage revenue. Further analysis of this scenario is warranted but the inability to verify the information sourced from St. Lucia negated any further attempt. Nevertheless, the model indicates that use of the minimum price as calculated would essentially stop all trade in break bulk cargo given the estimated price elasticity. Alternatively, the wharfage revenue would be maximised at that price if the trade in break bulk cargo is inelastic i.e. having a value between zero and one. An illustration of the model is appended as Appendix E.
5.4 General Discussion of the Models
conducted manually with numerous incidences of re-entering of information thereby contributing to human error. This situation could be avoided if the port community was linked via one computerised system such as is done in larger ports like Aärhus in Denmark.
Another area that needs further analysis but may constitute a thesis on its own is the estimation of price elasticities of the various cargo trades. Whilst an attempt is made to circumvent this estimation as discussed earlier, the model would be better served with a more definitive calculation of price elasticity. This would provide the port with a clearer indication of the response of their clients to the proposed changes in tariff. The privilege of time will allow a port to vary the prices of its services and observe the resultant impacts on the various trades. In doing so, extensive collection of data and observation of customer reactions will enable ports wishing to utilise this model to refine the aspect of price elasticities. Nevertheless, operators of ports should have a fair understanding of their customers preferences that will enable them to estimate the elasticities required to be input into the model until more definitive information is obtained.
As previously discussed, one of the fundamental assumptions of the model is the constant average CIF values of the various cargo trades. Consequently, changes in the future CIF values of the cargo transported would significantly alter the actual outcome as compared with that proffered by the model. Thus, whilst this method allows for some insight into future actions based upon suggested price changes and estimated elasticities it is recommended that the model be used as a tool to assist with the process of tariff setting rather than an actual predictor of price.