University of New Orleans University of New Orleans
ScholarWorks@UNO
ScholarWorks@UNO
University of New Orleans Theses and
Dissertations Dissertations and Theses
5-20-2005
How States are Meeting the Highly Qualified Teacher Component
How States are Meeting the Highly Qualified Teacher Component
of NCLB
of NCLB
Jean Pinney
University of New Orleans
Follow this and additional works at: https://scholarworks.uno.edu/td
Recommended Citation Recommended Citation
Pinney, Jean, "How States are Meeting the Highly Qualified Teacher Component of NCLB" (2005). University of New Orleans Theses and Dissertations. 272.
https://scholarworks.uno.edu/td/272
HOW STATES ARE MEETING THE HIGHLY QUALIFIED TEACHER COMPONENT OF NCLB
A Dissertation
Submitted to the Graduate Faculty of the University of New Orleans
in partial fulfillment of the requirements for the degree of
Doctor of Philosophy in
Educational Administration
by
Jean Pinney
B.A. Stetson University, 1973 M.Ed University of Houston , 1977
ACKNOWLEDGEMENTS
Many people have helped make this study possible. It would be impossible to thank everyone who had a part in helping me complete this study but I would like to recognize a few who were instrumental in its completion. My committee members, Dr. Oescher, Dr. Theodore, and my chair, Dr. Peggy Kirby, helped guide me in this process. Dr. Oescher taught me the difference between limitations and delimitations and helped me keep my own biases out of the study. Dr. Theodore helped by viewing this study from the perspective of a former principal which helped in writing my implications for schools. Finally, a special thanks to Dr. Peggy Kirby who was my friend and my mentor. She was always there for me, even at 2:00 a.m. Dr. Kirby was never more than an e-mail away and answered all of my questions promptly. Without Dr. Kirby’s help and encouragement, I would not have finished this study in such a timely manner.
Two other people who helped me finish this study were fellow doctoral students, Ellen Lusco and Siham Elsegeheiny. Ellen was always willing to listen to my complaints and
frustrations. She was my sounding board and helped me get over some rough spots when I began to doubt myself. Siham helped me through nine hours of statistics. Her always positive attitude and belief in me made me work even harder to complete the study.
TABLE OF CONTENTS
List of Figures ...v
List of Tables ... vii
Abstract ... viii
Chapter 1...1
Introduction...1
Context...2
Statement of the Problem...4
Purpose of the Study ...6
Research Questions...6
Significance of the Study...7
Overview of Methodology...8
Definition of Terms...9
Chapter 2...10
Review of the Literature ...10
Chapter 3...20 Methodology...20 Introduction...20 Research Questions...20 Significance...21 Participants...21 Instrumentation ...22 Procedures...23
Data Analysis ...24
Chapter 4 ...31
Results...31
Introduction...31
Research Question 1 ...31
Response Rate for Research Question 1 ...31
Results for Research Question 1...32
Research Question 2 ...57
Response Rate for Research Question 2 ...57
Results for Research Question 2...57
Research Question 3 ...62
Response Rate for Research Question 3 ...62
Results for Research Question 3...62
Research Question 4 ...74
Response Rate for Research Question 4 ...74
Results for Research Question 4...75
Research Question 5 ...82
Response Rate for Research Question 5 ...82
Overview of Study ...91
Limitations of the Study...92
Implications for Veteran Teachers...94
Implications for Middle School Certification ...101
Implications for Teacher Education Programs ...106
Implications for State Departments of Education...108
Implications for School-Based Administrators...109
Recommendations for Future Research ...110
Conclusion ...111
References...114
Appendices...118
Appendix A: Questionnaire ...119
Appendix B: Revised Questionnaire...121
Appendix C: Certification Requirements...123
Appendix D: HOUSSE Requirements...127
Appendix E: Human Subjects Approval...129
Appendix F: Letter to Participants...132
LIST OF FIGURES
Fig. 1 Degrees Required Prior to NCLB ...34
Fig. 2 Semester Hours Required in a Subject to teach in Middle School...35
Fig. 3 Testing ...36
Fig. 4 State Evaluations ...38
Fig. 5 Certification Categories...39
Fig. 6 Grade Point Average ...40
Fig. 7 Specific Course Requirements...41
Fig.8 Degrees Required After NCLB...43
Fig. 9 Subject Hours ...44
Fig. 10 Teacher Testing ...45
Fig. 11 State Evaluations ...46
Fig. 12 Certification Categories...48
Fig. 13 GPA after NCLB ...49
Fig. 14 Specific Courses ...50
Fig. 15 Teacher Preparation Program ...51
Fig. 16 Recency of Credit ...52
Fig. 17 Comparison of Certification Requirements before and after NCLB #1 ….. 53
Fig. 18 Comparison of Certification Requirements before and after NCLB #2 …..53
Fig. 19 National Percentages of Not Fully Certified ...62
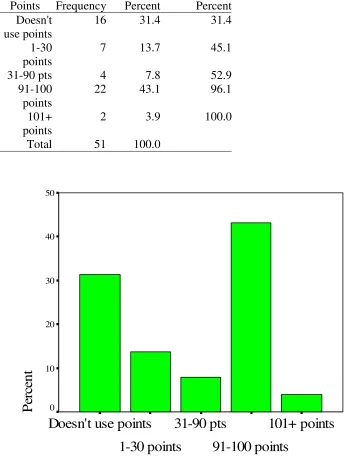
Fig. 20 Points Required for Highly Qualified Status...64
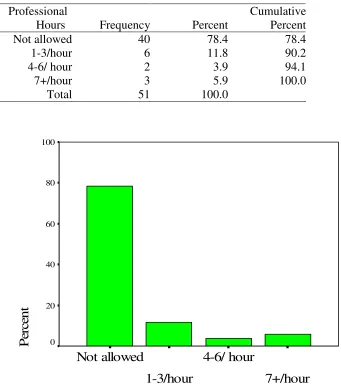
Fig. 21 Professional Hours...65
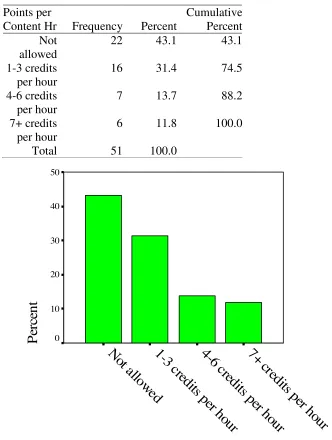
Fig. 22 Points per Content Hour ...66
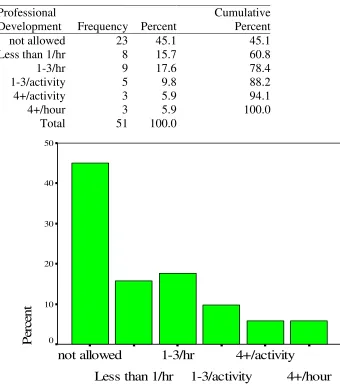
Fig. 23 Professional Development...67
Fig. 24 Professional Activities...68
Fig. 25 Experience ...69
Fig. 26 Recognition and Awards ...70
Fig. 27 Subject Area Points ...71
Fig. 28 Other Criteria for Points ...72
Fig. 29 Evaluations ...73
Fig. 30 Alabama – California Compared to National %...77
Fig. 31 Colorado – Florida Compared to National %...78
Fig. 32 Georgia – Iowa Compared to National % ...78
Fig. 33 Kansas – Maryland Compared to National % ...79
Fig. 34 Massachusetts – Missouri Compared to National %...79
Fig. 35 Montana – New Jersey Compared to National %...80
Fig. 36 New Mexico – Ohio Compared to National %...80
Fig. 37 Oklahoma – South Carolina Compared to National %...81
Fig. 38 South Dakota – Vermont Compared to National % ...81
Fig. 39 Virginia – Wyoming Compared to National %...82
Fig. 40 Middle School Teachers & # of “Highly Qualified” Needed #1... ………86
Fig. 41 Middle School Teachers & # of “Highly Qualified” Needed #2...87
LIST OF TABLES
Table 1 Certification Required before NCLB...25
Table 2 Certification Required after NCLB ...25
Table 3 Index of Change...26
Table 4 Percentage of Not Certified Teachers by Category ...27
Table 5 Requirements for New Teachers to be “Highly Qualified”...28
Table 6 Requirements for Not New Teachers to be “Highly Qualified”...28
Table 7 Certified and Not “Highly Qualified”, Both, or Neither...29
Table 8 Impact on Middle School Staffing...30
Table 9 Degrees Needed to Teach in Middle Schools Prior to NCLB...34
Table 10 Hours Required in a Subject ...35
Table 11 Teacher Testing Required...36
Table 12 State Evaluations...37
Table 13 Certification Categories ...39
Table 14 Grade Point Average...40
Table 15 Specific Courses ...41
Table 16 Degrees Needed to Teach in Middle Schools After NCLB...42
Table 17 Subject Hours Required to Teach in Middle School After NCLB...44
Table 18 Teacher Testing After NCLB...45
Table 19 State Evaluations...46
Table 20 Certification Categories ...47
Table 21 GPA ...49
Table 22 Specific Courses ...50
Table 23 Teacher Preparation Program Required...51
Table 24 Recency of Credit ...52
Table 25 Index of Change...54
Table 26 Percentage Not Fully Certified ...60
Table 27 Points Required for “Highly Qualified” Status...64
Table 28 Professional Hours...65
Table 29 Content Hours ...66
Table 30 Professional Development ...67
Table 31 Professional Activities ...68
Table 32 Experience ...69
Table 33 Recognition and Awards...70
Table 34 Subject Area Points...71
Table 35 Other Criteria for Points ...72
Table 36 Evaluations...73
ABSTRACT
As part of the reauthorization of the Elementary and Secondary Education Act the federal
government has added the requirement that all schools receiving Title I funds must have “highly
qualified teachers” in every classroom. The term “highly qualified teacher” comes from the No
Child Left Behind Act of 2001. What exactly is a “highly qualified” teacher? This part of the law
is widely debated throughout the fifty states, but most agree that a teacher’s subject-matter
knowledge and experience result in increased student achievement.(Ansell& McCase, 2003)
Some states have made progress in meeting the “highly qualified” requirement of NCLB.
However, most states have merely established the criteria for determining if a teacher is highly
qualified (Keller, 2003). The Education Trust has called for clarification from the Department of
Education on the guidelines for the teacher quality provision of the law. Ten states have put into
law all the requirements of the federal law, 22 have done some work toward that goal, and 18
states still have a long way to go (Keller) .
With so many states still grappling with compliance to the law, this study may well give
policy makers in those states options that are being used in other states to consider. In addition,
the study focuses on middle school and the possible impact these requirements will have on
staffing of middle schools. Policy makers would do well to look at this aspect closely since
middle school is often where education “loses” many students to dropping out. Also, the middle
CHAPTER ONE INTRODUCTION
As part of the reauthorization of the Elementary and Secondary Education Act (2001) the federal government added the requirement that all schools receiving Title I funds must have “highly qualified teachers” in every classroom. The term “highly qualified teacher” comes from the No Child Left Behind Act of 2001. What exactly is a “highly qualified” teacher? This part of the law is widely debated throughout the 50 states but most agree that a teacher’s subject-matter knowledge and experience result in increased student achievement (Ansell & McCase, 2003). The No Child Left Behind Act (2001) requires all teachers in core academic subjects be highly qualified by the end of the 2005-2006 school year. As part of the law, Congress has defined highly qualified as those possessing state certification and having solid content knowledge of the subjects they teach. The content knowledge can be demonstrated by passing subject-matter tests, having the equivalent of an undergraduate major in the field, or, for “not new” teachers, meeting the High Objective Uniform State Standard of Evaluation (HOUSSE) by the end of school year 2005-2006. The HOUSSE component is the area where the states have the greatest flexibility.
Louisiana has established the criteria for “not new teachers” to meet the “highly qualified teacher” requirement of NCLB. Louisiana requires teachers to have 90 Continuing Learning Units (CLU’s) by the end of the 2005-2006 school year. They may count hours earned as far back as January, 2002. The state defines a CLU as a professional development activity that builds capacity for effective, research-based, content-focused teaching and learning that has a positive impact on student achievement. In order to qualify as a CLU in Louisiana the
• Be aligned with Louisiana Content Standards, Benchmarks, and Grade-Level Expectations, and
• Be classroom focused and linked to the teacher’s current job responsibilities
The Louisiana State Board of Elementary and Secondary Education policy states educators may earn one CLU for each clock hour of active engagement in professional development. These CLUs may be face-to-face, online, or through video-conferencing. Only hours actually spent in the activity count so if there is an eight hour workshop with an hour for lunch only seven CLUs count. A three credit hour university course counts as 45 CLUs, and a 12 week online course counts for 45 CLUs, eight weeks is 30 CLUs, four weeks is 15, and a two week course is eight CLUs.
Having made the demand that every classroom have a highly qualified teacher, the federal government stepped back and left it up to the states to determine if a teacher met the criteria for highly qualified. This study reveals the vast range of criteria used by the various states and also highlights some commonalities in the various states’ definitions of highly qualified.
Context
According to the National Center for Education Statistics, Schools and Staffing Survey (1999-2000), 22% of secondary school students (9-12) in the United States are already taught by teachers without a major or minor in the subject and 37% are taught by teachers without both a major and certification in the subject (Ingersoll, 2002). According to the same source, about 44% of middle school students nationwide take a class with a teacher who hasn’t acquired even a minor in the subject taught.
A special analysis of results from the U.S. Department of Education’s 1999-2000 Schools
and Staffing Survey was conducted by Richard M. Ingersoll (2002). The data in the survey were
included departmentalized classes in grades 5-8, but this group was composed of predominantly
7th and 8th grade classes.
According to the analysis, 24% of secondary classes in core academic classes are taught
by teachers lacking even a minor in the subject, and in high poverty schools that rate rose to 34%
(Ingersoll, 2002). This statistic was even higher in the middle grades where 44% of middle grade
classes in core academic subjects were taught by a teacher who lacked even a college minor in
the subject being taught, and in high poverty schools that rose to 53% (Ingersoll, 2002). Further
results indicated this problem was particularly severe in mathematics where 70% of middle
school math classes in high poverty schools were taught by teachers without even a minor in
math. This survey defined a major as at least thirty hours in a subject and a minor as having
between 12 and 24 hours in a subject. These hours do not include methodology courses, and
majors such as science education do not count. The percentage of out-of-field teachers varies by
state but Louisiana ranked first with the highest percentage of teachers in secondary schools
teaching out of their field.
Public and private elementary and secondary enrollment is expected to increase 10% by
2006 (Hussar & Gerald, 1996). Of that increase, 5% is expected to occur in grades K-8 and 21%
in grades 9-12. As of 2001 there were 1,945,000 elementary teachers and 1,319,000 secondary
teachers working in the U.S. By the year 2006, it has been projected the U.S. will need 1,974,000
elementary teachers and 1,369,000 secondary teachers (Hussar & Gerald). This means an
increase of 32,000 elementary teachers and 50,000 secondary teachers in the U.S. These figures
only hold true if no teachers resign, retire, or move to positions outside of the classroom.
in the field and there will be an increase in the need for teachers in 2006. If one adds to this
dilemma the requirement that all teachers be highly qualified by 2006 then the question arises as
to how states plan to meet this requirement.
Statement of the Problem
The emphasis on “highly qualified teachers” in the NCLB Act is an attempt to address teacher quality or effectiveness. According to Rowe (2000), the most important source of variation in student achievement is not gender, socioeconomic status, nor school, but teacher quality. In a three-year study done in Dallas, students with very effective teachers were able to raise their test scores by 16 percentile points in both reading and math while those with
ineffective teachers saw their test scores drop by 18 percentile points in reading and 33 in math (Camphire, 2002).
The National Commission on Teaching and America’s Future (2003) described quality teachers as those who:
• have a deep understanding of their subject,
• understand how students learn,
• demonstrate the teaching skills needed to help all students achieve high standards,
• create a positive learning environment,
• use a variety of assessment strategies to respond to individual learning needs,
• integrate technology into the curriculum to support student learning,
• reflect on their own practices to improve their teaching and student learning,
• attend professional growth activities in both content and pedagogy, and
• instill a passion for learning in their students.
and systematic training do not lead to better teaching (Goldhaber & Brewer, 2000). The study was done with a very small sample, only 58 teachers, and thus rather small to support such an inference.
Darling-Hammond, Berry, and Thoreson (2000) found that certification has a stronger influence on student achievement than having a subject matter degree in the field which shows a positive but non-significant influence on student achievement in math and a negative influence in science. The effect size is actually several times larger for education degrees than disciplinary degrees (Darling-Hammond et al.). One of the ways to show subject matter knowledge in NCLB is to have a major in the subject taught, but according to this Darling-Hammond study, that does not have nearly as great an impact on student achievement as having an education degree. Just because someone knows the subject does not necessarily mean he or she knows how to teach it. Rudner (1999) found students of certified math teachers did significantly better in general math (p<.05) and algebra (p<.001) than those taught by non-certified teachers.
If certification matters, then, why isn’t that sufficient to guarantee teacher quality? The main problem appears to be that the requirements for certification are made at the
that state. From personal experience, I know that in order to be certified in Texas a teacher must take a class in Texas history. In California teachers must take a course in the U.S. Constitution and a fifth year of coursework if they do not have a master’s degree. Becoming Nationally Board Certified is one way teachers can avoid this problem and is a step toward a national teacher certification program.
Purpose of the Study
The purpose of this study was to do a comparative analysis of how the different states defined “highly qualified teacher.” The study examined all requirements for teacher certification both before and after the requirement for teachers to be highly qualified, and the impact the new requirements are predicted to have on middle schools throughout the United States due to the difficulty in finding enough “highly qualified” middle school teachers. In many states middle school teachers prior to NCLB could hold either an elementary teaching certificate or a secondary certificate, but the new law will require middle school teachers to have more single-subject content knowledge than is required of elementary school teachers and thus may impact the availability of “highly qualified” middle school teachers who meet this new criteria. The results of this study may influence policy makers in the United States as they struggle with how to define “highly qualified teacher” and how they can meet the requirements of the law.
Research Questions
This study was designed to focus on the middle school teacher. Several research questions, indicated below, were involved in the study.
1) What are the differences in certification requirements in each state for a middle school teacher before and after the enactment of NCLB?
4) What percentage of the current middle school teachers are certified but not highly qualified, are certified and highly qualified, or are neither highly qualified nor certified?
5) What impact will the “highly qualified” component of NCLB have on middle school staffing?
Significance of the Study
Some states have made progress in meeting the “highly qualified” requirement of NCLB. However, most states have merely established the criteria for determining if a teacher is highly qualified (Keller, 2003). The Education Trust has called for clarification from the Department of Education on the guidelines for the teacher quality provision of the law. As of 2003, ten states had put into law all the requirements of the federal law, 22 had done some work toward that goal, and 18 states still had a long way to go (Keller). Wisconsin determined that “highly qualified” means a bachelor’s degree, completion of an approved licensing program, and passing an exam in the subject taught (Keller, 2003). Tennessee will meet the standard by saying teachers are “highly qualified” based on improvement in student test scores. These requirements are generally applied to new teachers but states are struggling with how to determine if experienced teachers without a major in their field are “highly qualified.” Some states are utilizing the National Board Certification, meeting assessment requirements set up under an individual professional
development plan, or service on curriculum committees. More controversial methods are having three satisfactory evaluations or having 21 credit hours in the subject (Keller).
Overview of Methodology
This study was a descriptive study of all 50 states and the District of Columbia and how they are defining “highly qualified teacher” for middle schools. The participants for the study were the certification officers in each state. Every certification office in each state was contacted by the researcher via phone or e-mail prior to the start of the study to explain what was being studied. In January, 2005, a questionnaire, a cover letter reminding them of our previous contact, and a stamped return envelope were sent to each certification office. The letter also included alternate ways to contact the researcher, such as e-mail, FAX, or phone, for clarification or to respond to the questionnaire.
Three weeks following the initial mailings a FAX was sent to those certification officers who had not responded. The FAX consisted of a cover sheet briefly explaining the study again and the original questions with a request for their assistance. A third attempt to contact the certification officers who had not responded was made via e-mail six weeks after the initial mailings. Finally, a phone call was made to the certification officers who still had not responded to gain their co-operation in completing the data collection.
Several charts summarize the data collected. One table was constructed to show the various ways the states determine if a teacher was highly qualified. This table was then analyzed for commonalities and differences. These were then reported in chart form to highlight common themes. Two other tables were constructed showing certification requirements for middle school teachers prior to NCLB and another one showing certification requirements after NCLB. A comparison was made of the two tables and reported in an “index of change” table.
Definition of Terms
For the purposes of this study, middle school teachers are defined as those teaching sixth, seventh, or eighth grades. Secondary school teachers are those teaching ninth, tenth, eleventh, and twelfth grades and elementary are those teaching grades one through five. Any deviations from this definition by state are noted in the data.
The term “major” is defined as being 25% of the total number of hours in a degree program. This means if a degree program requires 128 credit hours then a major would require 32 hours. Similarly a minor is defined as 15% of the total hours and would require 19 credit hours.
Attrition is the number of people who leave the teaching profession. Ingersoll and Jerald (2002) called the high attrition rate in education the “revolving” door of teaching.
CHAPTER 2
REVIEW OF THE LITERATURE
An analysis of the federal Schools and Staffing data of 1994 and 2000 indicates that the
rate of highly qualified teachers based on certification and a major in the field did not improve in
the majority of the states. Using the 2000 data, only about two-thirds of the secondary math and
science teachers would meet the current NCLB criteria of highly qualified (Blank, 2003). Further
analysis of these surveys indicates that increases in enrollment, the need for more teachers, and
class size reduction policies have reduced the chances of having highly qualified teachers.
Fortunately, the requirements of NCLB allow the states some flexibility in determining other
criteria to determine if a teacher is highly qualified.
Based on recently released results from the federal Schools & Staffing Survey, the
percentage of out-of-field teaching is high, with the largest concentration of these teachers in
high poverty and high minority schools (Jerald & Ingersoll, 2002). The problem is even worse in
the middle school than in the high school. According to a comparison of this survey and one
done in 1993-1994, there has been no reduction in out-of-field teachers and as a matter of fact
there has been a slight increase.
The questions raised by the Jerald and Ingersoll (2002) study include why are there so
many out-of-field teachers, who is to blame for the problem, and are these teachers concentrated
in one area? Another major question is how and why this practice varies across the states.
from a large, representative sample of American teachers. For the purpose of the study secondary
classes were defined as departmentalized courses in seventh through twelfth grade and middle
level grades included departmentalized classes in fifth through eighth grade, but this group was
composed of predominantly 7th and 8th grade classes.
According to the analysis, 24% of secondary classes in core academic classes were taught
by teachers lacking even a minor in the subject and in high poverty schools that rate rises to 34%
(Ingersoll, 2002). This statistic was even higher in the middle grades where 44% of middle grade
classes in core academic subjects were taught by a teacher who lacked even a college minor in
the subject being taught and in high poverty schools this rose to 53% (Ingersoll, 2002). Further
results indicated this problem was particularly severe in mathematics where 70% of middle
school math classes in high poverty schools were taught by teachers without even a minor in
math. This survey defined a major as at least thirty hours in a subject and a minor as having
between 12 and 24 hours in a subject. These hours do not include methodology courses and
majors such as science education do not count. The percentage of out-of-field teachers varies by
state but Louisiana ranked first with the highest percentage of teachers in secondary schools
teaching out of their field.
There is no arguing the fact that teacher quality is a critical determinant of how much
students learn. Good teachers can advance their students a full grade level more than the students
assigned to a bad teacher (Sanders & Rivers, 1996). Further research confirms teacher quality
variables such as being fully certified and having a major in assigned teaching areas strongly
predict students’ individual achievement (Kaplan & Owings, 2001). The Secretary’s Annual
shows that 95% of high school teachers and 66% of middle school teachers had a degree in the
subject they taught or in subject area education which requires the equivalent number of hours as
a degree in the subject as well as methodology courses (Darling-Hammond & Youngs, 2002).
How can the same report state that only 38% have a degree outside of education and then say
95% of high school teachers have a degree in the subject they teach and 66% of middle school
teachers also have a degree in their subject? These figures are contradictory – you can’t have it
both ways. Feistritzer (1999) found schools with teacher preparation programs required
undergraduate students to have 36-39 hours in the subject they plan to teach and
post-baccalaureate students to have 31-33 hours in the subject they plan to teach. These hours do not
include methodology hours so in most states this is equivalent to the number of hours required
for a major in the field.
Jerald Ingersoll (2002) sees the problem with out-of-field teaching not simply one of
shortages in the teaching profession. They blame it on a combination of factors including the
way schools are organized and operated, and how teachers get assigned within the school
systems. They also attribute the problem to the “revolving door” nature of teaching where
teachers keep leaving the profession.
The Ingersoll (2002) study demonstrates the current problem with certified teachers in the
middle school on a nationwide basis. Further investigation needs to be done on the problem in
this country and how the definition of “highly qualified” will help or hinder the hiring of teachers
for the middle school, as outlined in the No Child Left Behind Act (2001).
Public and private elementary and secondary enrollment is expected to increase 10% by
teachers working in the U.S. By the year 2006, it has been projected the U.S. will need 1,974,000
elementary teachers and 1,369,000 secondary teachers (Hussar & Gerald). This means an
increase of 32,000 elementary teachers and 50,000 secondary teachers in the U.S. These figures
only hold true if no teachers resign, retire, or move to positions outside of the classroom.
Obviously that is not going to happen so the demand will be even greater. The data indicates that
the need to hire new teachers is not a result of more students but of teacher turnover (Ingersoll,
2002).
By 2007 there will be nearly three million more children in school than there are today –
approximately 54 million students (U.S. Department of Education, 1998). This is happening just
as teacher retirement is increasing meaning many of these children will be taught by new
teachers. Already more than 500,000 people enter the profession on emergency or provisional
licenses. Also, fewer than 75% of America’s teachers can be considered fully qualified, as
defined as being certified in the subjects or areas they teach which is not the same as highly
qualified in NCLB. This shortage is felt more in high poverty areas especially in science and
math. Two programs, Troops to Teachers and Teach for America, have been developed to help
overcome this shortage. Unfortunately over 60% of the Teach for America teachers leave after
the second year so they have not offered a long-term solution to the teacher shortage much less
to the shortage of highly qualified teachers (Education Week, 2004).
A large percentage of students in schools are already being taught by teachers without a
major or a minor in the field and there will be an increase in the need for teachers in 2006 even
though teachers already represent 4% of the entire civilian workforce (Ingersoll, 2002). If one
Chief Executive Officer for Human Resources, New York City schools, stated “We do not
expect to find any more teachers coming from the universities and colleges than currently are –
mandating legislation does not mean the supply of teachers will increase. So I do not know how
the federal government honestly expects the states/localities to meet this mandate by 2006”
(Education Week, 2004, p. #4).
However, all the news is not bad. In the past 15 years the number of new teacher
graduates has increased by 49% and the number of teacher preparation programs has increased
from 1,287 to 1,354 (Feistritzer, 1999). Some other interesting facts which arose from this
study:
• People are entering the field later in life and their academic careers
• 28% of prospective new teachers began their study at the post-baccalaureate level
• 65% of the teacher preparation programs offered alternative certification routes
• 49% of the prospective secondary teachers had degrees in fields other than
education
• 29% of the prospective elementary teachers had degrees in other fields
• 30% of the prospective middle school teachers had degrees in other fields
What does all this mean for the current study of highly qualified teachers? If all these
prospective teachers end up teaching in the field that their previous degrees were in, then they
would be considered highly qualified.
Some states have made progress in meeting the “highly qualified” requirement of NCLB.
However, most states have merely set-up the criteria for determining if a teacher is highly
and eighteen states still have a long way to go (Keller). Wisconsin has determined that “highly
qualified” means a bachelor’s degree, completion of an approved licensing program, and passing
an exam in the subject taught (Keller, 2003). Tennessee will meet the standard by saying
teachers are “highly qualified” based on improvement in student test scores. These requirements
are generally applied to new teachers but states are struggling with how to determine if
experienced teachers without a major in their field are “highly qualified”. Some states are
utilizing the National Board Certification, meeting assessment requirements set up under an
individual professional development plan, or service on curriculum committees. More
controversial methods are having three satisfactory evaluations or having 21 credit hours in the
subject (Keller). Virginia teachers can meet the highly qualified standard via performance
evaluations and subject matter competency (Education Week, 2004).
Louisiana has developed two sets of requirements to be deemed “highly qualified”.
Teachers who are new elementary teachers must have a valid elementary certificate and pass the
Praxis elementary education exam. A new middle school teacher (grades 6-8) must hold a valid
teaching certificate, pass the Praxis content area exam for every subject taught OR have a major
in every subject taught OR have earned a master’s degree in every subject taught. A new
secondary school teacher must have a valid secondary education teaching certificate for every
subject taught and pass the Praxis content area exam for every subject taught OR have a major in
every subject taught OR have earned a master’s degree in every subject taught. In addition to
these requirements, new teachers are required to complete 150 clock hours of professional
development over a five-year period to maintain their certification (Governor's Office of
requirement by achieving National Board certification or acquiring 90 Continuing Learning
Units by the end of the 2005-2006 school year (Louisiana Department of Education, 2004).
According to Rod Paige in his annual report on teacher quality, one of the problems with
using subject-matter tests to determine content knowledge is that each state determines its own
passing rate on the test (U.S. Department of Education, 2002). Often states set these scores
below the national average. The Praxis Pre-Professional Skills Test is used in 29 states, including
Louisiana, for certification. Louisiana has set the passing score on the reading part of this test at
172 which is less than the 20th percentile. In math, Louisiana set a passing score of 170, again
less than the 20th percentile. Writing is set at the 16th percentile for passing (U.S. Department of
Education).
State certification processes also need to be streamlined in order to facilitate the hiring of
teachers with higher academic standards (U.S. Department of Education, 2002). The Annual
Report on Teacher Quality recommends eliminating the student teaching component of the
certification process or making it optional. Attending a school of education would be optional,
and other bureaucratic hurdles would be eliminated (U.S. Department of Education). It appears
Louisiana is going in the opposite direction with its new certification structure by trying to keep
most of the old requirements and adding even more requirements.
Another aspect of certification attacked in the Secretary of Education’s report is
pedagogy. According to this report, “there is little evidence that education course work leads to
improved student achievement” (U.S. Department of Education, 2002, p. 19). Paige goes on to
say, “knowledge of pedagogy, degrees in education, or amount of time spent practice teaching
has taken this as gospel and now requires only nine hours of methodology coursework for middle
school teachers (grades 4-8), six semester hours in reading coursework, and nine hours of student
teaching.
The Secretary’s Annual Report has been challenged on many grounds regarding teacher
quality and preparation. The report suggests that it is based on solid research but the little bit of
research cited does not meet the Department of Education’s standards for the use of
scientifically-based research to formulate policy (Hammond & Youngs, 2002).
Darling-Hammond and Youngs (2002, p. 15) assert that the Secretary’s report “cites almost no research
that would meet scientific standards, misrepresents findings from a large number of sources, and
includes many unsupported statements about teacher education and teacher certification.” The
contention that teacher education and certification do not matter was refuted by a study done in
2001 which analyzed 57 studies correlating teacher education and teacher effectiveness as
measured by student achievement across socioeconomic status and prior achievement levels
(Wilson, Floden, & Ferrini-Mundy, 2001) Goldhaber and Brewer (2000, p. 139), in the same
report cited by the Secretary as saying a major in the field was more important than certification,
state :
The study also shows that certified teachers had a greater effect on student achievement than
having a degree in the subject they teach. This would suggest that taking the courses needed for
certification increases the effectiveness of teaching the content.
The 34th Annual Phi Delta Kappa/Gallup Poll set out to determine how the public feels
about the No Child Left Behind Act (2001) and the expanded role of the federal government in
education (Rose & Gallup, 2002). The questions in the poll relating specifically to teacher
certification are the ones of interest here. Nearly all of the respondents felt teachers should be
certified in the subject they teach. When asked what schools should do if there was a shortage of
certified teachers in the field, 93% indicated the most qualified teacher available should be used.
The survey was done using a sample of 1,000 adults over the age of 18. The sample used
was an unclustered, directory assisted, random-digit telephone sample based on a proportionate
stratified sampling design (Rose & Gallup, 2002). The final sample was weighted so the
distribution of the sample matched current estimates from the U.S. Census Bureau (Rose &
Gallup).
The poll yielded some interesting results concerning licensing (certifying) teachers. In
response to the question of how important it is to have teachers licensed by the state in the
subject area they teach, 84% of public school parents said it was very important and an
additional 13% said it was somewhat important. Respondents also felt that teachers should have
to pass a competency exam in the subject they teach before being certified. However, when
asked what schools should do if they cannot get enough certified teachers, respondents came up
with three alternatives. These were: use the most qualified teacher available, reduce the number
community. Only 8% felt getting good/quality teachers was a problem. This would seem to
indicate most people surveyed are satisfied with the quality of the teachers in their schools. If
this is true then why does the federal government feel it is necessary to add “highly qualified” to
the requirements to teach? Will this lead to more qualified teachers in the middle school or to a
CHAPTER 3 METHODOLOGY
Introduction
The purpose of this study was to analyze how the fifty states and the District of Columbia
defined “highly qualified teacher” for middle schools and then to explore how these new
definitions will impact staffing in the middle schools. As an administrator in a middle school, I
realize that finding good middle school teachers is difficult. Louisiana currently has no middle
school certification but has an elementary (grades 1-8) certification which allows individuals to
teach in the middle school. This certification means a teacher can teach more than one subject
and allows flexibility in middle school scheduling. With the new requirements for “highly
qualified” teachers, these elementary certified personnel will not qualify for middle school
teaching. Many states are facing similar dilemmas of how to recruit and retain enough middle
school teachers while also meeting the “highly qualified” stipulation of No Child Left Behind.
Research Questions
Survey research was used to obtain answers to the following research questions:
1. What are the differences in certification requirements in each state for a middle school teacher before and after the enactment of NCLB?
4. What percentage of the current middle school teachers are certified but not highly qualified, are certified and highly qualified, or are neither highly qualified nor certified?
5. What impact will the “highly qualified” component of NCLB have on middle school staffing?
Significance
It is important that administrators in middle schools and policy makers develop an understanding of what is meant by “highly qualified” under the No Child Left Behind legislation ( 2001) and how this differs across state lines. This new requirement will have significant impact on the process of hiring new teachers for middle school positions when the policy is fully
enacted for the 2006-2007 school year. Administrators of middle schools will have to delve more deeply into applicants’ preparation before assigning them to teach a single subject, personnel offices will have to specify what subject an applicant is allowed to teach in the middle school according to what they are considered to be “highly qualified” to teach, and policy makers will have to revamp certification structures to avoid the problem of having teachers who are certified but not “highly qualified”.
Participants
Certification officers from the states and the District of Columbia participated in this study.
Sometimes the certification function was carried out by other offices such as the teacher
credentialing office, educator licensing office, accountability office, educational credentialing
office, teacher standards board, board of educational examiners, or office of professional
preparation services. Regardless of the name, the jobs are the same – to evaluate and approve
applications for teacher certification. In some cases the certification officers referred the
questions to other personnel at their state department of education. The NASDTEC Manual on
The actual names of the people in the various state offices were obtained from the individual
states’ websites. Every certification office in each state was contacted by the researcher via
phone or e-mail prior to the start of the study to explain what was being studied.
Instrumentation
A questionnaire (See Appendix A) was developed for use in this research and piloted with
the cooperation of the certification officer in Delaware. The questionnaire and a transmittal letter
on UNO letterhead prepared by the researcher were mailed to the Professional Accountability
Office, Delaware Department of Education. The questionnaire asked for data concerning the
number of certified middle school teachers in the state, how many of these teachers would be
considered highly qualified, and what the certification officer believed the impact of NCLB
would be on staffing middle schools. A dialogue via e-mail was conducted to clarify any unclear
questions.
Questions 6 and 9 were the two questions needing clarification based on this field test. The
certification officer in Delaware was unsure how to respond to the question, “How many middle
school teachers are teaching out of their field?” The officer explained most of their middle
school teachers were certified in elementary education which allows them to teach every subject
so they could never be teaching out of their field. This question was modified to ask, “How many
middle school teachers are teaching with less than 12 semester hours in the subject they teach?”
Twelve hours was used because that was the least amount of hours found to constitute a minor in
the field.
The other question needing revision was, “What do the certification officers perceive the
was doing to increase middle school certification or how the state was changing middle school
certification. I told him what I was really looking for was how many middle school teachers
would meet the criteria for being “highly qualified” by the deadline given in the legislation. The
question was then revised to ask, “In your best informed estimate, what percentage of middle
school teachers in your state will be “highly qualified” by 2006?”. These questions were revised
to reflect the changes and the final questionnaire was developed (See Appendix B).
Procedures
This research used a macro approach, analyzing data collected from the State
Departments of Education (DOE) of all fifty states and the District of Columbia. The DOE
websites provided much of the initial data for the study. More detailed information was
collected, via a questionnaire, from state officials who deal with certification and the No Child
Left Behind Act of 2001. Clarification on information found on the websites was also collected
from these officials.
In addition to information found on each state’s website regarding certification and
“highly qualified teachers,” the Title II reports from each state made to the federal government
were studied to obtain further information. These reports were based on data from the preceding
year while the state’s websites were based on current data.
Once the questionnaire was developed, it was submitted to the University of New Orleans
Human Subjects Committee. Dr. Scott Bauer, then chairman of the committee, determined that
approval was not necessary for the study because all respondents were public officials. However,
Dr. Bauer left the University in August 2004 before the study could be completed. Thus, another
(depending upon which contact information was available from the state web site) prior to the
start of the study to explain what was being studied. In January, 2005, the questionnaire, a cover
letter reminding them of our previous contact, and a stamped return envelope were sent to each
certification office. The letter also included alternate ways to contact the researcher, such as
e-mail, FAX, or phone, for clarification or to respond to the questionnaire.
Three weeks following the initial mailings, a FAX was sent to those certification officers
who had not responded. The FAX consisted of a cover sheet briefly explaining the study again,
the original questions, and a request for their assistance. A third attempt to contact the
certification officers who had not responded was made via e-mail six weeks after the initial
mailings. Finally, a phone call was made to the certification officers who still had not responded
to gain their co-operation in completing the data collection.
Data Analysis
Research Question 1: What are the differences in certification requirements in each state for a
middle school teacher before and after NCLB?
Table 1
Certification requirements before NCLB
State Degree Hrs in
major
Testing State Eval.
Certification Categories
None B.A. M.A
.
Praxis NTE State
Test
K-6 K-8 Middle Sec.
The state evaluation column refers to new teacher evaluations which the teachers must pass in order to be considered fully certified. These evaluations usually are based on observations of the teacher in the classroom but may also include portfolios, video-taped lessons, and student input. The observations may be done by school-based administrators, district-level personnel, or outside observers.
Table 2
Certification requirements after NCLB
State Degree Hrs in
major
Testing State
Eval.
Certification Categories
None B.A. M.A. PRAXIS NTE State
test
K-6 K-8 Middle Sec.
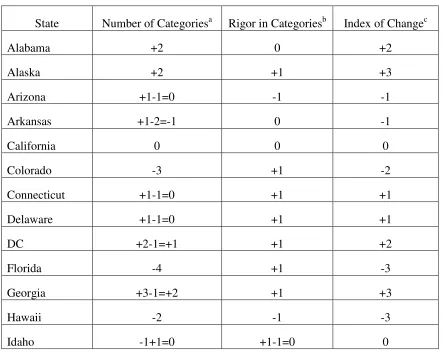
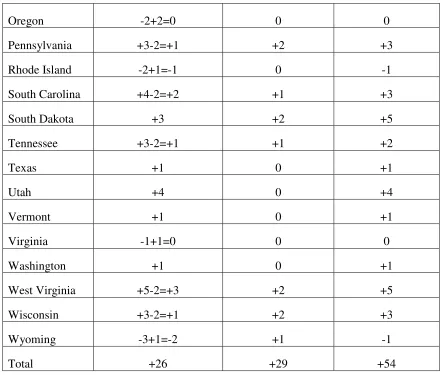
to determine how many categories a state typically changed in regard to certification and if the rigor of the requirements changed after the enactment of NCLB.
Table 3
Index of Change in Certification Requirements
State Number of Categoriesa Rigor in Categoriesb Index of Changec
Example (+2) -1 = +1 +2(after NCLB) +3
a Number of types of requirements that changed after NCLB b Relative rigor of requirements before and after NCLB c Number of categories + rigor = Index of change
Tables one and two answered Research Question 1: What are the differences in certification requirements in each state for a middle school teacher before and after the enactment of NCLB? Certification requirements prior to NCLB were obtained from the NASDTEC Manual on the Preparation and Certification of Educational Personnel (1999) and from the first question of the survey, “What were the certification requirements for middle school teachers before 2001?” Current certification requirements were found in the NASDTEC Manual on the Preparation and Certification of Educational Personnel (2003) and from question two of the survey, “What are the certification requirements for middle school teachers?”
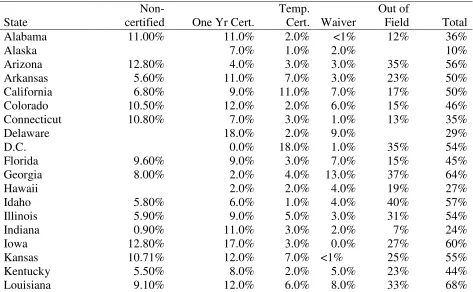
Research Question 2: What percentage of middle school teachers in each state are non-certified,
or working with a one year certificate, or teaching out of their field, or are teaching on waivers
in the middle school?
The data collected to answer Research Question 2 were shown in Table 4. This table evolved as new types of not fully certified certificates were discovered. If the same type of not fully certified certificate appeared in the response of five or more states then another column was added to the table. If it appeared less than five times it was simply listed under the other column in the table.
The data derived from the answers to Research Question 2 were analyzed on a percentage basis by state. This was done by adding all four categories to obtain a total for the state. These were averaged to obtain a national percentage.
Table 4
Percentage of Not Certified Teachers by Category
State One Year Cert. Temporary Cert.
Waiver Other Total
Research Question 3: What is the definition of a “highly qualified teacher” in each state?
Table 5
Requirements for New Teachers to be “Highly Qualified”
State Major in field Minor in field Subject Area Test Evaluation
Table 6
Requirements for “Not New Teachers” to be “Highly Qualified” (HOUSSE)
State # of CLUs Value-Added Experience Evaluations
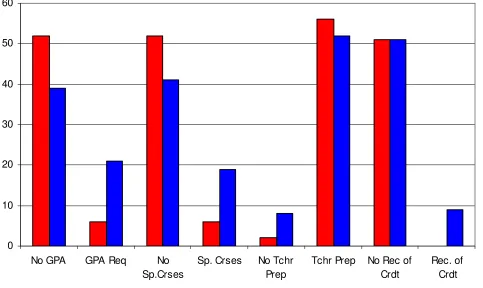
Table 5 shows the requirements for new teachers to be highly qualified in each state and Table 6 shows the requirements for veteran or “Not New Teachers” to be highly qualified. Information for the tables was compiled from each state’s Department of Education website and responses to question three of the survey, “What are the requirements for a middle school teacher to be highly qualified?” The tables indicating the requirements for a middle school teacher to be “highly qualified” were also analyzed using a frequency distribution. Each individual category was analyzed using a frequency distribution and presented as a bar graph. In addition, the table was analyzed as a whole using a frequency distribution by category and presented as a bar graph. Research Question 4: What percentage of the current middle school teachers are certified but
not highly qualified, are certified and highly qualified, or are neither highly qualified nor
certified?
entered into Table 7 and a frequency distribution was done and displayed in bar charts compared to the national average which was computed from the data collected from all states.
Table 7
Certified not Highly Qualified, Both or Neither
State Certified not highly qualified
Certified and highly qualified
Not highly qualified nor certified
Research Question 5: What impact will the “highly qualified” component of NCLB have on
middle school staffing?
Table 8
Impact of NCLB on Middle School Staffing
State # Middle School
Teachers
% “Not Highly
Qualified”
Predicted
Turnover %
Shortage Predicted # of Not Highly
Qualified Middle School
Teachers
As data arrived, they were entered into the various matrices. When new categories arose
they were added to the correct table. The column labeled shortage was calculated by adding
Turnover percentage and Not Highly Qualified percentage. This is not entirely accurate because
there will probably be some not highly qualified teachers included in the turnover percentage but
there is no way to predict this amount. This was considered the worst case scenario. A best case
scenario was also computed by assuming all of the turnover came from the “Not highly
qualified” percentage. This computation was done by subtracting the turnover percentage from
the percentage of “Not highly qualified” and multiplying the resulting percentage by the total
number of middle school teachers. The data are presented in summary form in Chapter 4 and the
CHAPTER 4 RESULTS
Introduction
In 2001 the No Child Left Behind Act was passed calling for major reforms in education
across the country. One of the least publicized of those reforms was the call for “highly qualified
teachers” in every classroom. While this component has not caught the attention of the general
public as much as the Annual Yearly Progress part of the law has, it has departments of
education across the country scrambling to comply. This study looked at how the fifty states are
meeting the challenge of putting a “highly qualified teacher” in every classroom.
Information was collected from a variety of sources. Questionnaires were mailed to the
certification offices of every state and DC requesting information pertinent to the study. A copy
of the questionnaire is found in Appendix B. Additional information was taken from each state’s
Department of Education website and information the states reported to the federal Department
of Education which was subsequently posted on its website.
Research Question 1
What are the differences in certification requirements in each state for a middle school teacher
before and after the enactment of NCLB?
Response Rate
Forty-seven states replied to Question 1 of the survey. Eleven states’ responses were very
on the Preparation and Certification of Educational Personnel. The data that was provided by
the states was compared to that in the NASDTEC manual and found to be identical except the
manual provided more detail. Seven states simply replied that they had no separate middle
school certification so all of the data for these states came from the NASDTEC manual. This
yielded a response rate of 92% even though they were not all complete responses.
Results for Question 1
Certification requirements for each state and the District of Columbia prior to NCLB were
obtained from the NASDTEC and from the first question of the survey, “What were the
certification requirements for middle school teachers immediately prior to 2001?”. Only 11
certification officers responded to this question with detailed explanations of the requirements
for middle school teachers. These eleven states were Colorado, Florida, Indiana, Kansas,
Maryland, Michigan, Missouri, Nebraska, New Mexico, Ohio, and West Virginia. The other 29
respondents were vague in their answers or did not have separate middle school certification.
Alaska, Arizona, California, Hawaii, Idaho, Illinois, Iowa, Louisiana, Maine, Minnesota,
Mississippi, Montana, Nevada, New Hampshire, New Jersey, New York, Oregon, South
Carolina, and Washington reported not having a separate middle school certification but allowed
teachers certified as K-6, K-8, K-9, or secondary to teach at the middle school level. The seven
other states answering question one, Arkansas, Hawaii, Pennsylvania, Rhode Island, South
Dakota, Tennessee, and Utah were a little vague in their responses by basically saying middle
school teachers either held elementary or secondary certification. Illinois and Kansas both
reported having had a K-9 certification, Delaware defined middle school as grades 5-8, and
prior to NCLB and after NCLB. Information for the table for any states who did not respond to
the survey or who did not answer Question one of the survey was obtained from the National
Association of State Directors of Teacher Education & Certification (NASDTEC).
Each category was analyzed using a frequency distribution and plotted on a bar chart.
Another frequency distribution was done for the entire table and also presented in visual form as
a bar chart. The data were presented individually in order to show the frequencies of the
subcategories under degree required, subject hours required for middle school teachers, testing,
and certification categories. The hours required in a subject to be taught in middle school are
shown as ranges. The ranges are 0-14, 15-19, 20-24, and 25+.
The first category, degrees required, refers to the type of degree necessary to teach in a
middle school prior to NCLB. The subcategory None was used in some states for vocational
courses, special courses such as Alaskan languages, and for some art and foreign language
courses. It is included in this chart because the arts and foreign languages are considered part of
NCLB when defining “highly qualified teachers”. All of the states that included none in their
responses for these subjects also required a BA for the other subjects so data for these states were
entered twice in SPSS. It was entered once for the “none” category and once for the BA. This
accounts for the total N in SPSS being 58 as opposed to 51. No states really required a master’s
degree to teach but some required a fifth year above the BA, so these were included in that
category. These data were not entered twice since those states will not issue a teaching credential
Table 9
Degrees Needed to Teach in Middle Schools Prior to NCLB
Degree
Frequency Percent
Cumulative Percent
none 7 12.1 12.1
BA 49 84.5 96.6
5th year 2 3.4 100.0
Total 58 100.0
5th year
BA
none
Pe
rc
en
t
100
80
60
40
20
0
Figure 1. Degrees required prior to NCLB
The second category, hours in subject, refers to the number of semester credit hours
recorded in the range of 25+. Maine required middle school teachers to have a total of 16 subject
hours but divided among four subjects so it was included in the range of 15-19. New York
required its middle school teachers to have six hours in each of four subjects so it was included
in the range of 20-24.
Table 10
Semester Hours Required in a Subject to Teach in Middle School Prior to NCLB
Hours Frequency Percent Cumulative Percent
0-14 32 55.2 55.2
15-19 13 22.4 77.6
20-24 10 17.2 94.8
25+ 3 5.2 100.0
Total 58 100.0
25+ 20-24
15-19 0-14
Fr
eq
ue
nc
y
40
30
20
10
0
The next category, testing, refers to tests a middle school teacher was required to pass
before being certified in that state. There were five possible responses – none, PRAXIS, NTE, a
state developed test, or other. Only two states, Connecticut and Nebraska, indicated other in this
category. Connecticut required their middle school teachers to have a minimum of a 22 on the
English section of the ACT and a 19 on the math portion. If teachers took the SAT then they
needed a composite score of 1000 with nothing lower than 400 in either the verbal or math
portion of the test. Nevada required their middle school teachers to pass the CBT which was
actually the state test developed for California teachers.
Table 11
Teacher Testing Requirements Prior to NCLB
Test Frequency Percent Cumulative Percent
No testing 16 27.6 27.6
Praxis 11 19.0 46.6
NTE 15 25.9 72.4
State Test 13 22.4 94.8
Other 3 5.2 100.0
Total 58 100.0
Other
NTE
No testing
Pe
rc
en
t
30
20
10
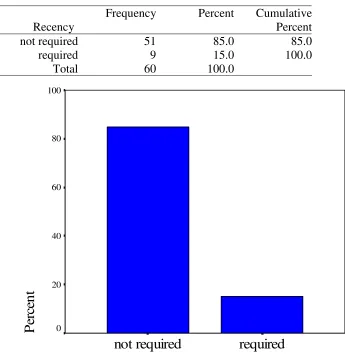
Passing a state evaluation was part of the certification process in some states prior to
NCLB. This evaluation differed from state to state. Some states reported they required
observations of the teacher by a team of observers, others required a portfolio to be evaluated,
and a few states required a video of the teacher teaching in the classroom which was then
evaluated by trained observers. The one thing all of these had in common is that they were
designed by the state’s Department of Education and were applied to all new teachers prior to
receiving any certification. These were all completed during the first year of a teacher’s
classroom teaching. Other states had local evaluations or state evaluations but these were not tied
to certification but merely to attaining tenure or a lifetime certificate.
Table 12
State Evaluations Prior to NCLB
Evaluations Frequency Percent Cumulative Percent
None Required 45 77.6 77.6
Required 13 22.4 100.0
Required
None Required
Pe
rc
en
t
100
80
60
40
20
0
Figure 4. State Evaluations Prior to NCLB
Certification categories vary from state to state. The data in Table 13 came from the
responses to Question 1 of the survey and the NASDTEC Manual. The categories indicated are
only those from states that allow teachers to be certified to teach middle school. Just because a
state does not indicate K-6 certificates does not necessarily mean they do not have such a
certificate but merely that a holder of this certificate is not authorized to teach middle school.
Indiana and Illinois offer a K-9 certification which I listed as a K-8 certificate. All combinations
of certificates which appeared in the data were listed. Thus states were only counted once except
in the cases of those states which allow some middle school teachers to work without a
Table 13
Certification Categories Prior to NCLB
Grade
Categories Frequency Percent Cumulative Percent K-6 and
Secondary 8 13.8 13.8
K-8 and
Secondary 16 27.6 41.4
Middle and
Secondary 7 12.1 53.4
K-8, Mid. &
Sec 6 10.3 63.8
K-6,Middle &
Secondary 14 24.1 87.9
K-6, K-8, Mid.
& Sec. 4 6.9 94.8
secondary 3 5.2 100.0
Total 58 100.0
seco ndary K-6, K
-8, M id. & Sec K-6,M idd le & Sec. K-8, M
id. & Sec M idd le a nd S eco ndary K-8 and Second ary K-6 and Second ary Fr eq ue nc y 20 10 0
The Grade Point Average (GPA) requirement mentioned by the states refers to the
teacher’s final overall GPA upon graduation from college. It was not subject specific nor was it
used for a prospective teacher to get into a teacher education program.
Table 14
Grade Point Average Requirement Prior to NCLB
GPA Frequency Percent Cumulative Percent
None Required 52 89.7 89.7
2.5 Required 6 10.3 100.0
Total 58 100.0
2.5 Required
None Required
Pe
rc
en
t
100
80
60
40
20
0
Some states required specific courses for middle school teachers. In Alaska teachers were
required to complete a course in Alaskan studies and one in multi-cultural education. In
California a course in the U.S. Constitution is required for certification. The other states
requiring special coursework did not specify what those courses were.
Table 15
Specific Course Requirements Prior to NCLB
Special Courses Frequency Percent Cumulative Percent
None Required 52 89.7 89.7
Required 6 10.3 100.0
Total 58 100.0
Required
None Required
Pe
rc
en
t
100
80
60
40
20
0
Prior to NCLB all but two states, New York and Pennsylvania, required teachers to
complete an approved teacher preparation program at a college or university. Approved refers to
an NCATE approved college or university program or one that is approved by the state.
How have all of these requirements changed since the enactment of NCLB? This was the
second part of survey Question 1. All of the certification officers who responded to my survey
referred me to their Department of Education website in order to get the most current
information. The data gleaned from those websites and the latest NASDTEC Manual is displayed
in the second table located in Appendix C.
The data for requirements after NCLB were analyzed in the same manner as the data for
requirements prior to NCLB. The degree required to teach in each state and DC was analyzed
first using a frequency distribution and charted as a bar graph. The “none” category still refers to
some vocational courses, arts, and foreign languages. Very few changes were made in the degree
requirements after NCLB.
Table 16
Degrees Needed to Teach in Middle Schools After NCLB
Degrees Frequency Percent Cumulative Percent None
Required 8 13.3 13.3
BA 51 85.0 98.3
+1 Year 1 1.7 100.0