R E S E A R C H
Open Access
Mapping actionable pathways and
mutations in brain tumours using targeted
RNA next generation sequencing
Krissie Lenting
1†, Corina N. A. M. van den Heuvel
1†, Anne van Ewijk
2, Duaa ElMelik
1, Remco de Boer
2,
Elizabeth Tindall
3, Ge Wei
3, Benno Kusters
4, Maarten te Dorsthorst
5, Mark ter Laan
5, Martijn A. Huynen
2and
William P. Leenders
1*Abstract
Many biology-based precision drugs are available that neutralize aberrant molecular pathways in cancer. Molecular heterogeneity and the lack of reliable companion diagnostic biomarkers for many drugs makes targeted treatment of cancer inaccurate for many individuals. Identifying actionable hyperactive biological pathways in individual cancers may improve this situation.
To achieve this we applied a novel targeted RNA next generation sequencing (t/RNA-NGS) technique to surgically obtained glioma tissues. The test combines mutation detection with analysis of biological pathway activities that are involved in tumour behavior in many cancer types (e.g. tyrosine kinase signaling, angiogenesis signaling, immune response, metabolism), via quantitative measurement of transcript levels and splice variants of hundreds of genes. We here present proof of concept that the technique, which uses molecular inversion probes, generates a histology-independent molecular diagnosis and identifies classifiers that are strongly associated with conventional histopathology diagnoses and even with patient prognosis. The test not only confirmed known glioma-associated molecular aberrations but also identified aberrant expression levels of actionable genes and mutations that have so far been considered not to be associated with glioma, opening up the possibility of drug repurposing for individual patients. Its cost-effectiveness makes t/RNA-NGS to an attractive instrument to aid oncologists in therapy decision making.
Keywords:Glioma, Pathways, Diagnostics, Prognostics, Targeted RNA-sequencing, Single molecule molecular inversion probes, Personalized
Introduction
Many different cancer types share similar driver muta-tions. Examples are loss of function mutations in tumour suppressor genes (e.g.p53andCDKN2A)and DNA repair proteins,leading to genetic instability and loss of cell cycle control) [1–3], and activating mutations, amplifications or fusion events in proto-oncogenes [4,5]. Other shared fea-tures are related to micro-environmental effectors, such as altered metabolism as a result of hypoxia [6,7], induction of angiogenesis [8] and immune suppression [9].
Additionally, aberrations exist that are tumour-type specific. Examples are expression of hormone receptors in cancers of prostate, ovary and breast [10, 11]; muta-tions affecting metabolism (isocitrate dehydrogenase mutations [p.IDH1-R132H] in glioma and acute myeloid leukemia [12]); and mutations affecting the PI3K and MAPK pathway (PIK3CA, p.KRAS-G12/G13 mutations in adenocarcinomas [13], p.BRAF-V600E in melanoma [14]). Such specificity is however never absolute. As an example, IDH- and BRAF mutations are sporadically found in other cancers too [15–17]. Detection of such relatively rare, and therefore a priori unexpected muta-tions in individual patients could lead to repurposing of precision medicines in basket trials, in which precision drugs are administered to patients based on DNA profil-ing [18–21].
© The Author(s). 2019Open AccessThis article is distributed under the terms of the Creative Commons Attribution 4.0 International License (http://creativecommons.org/licenses/by/4.0/), which permits unrestricted use, distribution, and reproduction in any medium, provided you give appropriate credit to the original author(s) and the source, provide a link to the Creative Commons license, and indicate if changes were made. The Creative Commons Public Domain Dedication waiver (http://creativecommons.org/publicdomain/zero/1.0/) applies to the data made available in this article, unless otherwise stated. * Correspondence:[email protected]
†Krissie Lenting and Corina N. A. M. van den Heuvel contributed equally to
this work.
1Department of Biochemistry, Radboud Institute for Molecular Life Sciences,
A number of actionable biological pathways in cancer involve the products of genes that are not mutated, but epigenetically regulated, for example by altered tran-scription factor availability, repressor activity or gene methylation, [22, 23]. Activity of such pathways cannot be directly inferred from DNA analyses. Whole genome methylation analysis has robust diagnostic power [24] but does not allow analysis of activity of biological path-ways, involved in cancer development and progression. An example is angiogenesis, initiated by hypoxia-inducable factor (HIF-1α)- induced expression of an abundance of growth factors and followed by extensive crosstalk between tumour cells, tip- and stalk endothelial cells and pericytes [25,26]. DNA analysis also does not provide information on post-transcriptional events. For example, expression of alternative splice variants of vascu-lar endothelial growth factor (VEGF-A) has implications for the regulation of angiogenesis [27] and splice variants of receptor tyrosine kinases can lead to auto-active and oncogenic PI3K signaling (e.g. EGFRVIII and METΔ7–8in glioma and METΔ14in lung cancer [28–31]).
A comprehensive overview of gene expression levels and alternative splice variants can be obtained with whole RNA next generation sequencing (w/RNA-NGS), provided sufficient coverage to detect alternative exon-exon boundaries. w/RNA-NGS is increasingly performed in a research setting but is cost-wise still not suitable for implementation in routine patient care. There is there-fore a huge need for novel and cost-effective methods to obtain clinically actionable and reliable information for individual patients, to be able to implement personalized treatment approaches.
Due to its low incidence (6 per 100,000) and high mo-lecular heterogeneity [32], glioma is a difficult tumour type to organize clinical trials with, although the mo-lecular underpinnings of gliomagenesis and glioma pro-gression are relatively well established [12]. In the absence of alternatives, treatment of its most malignant form, glioblastoma, is still confined to palliative surgery, followed by chemotherapy with temozolomide (TMZ) and radiotherapy [33] which extents median life expect-ancy with only few months. Surgical cure for this tumour type is not possible due to its diffuse infiltrative nature [34]. Glioma is therefore one of the most challen-ging tumours for which new treatment strategies are ur-gently needed.
We here analyzed test and validation cohorts of in total 103 surgically derived brain tumours with quantita-tive targeted RNA next generation sequencing (t/RNA-NGS) [35–38]. The technique uses single molecule molecular inversion probes (smMIPs) and sensitively and quantitatively measures expression levels of and mu-tations in actionable genes. We show that t/RNA-NGS provides a histology-independent molecular diagnosis
and identifies classifier transcripts that are closely associ-ated with histopathological diagnosis and prognosis. By measuring hyperactivity of cancer-related pathways the test may also stratify individual patients for treatment with appropriate medicine.
Materials and methods
Patients
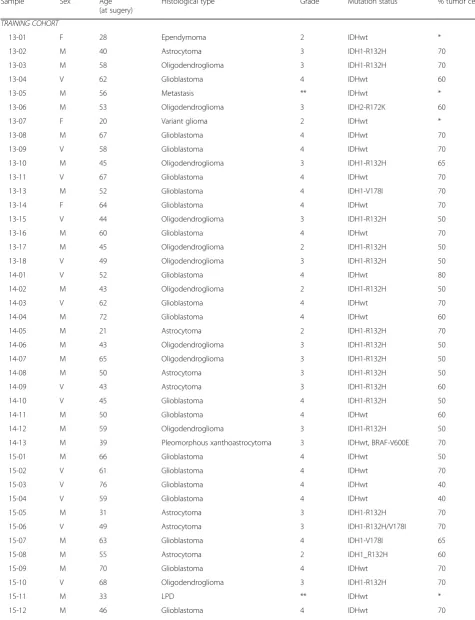
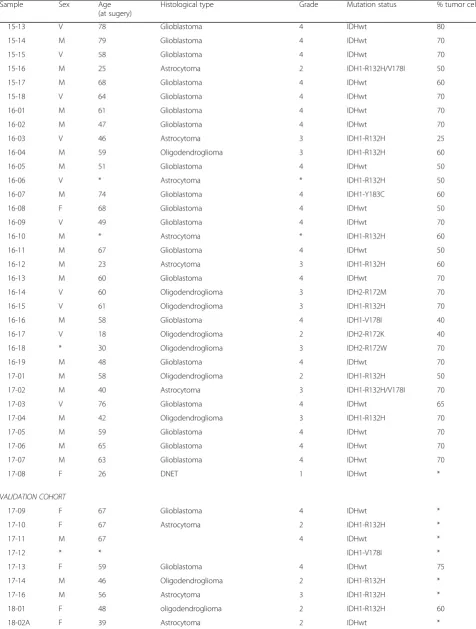
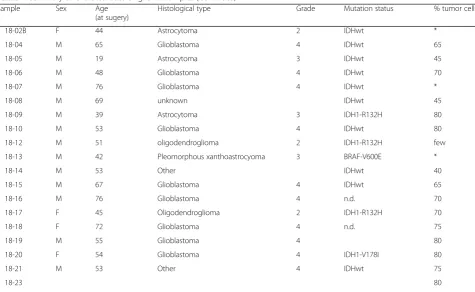
The study described here was performed with brain tumour tissue from newly diagnosed patients who were operated for a glioma between 2013 and 2018 (n= 103). The cohort was separated in a training cohort (n= 75, tumours that were operated between 2013 and 2017) and an independent validation set of 28 tumours (oper-ated in 2017 and 2018). Researchers were blinded to histopathology and clinical outcome. The study protocol was approved by the Ethical Committee for Human Ex-perimentation of the Radboudumc. All patients signed informed consent. Directly after surgery, tissue samples were snap frozen in liquid nitrogen and stored at -80 °C until further processing. In retrospect, patient character-istics were extracted from Radboudumc electronic pa-tient files (EPIC) and documented in the electronic data capture system CASTOR. Histopathology and molecular diagnoses were extracted from the Dutch Pathology archive PALGA and summarized in Table1.
RNA preparation and cDNA synthesis
Cryosections of 10μm were cut for RNA isolation using TRIzol (ThermoFisher Scientific, Waltham, MA). For every sample a 4μm serial section was stained with H&E to estimate percentage tumour area by an experienced neuropathologist (BK). RNA was reverse transcribed into cDNA using random hexamer primers and Superscript II (Invitrogen, CA) according to standard protocols. In parallel, tissue was processed to formalin-fixed paraffin-embedded (FFPE) tissue blocks for routine diagnosis. Samples from 2014 onwards were also subjected to genetic analysis using targeted DNA next generation se-quencing [18].
T/RNA-NGS with smMIPs
Table 1Summary of characteristics of glioma samples
Sample Sex Age
(at sugery)
Histological type Grade Mutation status % tumor cells
TRAINING COHORT
13-01 F 28 Ependymoma 2 IDHwt *
13-02 M 40 Astrocytoma 3 IDH1-R132H 70
13-03 M 58 Oligodendroglioma 3 IDH1-R132H 70
13-04 V 62 Glioblastoma 4 IDHwt 60
13-05 M 56 Metastasis ** IDHwt *
13-06 M 53 Oligodendroglioma 3 IDH2-R172K 60
13-07 F 20 Variant glioma 2 IDHwt *
13-08 M 67 Glioblastoma 4 IDHwt 70
13-09 V 58 Glioblastoma 4 IDHwt 70
13-10 M 45 Oligodendroglioma 3 IDH1-R132H 65
13-11 V 67 Glioblastoma 4 IDHwt 70
13-13 M 52 Glioblastoma 4 IDH1-V178I 70
13-14 F 64 Glioblastoma 4 IDHwt 70
13-15 V 44 Oligodendroglioma 3 IDH1-R132H 50
13-16 M 60 Glioblastoma 4 IDHwt 70
13-17 M 45 Oligodendroglioma 2 IDH1-R132H 50
13-18 V 49 Oligodendroglioma 3 IDH1-R132H 50
14-01 V 52 Glioblastoma 4 IDHwt 80
14-02 M 43 Oligodendroglioma 2 IDH1-R132H 50
14-03 V 62 Glioblastoma 4 IDHwt 70
14-04 M 72 Glioblastoma 4 IDHwt 60
14-05 M 21 Astrocytoma 2 IDH1-R132H 70
14-06 M 43 Oligodendroglioma 3 IDH1-R132H 50
14-07 M 65 Oligodendroglioma 3 IDH1-R132H 50
14-08 M 50 Astrocytoma 3 IDH1-R132H 50
14-09 V 43 Astrocytoma 3 IDH1-R132H 60
14-10 V 45 Glioblastoma 4 IDH1-R132H 50
14-11 M 50 Glioblastoma 4 IDHwt 60
14-12 M 59 Oligodendroglioma 3 IDH1-R132H 50
14-13 M 39 Pleomorphous xanthoastrocytoma 3 IDHwt, BRAF-V600E 70
15-01 M 66 Glioblastoma 4 IDHwt 50
15-02 V 61 Glioblastoma 4 IDHwt 70
15-03 V 76 Glioblastoma 4 IDHwt 40
15-04 V 59 Glioblastoma 4 IDHwt 40
15-05 M 31 Astrocytoma 3 IDH1-R132H 70
15-06 V 49 Astrocytoma 3 IDH1-R132H/V178I 70
15-07 M 63 Glioblastoma 4 IDH1-V178I 65
15-08 M 55 Astrocytoma 2 IDH1_R132H 60
15-09 M 70 Glioblastoma 4 IDHwt 70
15-10 V 68 Oligodendroglioma 3 IDH1-R132H 70
15-11 M 33 LPD ** IDHwt *
Table 1Summary of characteristics of glioma samples(Continued)
Sample Sex Age
(at sugery)
Histological type Grade Mutation status % tumor cells
15-13 V 78 Glioblastoma 4 IDHwt 80
15-14 M 79 Glioblastoma 4 IDHwt 70
15-15 V 58 Glioblastoma 4 IDHwt 70
15-16 M 25 Astrocytoma 2 IDH1-R132H/V178I 50
15-17 M 68 Glioblastoma 4 IDHwt 60
15-18 V 64 Glioblastoma 4 IDHwt 70
16-01 M 61 Glioblastoma 4 IDHwt 70
16-02 M 47 Glioblastoma 4 IDHwt 70
16-03 V 46 Astrocytoma 3 IDH1-R132H 25
16-04 M 59 Oligodendroglioma 3 IDH1-R132H 60
16-05 M 51 Glioblastoma 4 IDHwt 50
16-06 V * Astrocytoma * IDH1-R132H 50
16-07 M 74 Glioblastoma 4 IDH1-Y183C 60
16-08 F 68 Glioblastoma 4 IDHwt 50
16-09 V 49 Glioblastoma 4 IDHwt 70
16-10 M * Astrocytoma * IDH1-R132H 60
16-11 M 67 Glioblastoma 4 IDHwt 50
16-12 M 23 Astrocytoma 3 IDH1-R132H 60
16-13 M 60 Glioblastoma 4 IDHwt 70
16-14 V 60 Oligodendroglioma 3 IDH2-R172M 70
16-15 V 61 Oligodendroglioma 3 IDH1-R132H 70
16-16 M 58 Glioblastoma 4 IDH1-V178I 40
16-17 V 18 Oligodendroglioma 2 IDH2-R172K 40
16-18 * 30 Oligodendroglioma 3 IDH2-R172W 70
16-19 M 48 Glioblastoma 4 IDHwt 70
17-01 M 58 Oligodendroglioma 2 IDH1-R132H 50
17-02 M 40 Astrocytoma 3 IDH1-R132H/V178I 70
17-03 V 76 Glioblastoma 4 IDHwt 65
17-04 M 42 Oligodendroglioma 3 IDH1-R132H 70
17-05 M 59 Glioblastoma 4 IDHwt 70
17-06 M 65 Glioblastoma 4 IDHwt 70
17-07 M 63 Glioblastoma 4 IDHwt 70
17-08 F 26 DNET 1 IDHwt *
VALIDATION COHORT
17-09 F 67 Glioblastoma 4 IDHwt *
17-10 F 67 Astrocytoma 2 IDH1-R132H *
17-11 M 67 4 IDHwt *
17-12 * * IDH1-V178I *
17-13 F 59 Glioblastoma 4 IDHwt 75
17-14 M 46 Oligodendroglioma 2 IDH1-R132H *
17-16 M 56 Astrocytoma 3 IDH1-R132H *
18-01 F 48 oligodendroglioma 2 IDH1-R132H 60
variants by placing extension and ligation probes on neighboring exons, e.g. probes on exons 1/8 of Epider-mal Growth Factor Receptor (EGFR) for detection of EGFRvIII[37]. Probes for detection of Vascular Endothe-lial Growth Factor (VEGF) isoforms 121, 165 and 189 were designed with extension and ligation probes in exons 5/8, 5/7 and 5/6, respectively. Additional smMIPs were included that were directed against shared exons of transcript variants. For transcripts in which relevant mu-tations can be expected, smMIPs were selected with ex-tension and ligation probes flanking the respective ROI. At least 5 smMIPs were used for each transcript of interest, evenly distributed along the transcript. cDNA was subjected to smMIP capture as described in [35,36]. In short, a mixture of 936 phophorylated smMIPs was hybridized to 15–50 ng of cDNA. After overnight hybridization and enzymatic gap-filling (KlenTaq poly-merase, Epicentre, Madison, WI) and ligation (Ampli-gase, Epicentre) circular smMIPs are formed, the number of which is linearly related to the number of RNA molecules present in the original sample. After treatment with exonuclease to remove cDNA and linear smMIPs, the libraries of circular smMIPs were subjected to PCR with a unique barcoded primer set per sample. The PCR products of the expected length of 266 bp were
purified with Ampure beads (Beckmann Coulter Gen-omics, High Wycombe, UK) and quantified on a TapeS-tation 2200 (Agilent Technologies, Santa Clara, CA). PCR libraries were sequenced on the Illumina Nextseq platform (Illumina, San Diego, CA) at the Radboudumc sequencing facility (output 2 × 151 bases). The barcode in the PCR primers allows for pooling of multiple sam-ples into one sequencing library, followed by demulti-plexing of reads, generating for all individual samples a FASTQ file.
Data processing
For each patient sample, all reads in the FASTQ file were mapped against reference transcripts (UCSC hu-man genome assembly hg19) using the SeqNext module of JSI SequencePilot version 4.2.2 build 502 (JSI Medical Systems, Ettenheim, Germany). In all smMIP molecules a unique random 8 N sequence is included (unique mo-lecular identifier or UMI), allowing to assign all identical sequencing reads to one originating circularized (unique) smMIP. This excludes PCR amplification bias and makes the assay quantitative. Number of unique reads for each individual smMIP in a sample were normalized to the total of unique reads in that sample and expressed as fragment per million (FPM). Mean FPM values from all
Table 1Summary of characteristics of glioma samples(Continued)
Sample Sex Age
(at sugery)
Histological type Grade Mutation status % tumor cells
18-02B F 44 Astrocytoma 2 IDHwt *
18-04 M 65 Glioblastoma 4 IDHwt 65
18-05 M 19 Astrocytoma 3 IDHwt 45
18-06 M 48 Glioblastoma 4 IDHwt 70
18-07 M 76 Glioblastoma 4 IDHwt *
18-08 M 69 unknown IDHwt 45
18-09 M 39 Astrocytoma 3 IDH1-R132H 80
18-10 M 53 Glioblastoma 4 IDHwt 80
18-12 M 51 oligodendroglioma 2 IDH1-R132H few
18-13 M 42 Pleomorphous xanthoastrocyoma 3 BRAF-V600E *
18-14 M 53 Other IDHwt 40
18-15 M 67 Glioblastoma 4 IDHwt 65
18-16 M 76 Glioblastoma 4 n.d. 70
18-17 F 45 Oligodendroglioma 2 IDH1-R132H 70
18-18 F 72 Glioblastoma 4 n.d. 75
18-19 M 55 Glioblastoma 4 80
18-20 F 54 Glioblastoma 4 IDH1-V178I 80
18-21 M 53 Other 4 IDHwt 75
18-23 80
Histological type, WHO grade, and percentage tumor cells were confirmed by a trained neuropathologist (B.K.). IDH-mutational status was derived from the t/RNA-seq data. All IDH1-R132H/IDH2 mutations were validated by routine diagnostic genetic analysis with the‘Radboud Cancer Hotspot Gene panel’.
smMIPs covering different ROIs in the same transcript were considered to represent gene expression levels in the tumour sample. Using the base calling algorithm of SeqNext a list of single nucleotide variations and inser-tions and deleinser-tions was generated for each sample. An in–house developed Python script (version 3.7) allowed direct coupling of gene expression values and mutation status of individual cancer samples.
Data analysis and statistics
Unsupervised hierarchical cluster analysis with the gene expression data was performed using R programming (version 3.4.3). Mean FPM values were log-transformed (after addition of 0.01 to prevent log0 transformation),. Manhattan distance between gene expression profiles were calculated using the group average method for ag-glomerative clustering (Unweighted Pair Group Method with Arithmetic Mean) [41]. Other packages were heat-map. Plus (http://www.sciviews.org/SciViews-R.) and plyr: http://www.jstatsoft.org/v40/i01/. The Wilcoxon Mann-Whitney U test was used to find differentially expressed genes between clusters. Associations of muta-tions with clusters were calculated using Fisher’s exact test. Multiple testing corrections were done using Benja-mini Hochberg (FDR < 0.05). Kaplan-Meier survival curves of 75 brain cancer patients in the test cohort were generated using Graphpad Prism, version 5.03. Patients who were still alive at the date of analysis or were lost to follow-up, were censored in the survival data. P-values were calculated using the Log-Rank test. Allp-values are indicated as *(p< 0.05), ** (p< 0.01), *** (p< 0.001), **** (p< 0.0001), unless specified otherwise. Survival analysis of the 28 patients in the validation cohort could not be performed due to short follow-up time.
Immunohistochemistry
Immunohistochemistry (IHC) was performed on 4μm sections of FFPE tissue or on frozen sections, adjacent to those used for t/RNA-NGS. Frozen sections were air dried and fixed with 4% paraformaldehyde (PFA) solu-tion for 20 min at room temperature before staining. After appropriate epitope retrieval (for FFPE sections), antibodies rabbit-anti-Prostate-Specific Membrane Antigen (PSMA) (Abcam; ab133579), rabbit-anti-Carbonic Anhy-drase 12 (CA12) (Sigma Life Sciences; HPA008773), mouse-anti-androgen receptor (AR) (Santa Cruz; sc-7305), rabbit-anti-MET (Cell Signaling Technologies; #8198), and rabbit-anti-EGFR (Cell Signaling Technologies; #4267) were used. Sections were incubated with primary antibody in normal antibody diluent (Immunologic, Duiven, The Netherlands) overnight at 4 °C. Primary antibody detection was done using BrightVision polyHRP-anti-rabbit IgG (Im-munologic, Duiven, The Netherlands), or BrightVision polyHRP-anti-mouse/rabbit/rat IgG (Immunologic) for AR
staining. Sections were counterstained with haematoxylin and mounted with Quick-D mounting medium (Klinipath, Duiven, The Netherlands). As control staining, secondary antibody-only stainings were performed.
Whole transcriptome RNA-NGS (w/RNA-NGS)
Total RNA was isolated using the Qiagen AllPrep DNA/ RNA Mini Kit following the manufacturer’s protocol for animal tissues (Qiagen, Hilden, Germany). RNA sequen-cing libraries were prepared from 16 gliomas using the KAPA RNA HyperPrep Kit with RiboErase (HMR) (KAPA Biosystems, Wilmington, MA) following the manufacturer’s protocol. Briefly, 100 ng of total RNA was used to generate libraries, which were fragmented for 8 min at 94 °C. Adapter stock concentration used was 750 nM and libraries were amplified for 11 cycles. Duplex “Y” adapter sequences with molecular barcodes were generated by IDT (Integrated DNA Technologies, Skokie, Illinois). Final libraries were quantified on a High Sensitivity Bioanalyzer chip (Agilent, Santa Clara, CA) and sequenced at 1.4pM with 10% PhiX on the Illumina NextSeq 550 Sequencer (Illumina, San Diego, CA). Raw FASTQ files were mapped to the human genome (hg19) with STAR (v2.5.3) aligner [42]. Mapped reads were fil-tered and deduplicated using sambamba v0.6.6 and feature quantification was performed using featureCounts v1.5.0-p1 against the RefSeq database (downloaded from the UCSC genome browser on 01/05/2017). Gene and exon-level fragments per kilobase per million mapped reads (FPKMs) were calculated using a custom python script.
Results
T/RNA-NGS profiles have prognostic value
To investigate the prognostic value of t/RNA-NGS, we profiled a training set of 75 brain tumours, including 69 grade II-IV diffuse gliomas and 6 brain lesions that upon routine histopathology were diagnosed as an ependymoma (n= 1), one dysembryoplastic neuroepithelial tumour (DNET), one pleomorphic xanthoastrocytoma, a variant glioma, a brain metastasis of lung adenocarcinoma and a lymphoproliferative disorder (LPD) (Table 1). Annotated unique smMIP counts for each tumour sample ranged from 275,000 to 1,111,000 (not shown). Hierarchical un-supervised agglomerative clustering of the gene expression data of the grade II-IV gliomas (excluding the 6 rare can-cers) resulted in 3 main clusters A, B and C, comprising of 26, 38 and 5 tumours, respectively (Fig.1).
involved in metabolism, as described before [39]. Mem-brane receptor tyrosine kinases (RTKs) NTRK2, ERBB3, ERBB4 were higher expressed in cluster B with average fold changes (FC) of 3.5, 4.8 and 5.2 respectively, while cluster A was characterized by significantly higher expres-sion levels of EGFRvIII(FC = 250) and VEGF-A isoforms VEGF-A121, VEGF-A165and VEGF-A189(all with FC > 11, Additional file2: Table S1a). Between cluster B and C 69 genes were differentially expressed (Additional file 2: Table S1b). Cluster A and C significantly differed with re-spect to expression levels of 9 genes (Additional file 2: Table S1c). The functional significance of these differences were not subject of further investigation in this study.
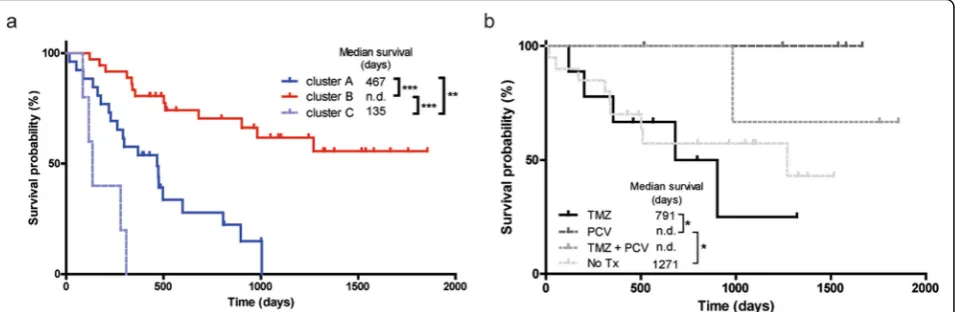
We then coupled the profiles to survival data. As shown in Fig. 2a, cluster B gene expression profiles of gliomas were associated with good prognosis (median survival, defined as time between surgery and death, > 6 years; exact value could not be calculated for available follow-up time) whereas gene expression profiles in cluster A and C were associated with median survival of 467 and 135 days, respectively. Results were highly significant between clusters A and B (p< 0.0001), A and C (p= 0.0078), and C and B (p < 0.0001). A Kaplan-Meier curve with survival data including also the non-glioma patients is presented in Additional file 1: Figure SI.
Mutation analysis
We next investigated whether we could identify nucleo-tide variations that significantly associate with the sub-groups. To this end we included all identified sequence variants of potential clinical significance with a coverage of > 10% of the unique reads. This analysis revealed that the well known hotspot mutation in the metabolic en-zyme isocitrate dehydrogenase 1 (p.IDH1-R132H) [12] was significantly associated with cluster B (p< 3 × 10⁻⁵ when compared to cluster A, see Additional file3: Table S2). Additionally a duplication in succinate dehydrogen-ase A (SDHA) of unknown significance was strongly as-sociated with group B (p= 3 × 10⁻⁵). The test also identified known oncogenic mutations in mitochondrial IDH2 in four patients (two p.R172K, one p.R172C and one p.R172M mutation, Table 1). Gene expression pro-files from these gliomas co-clustered with those of the p.IDH1-R132H gliomas in cluster B (Fig. 1, black in IDH-status annotation bar). All IDH1R132 and IDH2R172 mutations were in retrospect confirmed by routine gen-etic analyses (not shown). As described before, also other variants of IDH1 (p.V178I, p.Y183C) were identified by the assay [39] (Table1).
We then analyzed the profiles in relation to survival with treatment and histopathology as additional parame-ters. Retrospective analysis of histopathology and clinical follow-up data revealed that all patients in clusters A and C received temozolomide (TMZ) and/or radiother-apy upon signs of tumour progression after surgery, sug-gesting that the differences in survival were not related to treatment. We therefore concentrated on patients in cluster B who were treated with TMZ (n= 9, astrocyto-mas), procarbazine/lomustine/vincristine (PCV) chemo-therapy (n= 6, all 1p/19q codeleted oligodendrogliomas),
both adjuvant therapies (n= 3), or did not receive add-itional treatment (n= 19). Of 2 patients adjuvant therapy status was unknown (n= 2). As shown in Fig. 2b, out-come for oligodendroglioma patients treated with PCV was better than for astrocytoma patients treated with TMZ (p= 0.04).
Whereas group B was dominated by IDH-mutated gli-omas, this group also contained 6 IDH wild-type glio-blastomas. Comparison of gene expression profiles of these gliomas with those of cluster A revealed that ex-pression levels of all VEGF isoforms were significantly lower in the group B IDHwt gliomas (Additional file 4: Table S3). This suggests that these 6 tumours grouped with the IDHmutgliomas based on the lack of an angio-genic response.
T/RNA-NGS based molecular diagnosis
To investigate whether t/RNA-NGS profiles are associ-ated with histopathology diagnoses, we performed a group-based analysis according to the WHO 2016 grad-ing system [43] and compared grade II/III astrocytomas (n= 12), grade II/III oligodendrogliomas (n= 19) and glioblastomas (n= 38). Wilcoxon Mann-Whitney U tests identified 79 genes that were differentially expressed be-tween diffuse grade II/III oligodendrogliomas and glio-blastomas (Additional file5: Table S4a). In the top 5 of differentially expressed genes were LDHA and BCAT1, genes that are known to be hypermethylated in low grade, IDHmut gliomas [36, 44]. Expression levels of 50 genes were significantly different between grade II/III as-trocytomas and glioblastomas (Additional file 5: Table S4b), whereas expression levels of only 1 gene (ALK) dif-fered significantly between astrocytomas and oligo-dendrogliomas (Additional file 5: Table S4c). As
expected, both oligodendrogliomas and astrocytomas were distinguished from glioblastomas by the p.IDH1-R132H mutation. EGFRvIIIwas expressed in 30% of glio-blastomas (n= 13; mean FPM = 550, range 6–1450) (Fig.3a) and never in grade II/III gliomas, in good agree-ment with literature [45]. Expression of wild-type EGFR was found among all gliomas, but was more prominent in glioblastomas than in grade II/III gliomas (mean FPM = 612 vs. 126; p= 0.0061). Levels of EGFR and MET expression in glioblastomas were inversely corre-lated (Spearman R = -0.59, p< 0.0001; Fig.3b). Not sur-prising given the strong association of IDH1 mutations and grade II/III gliomas with cluster B of Fig.1, the super-vised histopathology-based analysis again identified ErbB3, ErbB4 and TrkB (the product of NTRK2) as potentially targetable proteins in grade II/III gliomas (Fig.3c).
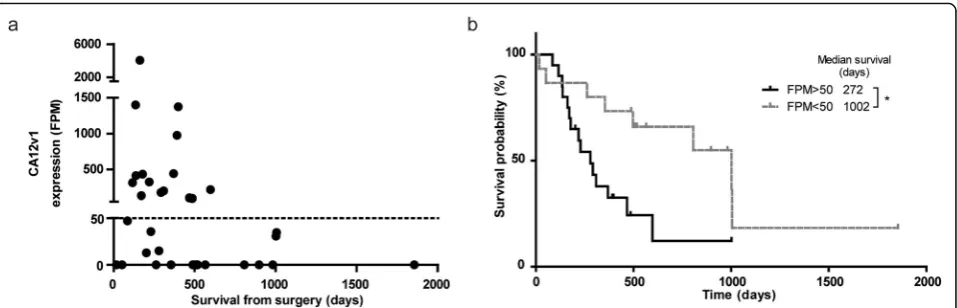
Carbonic anhydrase 12 is a poor prognostic factor To investigate whether prognostic factors other than IDH1-mutations can be identified by t/RNA-NGS, we performed subgroup analysis on tumour profiles from IDHwt patients with survival < 14 months and > 14
months (the median overall survival time of this group
of patients). A Fisher’s exact test on the sequence varia-tions in these groups identified two different splice iso-forms of CA12: a full-length variant 1 (CA12v1), and a variant 2 (CA12v2) that lacks exon 9. Expression levels of CA12v1 were associated with poor survival (Fig. 4a). Detection of this variant was based on one smMIP with both exon 8–9 and exon 8–10 boundaries in its ROI. This smMIP can detect both isoforms due to the small size of exon 9 of 33 nucleotides. Interestingly, CA12v1 was never detected in IDHmut gliomas. CA12v1 expres-sion values higher than 50 FPM translated in poor prog-nosis as shown by Kaplan-Meier analysis (272 vs.1002 days from surgery to death,p= 0.0137) (Fig.4b).
Validation of t/RNA-NGS data
We have previously shown that the quality of t/RNA-NGS data correlates well with w/RNA-t/RNA-NGS [35]. All IDH1 and IDH2 mutations that were found with regular molecular screening, were verified by t/RNA-NGS [36]. Interestingly, the broad set-up of our t/RNA-NGS assay allowed the frequent detection of androgen receptor (AR) in gliomas at relatively high levels. To confirm and validate these and other findings on the proteome level
we performed immunohistochemical analyses for EGFR, MET, CA12 and AR on a number of tumours with low or high FPM values for the corresponding genes. Tran-script levels for EGFR, MET, CA12, and AR correlated with protein levels (Fig. 5). In one case we found that EGFR-transcript levels from frozen tumour tissue did not match with protein levels in FFPE blocks. This dis-crepancy could be attributed to tumour heterogeneity since the FFPE block contained both EGFR-positive and negative areas (Fig.5a).
We also detected prominent expression ofFOLH1, the gene encoding prostate specific membrane antigen (PSMA), in approximately 70% of the gliomas. To valid-ate this finding we performed IHC analysis for PSMA on a number of tumours with either low or high FOLH1 FPM values. IHC revealed expression of PSMA on the blood vessels of tumours with high FOLH1FPM values (Fig.5f).
Actionable markers in individual brain cancers
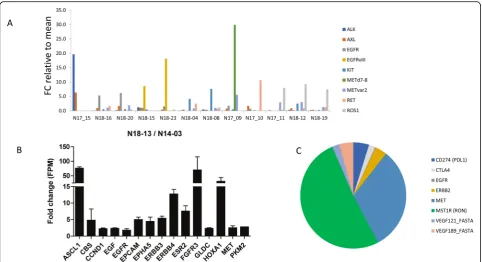
We then investigated whether t/RNA-NGS can stratify patient tumours based on relatively high expression of actionable targets (arbitrarily defined as > 2 fold expres-sion compared to the mean of all gliomas). Results of a selection of tyrosine kinases (EGFR, MET, ALK, AXL, KIT, RET, ROS1) for 12 gliomas are presented in Fig.6a. In only one tumour high expression levels of CD2, CD3, CD4, CD8 CTLA-4 and PD-1 were found, suggesting an inflammatory phenotype (not shown). Many mutations were detected in the assay that are described as somatic mutations in the Cosmic database. Potentially interesting mutations that we found (based on FATHMM score) in-cluded p.RET-S1002R, p.EGFR-G719D, p.EGFR-A289D, PTEN mutations ad TP53 mutations (not shown).
In the pleomorphic xanthoastrocyoma (PXA) in our test cohort a BRAFV600E mutation was found which was confirmed via genetic testing (Table 1). This mutation
has been described before in PXA [46]. These are mostly slow growing, low-grade gliomas but some patients will undergo malignant progression. Mutations in BRAF have been identified as poor prognostic factors for this tumour type [47, 48]. Interestingly, patient 14–03 was operated for a recurrent tumour 4 years later (sample 18–13 in the validation cohort). Samples 14–03 and 18– 13 were therefore re-analyzed with t/RNA-NGS in the same sequencing run. The recurrent tumour showed a 70–80 fold increase of expression of transcription factors ASCL1 and HOXA1 and tyrosine kinases FGFR3, HER3, HER4 and MET (Fig. 6b). Another interesting finding was high expression of estrogen receptor 2 (ESR2) in the recurrent, but not the primary tumour. Whereas the p.BRAF-V600E mutation was retained, the recurrent tumour showed an additional p.NF1-E1571* nonsense mutation (not shown). This mutation has been described as pathogenic in the Cosmic database (https://cancer.
sanger.ac.uk/cosmic/mutation/overview?id=133079)
(FATHMM score = 0.99).
Other observations that were of potential clinical rele-vance were that the brain metastasis of lung carcinoma expressed relatively high levels of MET, RON and CTLA-4 (Fig. 7C). This may suggest sensitivity to the MET/RON inhibitor BMS777607/ASLAN002, combined with im-mune checkpoint inhibition [49]. The ependymoma showed high levels of EGFRvIII(not shown). One glioblast-oma expressed the METΔ7–8 variant that we described previously [31]. In the DNET, considered as a benign grade I tumour, we found high expression levels of ErbB3, FGFR2, FOLH1 and AXL.
Validation cohort
To validate these results, we next performed t/RNA-NGS on an independent validation cohort of 26 analyzable gli-oma samples. p.IDH1-R132H mutations were found in 7 samples, all diagnosed as grade II/III astrocytomas and
oligodendrogliomas (Table 1). Differentially expressed genes between IDHmutand IDHwtgliomas in the training set were confirmed in the validation cohort (Additional file6: Table S5). EGFRvIIIexpression was found in 4 of 19 (21%) of IDHwt glioblastomas and not in p.IDH1-R132H cancers, confirming results in the test cohort. Thus, the test is robust and yields batch-independent clinically rele-vant information. Survival data in the validation set could not be interpreted due to short time of follow-up.
Discussion
We here describe the clinical application of a relatively novel and cost-effective multiplex next generation RNA sequencing assay for cancer pathway profiling. The assay generates expression profiles and sequence information of genes that have been identified by literature surveys as potentially important for diagnosis, prognosis and re-sponse to precision medicines in a variety of cancer types. We previously demonstrated that the test allows
analysis of metabolism by measuring relative expression levels of metabolic enzymes [36, 38]. To analyze clinic-ally actionable pathways we expanded the assay with smMIPs to quantify expression levels of and detect mu-tations in the involved genes. Analysis of the cohort of 103 brain cancers, of which 97 well characterized gli-omas, allowed robust group-based analysis, and con-firmed high inter tumour molecular heterogeneity with respect to tyrosine kinase expression. Indeed, the biology in individual gliomas that drives progression is mostly a black box. Therefore, in the routine clinical setting mo-lecular genetics is increasingly implemented as add-on to histopathology to aid the diagnostic process, but in-fluence on therapeutic decision making is limited. Bio-markers that influence clinical management includeIDH mutations, combined with loss of chromosome arms 1p and 19q, leading to a diagnosis of oligodendroglioma that responds well to PCV, whereas methylation of the MGMT promoter in glioblastoma predicts a better re-sponse to TMZ [50–52].EGFRstatus is also determined, amplification of which, in combination with the EGFRvIII mutation, is associated with glioblastoma [53]. We here show that a single t/RNA-NGS test gives the same gen-etic information that can be derived from DNA analysis, but additionally provides information on gene activity from mutated but also non-mutated alleles. Thus, RNA-profiling is better suited than DNA-RNA-profiling to draw
conclusions on activity of biological pathways, and thus may be more reliable as a guide to personalized treat-ment plans [54, 55]. It must be noted that for this study we isolated RNA from tumour tissue, snap-frozen dir-ectly after surgery. Although t/RNA-NGS can also be performed on RNA isolated from FFPE tissue, we found that whereas the quality of t/RNA-NGS data is good if tissue is formalin-fixed directly after surgery, it decreases in case of large time lags between surgery and formalin fixation (data not shown).
Tumours with overexpression of a targetable tyrosine kinase will be resistant to the corresponding inhibitor if other kinases are present that converge on the same sig-naling pathways [56]. Insight in the entire repertoire of expressed tyrosine kinases, downstream signaling inter-mediates and counteracting phosphatases may therefore predict intrinsic resistance or rapid development thereof [57–59]. t/RNA-NGS provides such insight for individ-ual glioma patients, and even can identify gene activities that have so far been associated with other cancer types, opening new avenues for targeted therapy. For example, expression of the prostate cancer marker PSMA on mi-crovasculature of glioblastoma as we show here, may provide opportunities for tumour-vascular targeting [60–62]. Of interest, it was reported before that high ex-pression levels of AR in glioblastoma translates into sen-sitivity to the AR antagonist enzalutamide [63]. Notably,
our data also confirmed the identification of CA12v1 as a marker of poor prognosis in glioblastoma patients [64]. CA12 is a transmembrane enzyme that is involved in intracellular pH homeostasis and extracellular acidifica-tion, providing a biological explanation for the association with poor survival [65]. Overexpression of CA12v1, but not CA12v2, in cell models leads to acidification of the extracellular milieu, whereas overexpression of C12v2 leads to increased oxygen consumption (manuscript in preparation). Because CA12 is expressed at low levels in normal brain, it is a interesting therapeutic target for the group of CA12-positive glioblastomas [66].
In conclusion we here present a novel t/RNA-NGS ‘one size fits all’assay that can provide a molecular diag-nosis and progdiag-nosis for glioma and other cancers, as well as generate a list of (actionable) gene expression levels and mutations for individual cancers. The work de-scribed in this manuscript was performed with RNA, isolated from optimally biobanked tissue. The small size of the RNA regions of interest (150 bases) that is re-quired for successful smMIP capture, however also al-lows testing of RNA isolated from formalin fixed, paraffin embedded tissue blocks, provided that autolysis is prevented by proper and rapid processing. The low costs and high throughput capacity of the assay (up to 400 samples can be processed simultaneously due to barcoding) makes it highly interesting to further analyze biobanked tissues in future studies and identify classifier profiles that can predict prognosis and response to ther-apies. Thus, t/RNA-NGS may allow repurposing of drugs in an individualized manner.
Supplementary information
Supplementary informationaccompanies this paper athttps://doi.org/10.
1186/s40478-019-0826-z.
Additional file 1: Figure S1.Kaplan-Meier analysis of unsupervised clusters of the entire cohort. Indicated in the figure are (a) ependymoma, (b) lung metastasis, (c) DNET, (d) LPD, and (e) variant glioma.
Additional file 2: Table S1a.Differential gene expression in clusterA
vs. B.A total of 83 genes were differentially expressed between the two
clusters. Only genes that were significantly different are shown. Mean gene expression values (FPM) values for the clusters are given. For significance: A Wilcoxon-Mann-Whitney test with multiple testing correc-tion was performed. Values are significant when thep-value is lower than the False Discovery Rate (FDR). The cutoff for the FDR was < 0.05.Table S1b: Differential gene expression in cluster B vs. C. A total of 69 genes were differentially expressed between the two clusters. Only genes that were significantly different are shown. Mean gene expression values (FPM) values for the clusters are given. For significance: A Wilcoxon-Mann-Whitney test with multiple testing correction was performed. Values are significant when the p-value is lower than the False Discovery Rate (FDR). The cutoff for the FDR was < 0.05.Table S1c: Differential gene expression in cluster A vs. C. A total of 9 genes were differentially expressed between the two clusters. Only genes that were significantly different are shown. Mean gene expression values (FPM) values for the clusters are given. For significance: A Wilcoxon-Mann-Whitney test with multiple testing correction was performed. Values are significant when
thep-value is lower than the False Discovery Rate (FDR). The cutoff for the FDR was < 0.05.
Additional file 3: Table S2.Mutation detection in glioma samples. A Fisher’s exact test was performed to identify genetic mutations that distinguish the clusters A, B, and C as defined in Fig.1. Mutations that were present in at least 10% of the unique reads were tested for significance. There were no significant differences between cluster A vs. C. The cutoff for the FDR was set at 0.01. Genes shown here were significantly different between clusters.
Additional file 4: Table S3.Differential gene expression in IDHIDHwt gliomas from cluster B vs cluster A.A total of 4 genes were differentially expressed between the cluster A and the IDHIDHwtgliomas that grouped in cluster B. Only genes that were significantly different are shown. Mean gene expression values (FPM) values for the clusters are given. For significance: A Wilcoxon-Mann-Whitney test with multiple testing correc-tion was performed. Values are significant when thep-value is lower than the False Discovery Rate (FDR). The cutoff for the FDR was < 0.05.
Additional file 5: Table S4a.Differential gene expression in oligodendroglioma (O) vs. glioblastoma (G). A total of 79 genes were differentially expressed between the two histological types. Only genes that were significantly different are shown. Mean gene expression values (FPM) values for the histological type are given. For significance: A Wilcoxon-Mann-Whitney test with multiple testing correction was per-formed. Values are significant when thep-value is lower than the False Discovery Rate (FDR). The cutoff for the FDR was < 0.05.Table S4b. Dif-ferential gene expression in Astrocytomas (A) vs. glioblastoma (G). A total of 50 genes were differentially expressed between the two histological types. Only genes that were significantly different are shown. Mean gene expression values (FPM) values for the histological type are given. For sig-nificance: A Wilcoxon-Mann-Whitney test with multiple testing correction was performed. Values are significant when the p-value is lower than the False Discovery Rate (FDR). The cutoff for the FDR was < 0.05.Table S4c.
Differential gene expression in Astrocytomas (A) vs. oligodendroglioma (O). One gene was differentially expressed between the two histological types. Only genes that were significantly different are shown. Mean gene expression values (FPM) values for the histological type are given. For sig-nificance: A Wilcoxon-Mann-Whitney test with multiple testing correction was performed. Values are significant when the p-value is lower than the False Discovery Rate (FDR). The cutoff for the FDR was < 0.05.
Additional file 6: Table S5.Analysis of validation cohort. Shown are fold changes of gene expression values, calculated by dividing mean values of each transcript in the group of IDHwt tumors by that in the group of IDHmut tumors in the test cohort and validation cohort.
Acknowledgements
We thank Carlijn van de Water and Tessa de Bitter (Radboudumc, Dept. of Pathology), for help with smMIP design. We thank Sanne van Lith (Radboudumc, Dept. of Radiology and nuclear medicine) and Kiek Verrijp (Radboudumc, Dept. of Pathology) for immunohistochemical stainings. KL was funded by the Dutch Cancer Society, grant UvA2014-6839, CvdH was supported by Eurostars (E9616) and the Stop Brain Tumour Foundation.
Author's contribution
KL: clinical data collection and statistical analysis; CNAMvdH: t/RNA-NGS processing and analysis, AvE: R-analysis, DE: t/RNA-NGS, RdB, bio-informatic data handling, ET: w/RNA-NGS, GW: w/RNA-NGS analysis, BK: histopathology; MtD::clinical data management, Mt: surgical tissue, MAH: computational
biol-ogy, WPL: study design and data analysis. All authors: manuscript writing and editing. All authors read and approved the final manuscript.
Competing interests
Radboudumc has filed a patent on smMIP-based RNA sequencing. The au-thors have no conflicts of interest to declare.
Author details
1
Department of Biochemistry, Radboud Institute for Molecular Life Sciences, Geert Grooteplein 26, 6525, GA, Nijmegen, The Netherlands.2Center for
Inc, 4545 Towne Centre Court, San Diego, CA 92121, USA.4Department of
Pathology, Radboud University Medical Center, Geert Grooteplein 10, 6525, GA, Nijmegen, The Netherlands.5Department of Neurosurgery, Radboud
University Medical Center, Geert Grooteplein 10, 6525, GA, Nijmegen, The Netherlands.
Received: 9 September 2019 Accepted: 2 October 2019
References
1. Basu S, Murphy ME (2016) Genetic modifiers of the p53 pathway. Cold Spring Harb Perspect Med 6:a026302.https://doi.org/10.1101/cshperspect. a026302
2. Baugh EH, Ke H, Levine AJ, Bonneau RA, Chan CS (2018) Why are there hotspot mutations in the TP53 gene in human cancers? Cell Death Differ 25:154–160.https://doi.org/10.1038/cdd.2017.180
3. Bhattacharya P, Patel TN (2018) Microsatellite instability and promoter Hypermethylation of DNA repair genes in hematologic malignancies: a forthcoming direction toward diagnostics. Hematology 23:77–82.https:// doi.org/10.1080/10245332.2017.1354428
4. Du Z, Lovly CM (2018) Mechanisms of receptor tyrosine kinase activation in cancer. Mol Cancer 17:58.https://doi.org/10.1186/s12943-018-0782-4 5. Hendriks W, Bourgonje A, Leenders W, Pulido R (2018) Proteinaceous
regulators and inhibitors of protein tyrosine phosphatases. Molecules 23. https://doi.org/10.3390/molecules23020395
6. Choudhry H, Harris AL (2018) Advances in hypoxia-inducible factor biology. Cell Metab 27:281–298.https://doi.org/10.1016/j.cmet.2017.10.005 7. Petrova V, Annicchiarico-Petruzzelli M, Melino G, Amelio I (2018) The
hypoxic tumour microenvironment. Oncogenesis 7:10.https://doi.org/10. 1038/s41389-017-0011-9
8. Potente M, Gerhardt H, Carmeliet P (2011) Basic and therapeutic aspects of angiogenesis. Cell 146:873–887.https://doi.org/10.1016/j.cell.2011.08.039 9. Ghosh D, Nandi S, Bhattacharjee S (2018) Combination therapy to
checkmate Glioblastoma: clinical challenges and advances. Clin Transl Med 7:33.https://doi.org/10.1186/s40169-018-0211-8
10. Ariazi EA, Jordan VC (2006) Estrogen-related receptors as emerging targets in cancer and metabolic disorders. Curr Top Med Chem 6:203–215 11. Gaillard-Moguilewsky M (1991) Pharmacology of antiandrogens and value
of combining androgen suppression with antiandrogen therapy. Urology 37:5–12
12. Lenting K, Verhaak R, Ter Laan M, Wesseling P, Leenders W (2017) Glioma: experimental models and reality. Acta Neuropathol 133:263–282.https://doi. org/10.1007/s00401-017-1671-4
13. Pant S, Hubbard J, Martinelli E, Bekaii-Saab T (2018) Clinical update on K-Ras targeted therapy in gastrointestinal cancers. Crit Rev Oncol Hematol 130:78– 91.https://doi.org/10.1016/j.critrevonc.2018.07.011
14. Agianian B, Gavathiotis E (2018) Current insights of BRAF inhibitors in Cancer. J Med Chem 61:5775–5793.https://doi.org/10.1021/acs.jmedchem. 7b01306
15. Mondesir J, Willekens C, Touat M, de Botton S (2016) IDH1 and IDH2 mutations as novel therapeutic targets: current perspectives. J Blood Med 7: 171–180.https://doi.org/10.2147/JBM.S70716
16. Nicolaides TP, Li H, Solomon DA, Hariono S, Hashizume R, Barkovich K, Baker SJ, Paugh BS, Jones C, Forshew Tet al (2011) Targeted therapy for BRAFV600E malignant astrocytoma. Clin Cancer Res 17: 7595–7604 Doi https://doi.org/10.1158/1078-0432.CCR-11-1456
17. Rubin MA, Demichelis F (2018) The genomics of prostate Cancer: emerging understanding with technologic advances. Mod Pathol 31: S1–11 Doi https://doi.org/10.1038/modpathol.2017.166
18. Eijkelenboom A, Kamping EJ, Kastner-van Raaij AW, Hendriks-Cornelissen SJ, Neveling K, Kuiper RP, Hoischen A, Nelen MR, Ligtenberg MJ, Tops BB (2016) Reliable next-generation sequencing of formalin-fixed, paraffin-embedded tissue using single molecule tags. J Mol Diagn 18:851–863.https://doi.org/ 10.1016/j.jmoldx.2016.06.010
19. Gorgannezhad L, Umer M, Islam MN, Nguyen NT, Shiddiky MJA (2018) Circulating tumor DNA and liquid biopsy: opportunities, challenges, and recent advances in detection technologies. Lab Chip 18:1174–1196.https:// doi.org/10.1039/C8LC00100F
20. Hyman DM, Piha-Paul SA, Won H, Rodon J, Saura C, Shapiro GI, Juric D, Quinn DI, Moreno V, Doger Bet al (2018) HER kinase inhibition in patients
with HER2- and HER3-mutant cancers. Nature 554: 189–194 Doihttps://doi. org/10.1038/nature25475
21. Neveling K, Mensenkamp AR, Derks R, Kwint M, Ouchene H, Steehouwer M, van Lier B, Bosgoed E, Rikken A, Tychon Met al (2017) BRCA testing by single-molecule molecular inversion probes. Clin Chem 63: 503–512 Doi https://doi.org/10.1373/clinchem.2016.263897
22. Brien GL, Valerio DG, Armstrong SA (2016) Exploiting the Epigenome to control Cancer-promoting gene-expression programs. Cancer Cell 29:464– 476.https://doi.org/10.1016/j.ccell.2016.03.007
23. Capper D, Jones DTW, Sill M, Hovestadt V, Schrimpf D, Sturm D, Koelsche C, Sahm F, Chavez L, Reuss DEet al (2018) DNA methylation-based
classification of central nervous system tumours. Nature 555: 469–474 Doi https://doi.org/10.1038/nature26000
24. Capper D, Stichel D, Sahm F, Jones DTW, Schrimpf D, Sill M, Schmid S, Hovestadt V, Reuss DE, Koelsche Cet al (2018) Practical implementation of DNA methylation and copy-number-based CNS tumor diagnostics: the Heidelberg experience. Acta Neuropathol 136: 181–210 Doihttps://doi.org/ 10.1007/s00401-018-1879-y
25. Kangsamaksin T, Tattersall IW, Kitajewski J (2014) Notch functions in developmental and tumour angiogenesis by diverse mechanisms. Biochem Soc Trans 42:1563–1568.https://doi.org/10.1042/BST20140233
26. Saharinen P, Eklund L, Pulkki K, Bono P, Alitalo K (2011) VEGF and angiopoietin signaling in tumor angiogenesis and metastasis. Trends Mol Med 17:347–362.https://doi.org/10.1016/j.molmed.2011.01.015 27. Kusters B, de Waal RM, Wesseling P, Verrijp K, Maass C, Heerschap A,
Barentsz JO, Sweep F, Ruiter DJ, Leenders WP (2003) Differential effects of vascular endothelial growth factor a isoforms in a mouse brain metastasis model of human melanoma. Cancer Res 63:5408–5413
28. Frampton GM, Ali SM, Rosenzweig M, Chmielecki J, Lu X, Bauer TM, Akimov M, Bufill JA, Lee C, Jentz Det al (2015) Activation of MET via diverse exon 14 splicing alterations occurs in multiple tumor types and confers clinical sensitivity to MET inhibitors. Cancer discovery 5: 850–859 Doihttps://doi. org/10.1158/2159-8290.CD-15-0285
29. Greenall SA, Johns TG (2016) EGFRvIII: the promiscuous mutation. Cell Death Discov 2:16049.https://doi.org/10.1038/cddiscovery.2016.49
30. Lowenstein PR, Castro MG (2014) The value of EGFRvIII as the target for glioma vaccines. AM Soc Clin Oncol Educ book: 42-50 Doihttps://doi.org/ 10.14694/EdBook_AM.2014.34.42
31. Navis AC, van Lith SA, van Duijnhoven SM, de Pooter M, Yetkin-Arik B, Wesseling P, Hendriks WJ, Venselaar H, Timmer M, van Cleef Pet al (2015) Identification of a novel MET mutation in high-grade glioma resulting in an auto-active intracellular protein. Acta Neuropathol 130: 131–144 Doihttps:// doi.org/10.1007/s00401-015-1420-5
32. Sottoriva A, Spiteri I, Piccirillo SG, Touloumis A, Collins VP, Marioni JC, Curtis C, Watts C, Tavare S (2013) Intratumor heterogeneity in human glioblastoma reflects cancer evolutionary dynamics. Proc Natl Acad Sci U S A 110:4009– 4014.https://doi.org/10.1073/pnas.1219747110
33. Stupp R, Mason WP, van den Bent MJ, Weller M, Fisher B, Taphoorn MJ, Belanger K, Brandes AA, Marosi C, Bogdahn Uet al (2005) Radiotherapy plus concomitant and adjuvant temozolomide for glioblastoma. N Engl J Med 352: 987–996 Doihttps://doi.org/10.1056/NEJMoa043330
34. Claes A, Idema AJ, Wesseling P (2007) Diffuse glioma growth: a guerilla war. Acta Neuropathol 114:443–458. https://doi.org/10.1007/s00401-007-0293-7
35. de Bitter T, van de Water C, van den Heuvel C, Zeelen C, Eijkelenboom A, Tops B, Oosterwijk E, Kolev D, Mulders P, Ter Laan Met al (2017) Profiling of the metabolic transcriptome via single molecule molecular inversion probes. Sci Rep 7: 11402 Doihttps://doi.org/10.1038/s41598-017-11035-0 36. Lenting K, Khurshed M, Peeters TH, van den Heuvel C, van Lith SAM, de
Bitter T, Hendriks W, Span PN, Molenaar RJ, Botman Det al (2019) Isocitrate dehydrogenase 1-mutated human gliomas depend on lactate and glutamate to alleviate metabolic stress. FASEB J 33: 557–571 Doihttps://doi. org/10.1096/fj.201800907RR
37. van den Heuvel C, Das AI, de Bitter T, Simmer F, Wurdinger T, Molina-Vila MA, Leenders WPJ (2018) Quantification and localization of oncogenic receptor tyrosine kinase variant transcripts using molecular inversion probes. Sci Rep 8:7072.https://doi.org/10.1038/s41598-018-25328-5
39. Lenting K, Khurshed M, Peeters TH, van den Heuvel C, van Lith SAM, de Bitter T, Hendriks W, Span PN, Molenaar RJ, Botman Det al (2018) Isocitrate dehydrogenase 1-mutated human gliomas depend on lactate and glutamate to alleviate metabolic stress. FASEB J: fj201800907RR Doihttps:// doi.org/10.1096/fj.201800907RR
40. O'Roak BJ, Vives L, Fu W, Egertson JD, Stanaway IB, Phelps IG, Carvill G, Kumar A, Lee C, Ankenman Ket al (2012) Multiplex targeted sequencing identifies recurrently mutated genes in autism spectrum disorders. Science 338: 1619–1622 Doihttps://doi.org/10.1126/science.1227764
41. Galili T (2015) Dendextend: an R package for visualizing, adjusting and comparing trees of hierarchical clustering. Bioinformatics 31:3718–3720. https://doi.org/10.1093/bioinformatics/btv428
42. Dobin A, Davis CA, Schlesinger F, Drenkow J, Zaleski C, Jha S, Batut P, Chaisson M, Gingeras TR (2013) STAR: ultrafast universal RNA-seq aligner. Bioinformatics 29:15–21.https://doi.org/10.1093/bioinformatics/bts635 43. Louis DN, Perry A, Reifenberger G, von Deimling A, Figarella-Branger D,
Cavenee WK, Ohgaki H, Wiestler OD, Kleihues P, Ellison DW (2016) The 2016 World Health Organization classification of tumors of the central nervous system: a summary. Acta Neuropathol 131:803–820.https://doi.org/10.1007/ s00401-016-1545-1
44. Tonjes M, Barbus S, Park YJ, Wang W, Schlotter M, Lindroth AM, Pleier SV, Bai AHC, Karra D, Piro RMet al (2013) BCAT1 promotes cell proliferation through amino acid catabolism in gliomas carrying wild-type IDH1. Nat Med 19: 901–908 Doihttps://doi.org/10.1038/nm.3217
45. Gan HK, Kaye AH, Luwor RB (2009) The EGFRvIII variant in glioblastoma multiforme. J Clin Neurosci 16:748–754.https://doi.org/10.1016/j.jocn.2008.12.005 46. Stone TJ, Keeley A, Virasami A, Harkness W, Tisdall M, Izquierdo Delgado E,
Gutteridge A, Brooks T, Kristiansen M, Chalker Jet al (2018) Comprehensive molecular characterisation of epilepsy-associated glioneuronal tumours. Acta Neuropathol 135: 115–129 Doi https://doi.org/10.1007/s00401-017-1773-z
47. Dahiya S, Haydon DH, Alvarado D, Gurnett CA, Gutmann DH, Leonard JR (2013) BRAF(V600E) mutation is a negative prognosticator in pediatric ganglioglioma. Acta Neuropathol 125:901–910.https://doi.org/10.1007/ s00401-013-1120-y
48. Wang J, Liu Z, Cui Y, Liu Y, Fang J, Xu L, He Y, Du J, Su Y, Zou Wet al (2019) Evaluation of EZH2 expression, BRAF V600E mutation, and CDKN2A/B deletions in epithelioid glioblastoma and anaplastic pleomorphic xanthoastrocytoma. J Neurooncol: Doi https://doi.org/10.1007/s11060-019-03212-0
49. Ekiz HA, Lai SA, Gundlapalli H, Haroun F, Williams MA, Welm AL (2018) Inhibition of RON kinase potentiates anti-CTLA-4 immunotherapy to shrink breast tumors and prevent metastatic outgrowth. Oncoimmunology 7: e1480286.https://doi.org/10.1080/2162402X.2018.1480286
50. Chen Y, Hu F, Zhou Y, Chen W, Shao H, Zhang Y (2013) MGMT promoter methylation and glioblastoma prognosis: a systematic review and meta-analysis. Arch Med Res 44:281–290.https://doi.org/10.1016/j.arcmed.2013.04. 004
51. Hegi ME, Stupp R (2015) Withholding temozolomide in glioblastoma patients with unmethylated MGMT promoter--still a dilemma? Neuro-Oncology 17:1425–1427.https://doi.org/10.1093/neuonc/nov198 52. Molenaar RJ, Verbaan D, Lamba S, Zanon C, Jeuken JW, Boots-Sprenger SH,
Wesseling P, Hulsebos TJ, Troost D, van Tilborg AAet al (2014) The combination of IDH1 mutations and MGMT methylation status predicts survival in glioblastoma better than either IDH1 or MGMT alone. Neuro-Oncology 16: 1263–1273 Doihttps://doi.org/10.1093/neuonc/nou005 53. Phillips AC, Boghaert ER, Vaidya KS, Mitten MJ, Norvell S, Falls HD, DeVries
PJ, Cheng D, Meulbroek JA, Buchanan FGet al (2016) ABT-414, an antibody-drug conjugate targeting a tumor-selective EGFR epitope. Mol Cancer Ther 15: 661–669 Doihttps://doi.org/10.1158/1535-7163.MCT-15-0901 54. Eckhardt SG, Lieu C (2018) Is precision medicine an oxymoron? JAMA
Oncol: Doi.https://doi.org/10.1001/jamaoncol.2018.5099
55. Tredan O, Wang Q, Pissaloux D, Cassier P, de la Fouchardiere A, Fayette J, Desseigne F, Ray-Coquard I, de la Fouchardiere C, Frappaz Det al (2019) Molecular screening program to select molecular-based recommended therapies for metastatic cancer patients: analysis from the ProfiLER trial. Ann Oncol 30: 757–765 Doihttps://doi.org/10.1093/annonc/mdz080
56. van den Heuvel C, Navis AC, de Bitter T, Amiri H, Verrijp K, Heerschap A, Rex K, Dussault I, Caenepeel S, Coxon Aet al (2017) Selective MET kinase inhibition in MET-dependent Glioma models alters gene expression and
induces tumor plasticity. Mol Cancer Res: Doi https://doi.org/10.1158/1541-7786.MCR-17-0177
57. Birkman EM, Elzagheid A, Jokilehto T, Avoranta T, Korkeila E, Kulmala J, Syrjanen K, Westermarck J, Sundstrom J (2018) Protein phosphatase 2A (PP2A) inhibitor CIP2A indicates resistance to radiotherapy in rectal cancer. Cancer Med 7:698–706.https://doi.org/10.1002/cam4.1361
58. Navis AC, Bourgonje A, Wesseling P, Wright A, Hendriks W, Verrijp K, van der Laak JA, Heerschap A, Leenders WP (2013) Effects of dual targeting of tumor cells and stroma in human glioblastoma xenografts with a tyrosine kinase inhibitor against c-MET and VEGFR2. PLoS One 8:e58262.https://doi. org/10.1371/journal.pone.0058262
59. van den Heuvel C, Navis AC, de Bitter T, Amiri H, Verrijp K, Heerschap A, Rex K, Dussault I, Caenepeel S, Coxon Aet al (2017) Selective MET kinase inhibition in MET-dependent Glioma models alters gene expression and induces tumor plasticity. Molecular cancer research : MCR 15: 1587–1597 Doihttps://doi.org/10.1158/1541-7786.MCR-17-0177
60. Nomura N, Pastorino S, Jiang P, Lambert G, Crawford JR, Gymnopoulos M, Piccioni D, Juarez T, Pingle SC, Makale Met al (2014) Prostate specific membrane antigen (PSMA) expression in primary gliomas and breast cancer brain metastases. Cancer Cell Int 14: 26 Doi https://doi.org/10.1186/1475-2867-14-26
61. Salas Fragomeni RA, Menke JR, Holdhoff M, Ferrigno C, Laterra JJ, Solnes LB, Javadi MS, Szabo Z, Pomper MG, Rowe SP (2017) Prostate-specific membrane antigen-targeted imaging with [18F] DCFPyL in high-grade Gliomas. Clin Nucl Med 42:e433–e435.https://doi.org/10.1097/RLU. 0000000000001769
62. Wernicke AG, Edgar MA, Lavi E, Liu H, Salerno P, Bander NH, Gutin PH (2011) Prostate-specific membrane antigen as a potential novel vascular target for treatment of glioblastoma multiforme. Arch Pathol Lab Med 135: 1486–1489.https://doi.org/10.5858/arpa.2010-0740-OA
63. Zalcman N, Canello T, Ovadia H, Charbit H, Zelikovitch B, Mordechai A, Fellig Y, Rabani S, Shahar T, Lossos Aet al (2018) Androgen receptor: a potential therapeutic target for glioblastoma. Oncotarget 9: 19980-19993 Doihttps:// doi.org/10.18632/oncotarget.25007
64. Haapasalo J, Hilvo M, Nordfors K, Haapasalo H, Parkkila S, Hyrskyluoto A, Rantala I, Waheed A, Sly WS, Pastorekova Set al (2008) Identification of an alternatively spliced isoform of carbonic anhydrase XII in diffusely infiltrating astrocytic gliomas. Neuro-Oncology 10: 131–138 Doihttps://doi.org/10. 1215/15228517-2007-065
65. Mboge MY, Mahon BP, McKenna R, Frost SC (2018) Carbonic anhydrases: role in pH control and Cancer. Metabolites 8.https://doi.org/10.3390/ metabo8010019
66. Fiedler L, Kellner M, Gosewisch A, Oos R, Boning G, Lindner S, Albert N, Bartenstein P, Reulen HJ, Zeidler Ret al (2018) Evaluation of (177) Lu-CHX-A” -DTPA-6A10 fab as a radioimmunotherapy agent targeting carbonic anhydrase XII. Nucl Med Biol 60: 55–62 Doihttps://doi.org/10.1016/j. nucmedbio.2018.02.004
Publisher’s Note