University of New Orleans University of New Orleans
ScholarWorks@UNO
ScholarWorks@UNO
University of New Orleans Theses and
Dissertations Dissertations and Theses
Spring 5-16-2014
Spatial Analysis of Post-Hurricane Katrina Thermal Pattern and
Spatial Analysis of Post-Hurricane Katrina Thermal Pattern and
Intensity in Greater New Orleans: Implications for Urban Heat
Intensity in Greater New Orleans: Implications for Urban Heat
Island Research
Island Research
Aram P. Lief
University of New Orleans, aplief@uno.edu
Follow this and additional works at: https://scholarworks.uno.edu/td
Part of the Environmental Monitoring Commons, Physical and Environmental Geography Commons, Remote Sensing Commons, and the Sustainability Commons
Recommended Citation Recommended Citation
Lief, Aram P., "Spatial Analysis of Post-Hurricane Katrina Thermal Pattern and Intensity in Greater New Orleans: Implications for Urban Heat Island Research" (2014). University of New Orleans Theses and Dissertations. 1820.
https://scholarworks.uno.edu/td/1820
This Dissertation is protected by copyright and/or related rights. It has been brought to you by ScholarWorks@UNO with permission from the rights-holder(s). You are free to use this Dissertation in any way that is permitted by the copyright and related rights legislation that applies to your use. For other uses you need to obtain permission from the rights-holder(s) directly, unless additional rights are indicated by a Creative Commons license in the record and/ or on the work itself.
Spatial Analysis of Post-Hurricane Katrina Thermal Pattern and Intensity in Greater New Orleans: Implications for Urban Heat Island Phenomenon
A Dissertation
Submitted to the Graduate Faculty of the University of New Orleans in partial fulfillment of the requirements for the degree of
Doctor of Philosophy in
Urban Studies
by
Aram Parrish Lief
B.A. University of New Orleans, 1993 M.M. Southeastern Louisiana University, 1996
M.S. University of New Orleans, 2008
ACKNOWLEDGEMENTS
There are several people and organizations that deserve hearty thanks for helping me
throughout the duration of my education. First, I want to thank my advisor Dr. Mahtab A. Lodhi
for agreeing to advise me and chair this project, for his patience and understanding, and for
inspiring me to become a geographer and geospatial scientist. This work would not have
happened without his help, and I am a grateful recipient of his kindness and friendship. Dr.
Germana Peggion endeavored to persevere, tending me with great patience. I cannot thank her
enough for the generosity she has shown me. Committee member Dr. Juliette Ioup is the kindest,
and most versatile physicist I have ever known, and the first to make me want to study physics. I
am grateful for her help. I also owe my gratitude to Dr. Renia Ehrenfeucht for agreeing on such
short notice to be on the committee, but also for numerous times she has helped me in her
capacity as Ph.D. Coordinator.
There are many other people I want to thank who work in various institutions,
departments and offices, such as the Graduate School, the College of Liberal Arts, and the Office
of Research and Sponsored Programs. In no particular order, I give thanks to: Scott Whittenburg,
Anthony Cipolone, Jane Brooks, David Lambour, Liz Sigler, Steve Striffler, Rebecca Drake,
Amanda Athey, Kevin Graves, Juana Ibáñez, James McAllister, and many more at the University
of New Orleans. I also thank Chris Critini and others at the National Wetlands Research Center
in Lafayette, Louisiana. I give special thanks to Lynn Dupont at the Regional Planning
Commission, Alaa Shams and Craig Johnson at the Louisiana Geographic Information Center,
and many other friends and supporters like John Sheehan at the Louisiana Department of
Environmental Quality, David Gisclair at the Louisiana Oil Spill Coordinator's Office, Katherine
Planning Commission. I also thank those who provided help and technical assistance with
computer software applications, such as Diane Geheber and Andy Zusmanis at Intergraph
Corporation (ERDAS, Inc).
I am very grateful to have such a loving and supportive family as Tom, Dona, and Shane,
and my grandparents Noche, Echo, Alfred, and Zola. Including the rest of my family, together we
are truly unique in this vast cosmos. Words do not do justice when describing the love and
gratitude I have for my best friend and wife Mirella, and her parents Vandeval and Antônia,
muito obrigado. Finally, I want to express my deepest love and affection for our baby girl, Lela,
TABLE OF CONTENTS
ACKNOWLEDGEMENTS... iii
LIST OF FIGURES... vii
LIST OF TABLES...ix
LIST OF ABBREVIATIONS... x
ABSTRACT... xiii
1. INTRODUCTION 1.1 Purpose of this Study... 3
1.2 Study Area... 6
1.3 Research Problem... 13
1.4 Research Objectives...15
2. LITERATURE REVIEW 2.1 Introduction...17
2.2 The Urban Heat Island Phenomenon... 18
2.3 Remote Sensing of Urban Heat Islands... 25
2.3.1 Pre-Processing Satellite Data...32
2.3.2 Image-Based Land Cover Analysis...33
2.3.3 Imagery Enhancement... 35
2.3.4 Imagery-Based Land Surface Temperature Measurement...43
2.3.5 Imagery-Based Change Analysis... 49
3. METHODOLOGY 3.1 Introduction...58
3.2 Imagery Data...60
3.3 Imagery Pre-Processing... 62
3.3.1 Atmospheric and Radiometric Correction of Imagery Data...63
3.3.2 Extraction of Study Area...65
3.4 Imagery Analysis... 67
3.4.1 Imagery-Based LST Retrieval... 67
3.4.2 Imagery Classification for Change Analysis...73
3.4.3 Spectral Computations... 73
3.4.4 Orthogonal Transformations... 75
3.5 Accuracy assessment...75
4. POST-KATRINA URBAN SURFACE TEMPERATURE PATTERN AND INTENSITY ANALYSIS 4.1 Introduction...79
4.2 Analyzing the Land Surface Temperature Within the Study Area... 80
4.2.1 Normalization of Satellite-derived LST...81
4.3 Analyzing the Land Surface Temperature Variability...85
4.3.1 Temperature Classes for Change Detection... 86
4.3.2 Results...89
4.4.1 Matrix Analysis of LST ISODATA Classifications...97
4.4.2 Validation of Results... 106
4.5 Local Urban Heat Island Temperature Sensitivity Index...108
5. POST-KATRINA LAND COVER ANALYSIS USING SATELLITE IMAGERY 5.1 Introduction...110
5.2 Vegetation Indices... 111
5.2.1 Enhancement Results... 113
5.3 Change Analysis...116
5.3.1 Image Differencing Method...116
5.3.2 RGB Composite Method...123
5.4 Analyzing the Bare Surfaces...125
5.4.1 Introduction...125
5.2.2 Spectral Indices for Urbanized Surfaces...126
6. CONCLUSION... 131
REFERENCES...140
APPENDIX A: Chavez COST Normalization Model...163
APPENDIX B: LST Image Retrieval Models... 164
APPENDIX C: Field Maps, Instruments, and Photographs... 165
APPENDIX D: COOP Station Field Calibration... 168
APPENDIX E: Models of Spectral Indices ... 173
APPENDIX F: Local Urban Heat Island Temperature Sensitivity Maps ...175
LIST OF FIGURES
Figure 1.1 – October 9th, 2005 Landsat 5 TM natural color image of study area...3
Figure 1.2 – Map showing levee breaches and flooded areas...8
Figure 1.3 – October 9th, 2005 Landsat 5 TM false-color composite image of study area...13
Figure 2.1 – EPA depiction of UHI...19
Figure 2.2 – Components of the urban atmosphere... 20
Figure 2.3 – The Electromagnetic Spectrum... 26
Figure 2.4 – The Earth's annual global mean energy budget... 29
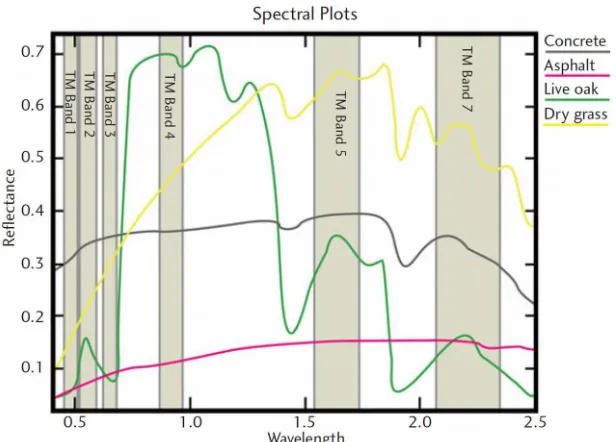
Figure 2.5 – Spectral plots of feature classes...36
Figure 3.1 – AOI subset shape file and October 8th, 1987 Landsat TM false-color image...66
Figure 3.2 – Atmospheric Parameter Correction Calculator results... 70
Figure 3.3 – ASTER and ETM+ band ranges and atmospheric transmission...71
Figure 3.4 – ASTER emissivity transects in the AOI... 72
Figure 3.5 – Photo of Live Oak tree defoliation after hurricane Isaac, August 31st, 2012...78
Figure 4.1 – LST change detection processing flowchart...81
Figure 4.2 – The LST pixel in the cross-hairs is 29.9° C at KMSY station location...84
Figure 4.3 – Six color coded ISODATA classes for October 17th, 2002... 87
Figure 4.4 – 2005 LST image of AOI, and 2003-2005 LST change...89
Figure 4.5 – The LST images and pixels of an urban forest in Meraux, St. Bernard...91
Figure 4.6 – St. James Playground in Gentilly October 2005...91
Figure 4.7 – An urban forest in Gentilly neighborhood...92
Figure 4.8 – Pixel comparison located at the Edith Sampson Playground... 93
Figure 4.9 – Comparison of AOI-HG October 2003, 2005, 2010 LST images...95
Figure 4.10 – Histograms of LSTs for October 2003 and October 2005...96
Figure 4.11 – October 1987 and October 1992 LST images... 97
Figure 4.12 – October 1992 and October 1997 LST images... 98
Figure 4.13 – October 1997 and October 2002 images... 99
Figure 4.14 – October 2002 and October 2003 LST images... 100
Figure 4.15 – October 2003 and October 2005 LST images... 100
Figure 4.16 – October 2005 and September 2006 LST images...102
Figure 4.17 – September 2006 and October 2008 LST images...103
Figure 4.18 – October 2008 and October 2010 LST images... 103
Figure 4.19 – October 1987 and October 2010 LST images... 104
Figure 4.20 – Histograms of LSTs for October 2003 and October 2005...105
Figure 4.21 – October 9th, 2005 ISODATA classification result...108
Figure 5.1 – Change results of NDVI and MSAVI-2: October 2003 to October 2005...114
Figure 5.2 – Change results of MNDWI and NDMI: October 2003 to October 2005...114
Figure 5.3 – TCT and PC change detection results compared for October 2003 and 2005...115
Figure 5.4 – NDMI image differences: 1987 to 1992, and 1992 to 1997... 117
Figure 5.5 – DOQ, NDMI difference image, TM LST image, and NHAP CIR aerial photo...118
Figure 5.6 – NDMI image differences: 1997 to 2002, and 2002 to 2003... 119
Figure 5.7 – DOQ, NDMI difference image, LST image, and high resolution aerial photo...119
Figure 5.8 – NDMI image differences: 2003 to 2005, and 2005 to 2006...120
Figure 5.9 – DOQs, TM NDMI difference image, LST image...121
Figure 5.11 – DOQ, TM NDMI difference image 2006-2008, 2008 LST image...122
Figure 5.12 – RGB-NDVI and RGB-NDMI compared: 2003-2005-2006... 123
Figure 5.13 – RGB-NDVI composites: 1987-1992-1997, and 1997-2002-2003...124
Figure 5.14 – RGB-NDVI composites: 2003-2005-2006, and 2006-2008-2010...124
Figure 5.15 – Hurricane Katrina's magenta footprint of vegetation change... 125
Figure 5.16 – NDBI and IBI images...127
Figure 5.17 – NDISI and BCI images...128
Figure 5.18 – Soil exposure after Katrina and return of vegetation...129
Figure 5.19 – RGB-NDBI image for October 2003 to October 2005 to September 2006...130
Figure 6.1 – Air temperature results of a transect from a mobile platform...134
Figure 6.2 – A parking lot at the location of the new Costco just before it was built...135
LIST OF TABLES
Table 2.1 – Factors that contribute to the UHI (Oke 1982)... 20
Table 3.1 – Landsat Data Imagery Collected for Study: 1984–2012...59
Table 3.2 – Landsat 5 TM band characteristics adapted from Jensen (2005)...61
Table 3.3 – Landsat TM and ETM+ Band 6 Calibration Constants...69
Table 3.4 – Vegetation Indices... 74
Table 3.5 – Built-Up Surfaces Indices... 74
Table 3.6 – Aerial imagery...76
Table 3.7 – NOAA local climatological data for KMSY for October 18th, 2012...78
Table 4.1 – Landsat TM Data Imagery: 2002–2011... 80
Table 4.2 – Simulated climate of images before year 2000 for Oct. 25th 1999...83
Table 4.3 – Averaged pixel temperature results for two methods of LST retrieval...85
Table 4.4 – ISODATA classes of temperature for October 17th, 2002...88
Table 4.5 – LST image subtraction results for estimating the spatial growth of UHI...90
Table 4.6 – LST pixel results for an empty lot in the Hollygrove Neighborhood...94
Table 4.7 – Image subtraction results for AOI-HG for estimating the spatial growth of UHI...96
Table 4.8 – Image histogram statistics for October 2003 and October 2005 LSTs...96
Table 4.9 – October 1987 to October 1992 LST change results... 97
Table 4.10 – October 1992 to October 1997 LST change results... 98
Table 4.11 – October 1997 to October 2002 LST change results... 99
Table 4.12 – October 2002 to October 2003 LST change results... 100
Table 4.13 – October 2003 to October 2005 LST net increase change results...101
Table 4.14 – Histogram bin counts for October 2003 and October 2005... 101
Table 4.15 – October 2005 to September 2006 LST change results...102
Table 4.16 – September 2006 to October 2008 LST change results...103
Table 4.17 – October 2008 to October 2010 LST change results... 103
Table 4.18 – October 1987 to October 2010 LST change results... 104
Table 4.19 – Image histogram statistics for October 1987 and October 2010 LST images...105
Table 4.20 – Histogram bin counts for October 1987 and 2010 LST ISODATA images...105
Table 4.21 – Net surface area change results for 1987 to 2010 LST ISODATA images...106
Table 4.22 – Unsupervised ISODATA accuracy results – Chavez COST correction...107
Table 4.23 – Unsupervised ISODATA accuracy results – COST Maker correction...107
Table 4.24 – The Local UHI Thermal Sensitivity (LUHITS) classes...109
Table 5.1 – Tropical cyclone impacts and Landsat TM images of the study area...110
Table 5.2 – RGB-NDVI change classification for years 2003 to 2005 and 2005 to 2006...124
Table 5.3 – Built-Up/Urban Indices...126
LIST OF ABBREVIATIONS
AC-LST Atmospherically Corrected Land Surface Temperature
AOI Area of Interest
AOI-HG Area of Interest-Hollygrove
APCC Atmospheric Parameter Correction Calculator
ASTER Advanced Spaceborne Thermal Emission and Reflectance Radiometer AVHRR Advanced Very High Resolution Radiometer
BCI Biophysical Composition Index
BT Brightness Temperature
C Celsius
CAT Hurricane Categories 1−5
CD Change Detection
CIR Color Infrared
Cm Centimeters
COOP Cooperative Observer Program
COST Cosine approximation model
DN Digital Numbers
DOQQ Digital Ortho Quarter Quad
DOS Dark Object Subtraction
EM Electromagnetic energy
ET Evapotranspiration
ETM+ Enhanced Thematic Mapper Plus
GIS Geographical Information System
GNDVI Green Normalized Difference Vegetation Index
GNO Greater New Orleans
GPS Global Positioning Satellite
HRO High Resolution Orthoimagery
HRPT High Resolution Picture Transmission
IBI Index-based Built-up Index
ISODATA Iterative Self-Organizing Data Analysis
K Kelvin
Km Kilometers
K/ph Kilometers Per Hour
KMSY New Orleans International Airport
LCZ Local Climate Zones
LST Land Surface Temperature
LSMA Linear Spectral Mixture Analysis
LUHITS Local Urban Heat Island Temperature Sensitivity index
LULC Land Use/Land Cover
LWC Leaf Water Content Index
M Meter
MIR Middle infrared
MNDWI Modified Normalized Difference Water Index MODIS Moderate Resolution Imaging Spectroradiometer
MSAVI Modified Soil-Adjusted Vegetation Index NASA National Aeronautics and Space Administration
NBT Normalized Bright Temperature
NCDC National Climatic Data Center
NDBaI Normalized Difference Bareness Index NDBI Normalized Difference Built-up Index
NDISI Normalized Difference Impervious Surface Index NDMI Normalized Difference Moisture Index
NDVI Normalized Difference Vegetation Index
NDVI-DIFF Normalized Difference Vegetation Index Differencing NDWI Normalized Difference Water Index
NHAP National High Altitude Photography
NIR Near Infrared
NOAA National Oceanic and Atmospheric Administration
NWS National Weather Service
PET Physiological Equivalent Temperature
PCA Principal Component Analysis
RGB-NDMI Red, Green, Blue−Normalized Difference Moisture Index RGB–NDVI Red, Green, Blue−Normalized Difference Vegetation Index
SAR Synthetic Aperture Radar
SAVI Soil-Adjusted Vegetation Index
SD Standard Deviations
SEB Surface Energy Balance
SHI Surface Heat Island
SMA Spectral Mixture Analysis
SML Spatial Model Language
SUHI Surface Urban Heat Islands
SWIR Shortwave Infrared
TCC Tree canopy cover
TCT Tasseled Cap Transformation
TC1 Tassel Cap brightness
TC2 Tassel Cap greenness
TC3 Tassel Cap yellowness
TC4 Tassel Cap nonesuch
TES Temperature/Emissivity Separation algorithm
TIR Thermal infrared
TM Landsat-5 Thematic Mapper
TOA Top of Atmosphere
TOA-LST Top of Atmosphere-Land Surface Temperature
UAV Unmanned Aerial Vehicle
UBL Urban boundary layer
UCI Urban Cool Island
UCL Urban canopy layer
UHI Urban Heat Island
UHIE Urban Heat Island Effect
URI Urban Heat Island Ratio Index V-I-S Vegetation-Impervious Surface-Soil VNIR Visible and Near Infrared
VOC Volatile Organic Compounds
ABSTRACT
In 2005, Hurricane Katrina’s diverse impacts on the Greater New Orleans area included
damaged and destroyed trees, and other despoiled vegetation, which also increased the exposure
of artificial and bare surfaces, known factors that contribute to the climatic phenomenon known
as the urban heat island (UHI). This is an investigation of UHI in the aftermath of Hurricane
Katrina, which entails the analysis of pre and post-hurricane Katrina thermal imagery of the
study area, including changes to surface heat patterns and vegetative cover. Imagery from
Landsat TM was used to show changes to the pattern and intensity of the UHI effect, caused by
an extreme weather event. Using remote sensing visualization methods, in situ data, and local
knowledge, the author found there was a measurable change in the pattern and intensity of the
New Orleans UHI effect, as well as concomitant changes to vegetative land cover. This finding
may be relevant for urban planners and citizens, especially in the context of recovery from a
large-scale disaster of a coastal city, regarding future weather events, and other natural and
human impacts.
1. INTRODUCTION
This is an investigation of a climatic phenomenon known as the urban heat island (UHI)
in the aftermath of Hurricane Katrina, which severely impacted the Greater New Orleans (GNO)
area in 2005. The study entails the analysis of pre and post-hurricane Katrina thermal imagery of
the study area, including changes to surface heat patterns and vegetative cover. UHIs are
island-like areas of hot air caused by the predominance of artificial surfaces, such as streets and
buildings, and lower amount of biomass in urban areas, which makes cities hotter than their rural
surroundings. They are typically measured at the local or mesoscale, from 102 to 104 meters (Oke
1982; Stewart and Oke 2009b). UHIs are formed when hot city surfaces conduct heat up into the
air and down into the ground, creating a bubble of heat that envelopes the entire urbanized area.
Three different types of UHIs are defined according to methodological approach, instrumentation
and data: 1) atmospheric; 2) subsurface; and 3) surface. This study examined the UHI effect on
the GNO area based on satellite-derived surface temperature measurements.
All cities have UHIs to some degree, each with its own pattern influenced by its
topography, land use / land cover, and the nature of anthropogenic activity. The processes of
urbanization, and the formation of UHIs have been inextricably linked in several previous studies
(Landsberg 1956; Bornstein 1968; Chandler 1976; Matson et al. 1978). This study examines the
impact of hurricane Katrina, a severe weather phenomenon, on the natural landscape of the city
of New Orleans, and the subsequent alterations of its UHI. Thus, the main focus of the study is to
analyze the hurricane-induced land cover changes in the study area, and the impact of those
changes on the UHI. Much like previous studies, the focus of this study is on land
cover-temperature relationships. Moreover, this study is an attempt to understand some important
and its change in magnitude as only caused by processes of urbanization. To determine whether
or not the pattern of UHI was altered in some way in the aftermath of hurricane Katrina, pre-and
post-Katrina Landsat-5 Thematic Mapper (TM) imagery was analyzed in conjunction with a
range of ancillary data.
New Orleans had long been established as a city by the time Luke Howard made his
pioneering climate observations and discovery of the UHI effect of London during the years
1806-1830 (Chandler 1962). The City continued to expand into natural, and later artificially elevated
areas until its growth and morphology was constrained by an encompassing, watery topography.
Due to Bienville's strategic choice of location, originally referred to as the Place d'Armes, which is
now Jackson Square in the heart of the French Quarter, a section of New Orleans, this relatively
old city did not follow the typical patterns of urbanization of other American cities (Burgess 1982).
Pierce F. Lewis once referred to New Orleans as, “the impossible but inevitable city,” remarking
that despite modern technology the Mississippi River delta is a dangerous region, and the fact that
the City remains is explained as a “paradox between excellent location and miserable location”
(Lewis 2003). Since it is situated near the delta of a large river and is next to the Gulf of Mexico, it
has frequently experienced large-scale natural disasters like floods and hurricanes. It is situated
between Lake Pontchartrain to the north, a Gulf of Mexico bay commonly referred to as “Lake
Borgne” to the east, the Delacroix wetlands area to the southeast, Barataria swamp to the south,
Lakes Salvador and Cataouatche to the southwest, Lac des Allemands to the west-southwest, and
La Branche bayou adjacent to the westernmost urbanized surface in the City of Kenner (effectively
a suburb of New Orleans). In addition to the adjacent large water bodies, there are numerous
marshes, lagoons, ponds, and canals that encompass the urbanized area (Figure 1.1). The GNO
Figure 1.1 – October 9th, 2005 Landsat 5 TM natural color image of study area. Depicted in this figure are numerous bodies of water that surround the study area, indicated by the yellow outline. The post-Katrina flooded areas are depicted in red.
1.1 Purpose of this Study
Many scientists, political leaders, and citizens expect climate change to impact urban
environments in the future (Changnon 1992; Dixon and Mote 2003; Roth 2007). Several
scientific studies have noted temperature increase in urban environments, coupled with changes
in cloud and precipitation patterns, and more frequents floods. According to Changnon (1992),
increased urbanization, and the consequent impact on vegetative cover in densely populated
areas, has impacted local climates equal to, if not greater than, the amount of global climate
change predicted to occur over the next century. Understanding UHI and its impact on human
managers, geographers, urban planners, governmental leaders and citizens. The difficulty of
undertaking a study that measures the effects of the UHI phenomenon, for example, or any
similar investigation regarding ecosystem processes coupled with the added dimension of human
behavior, is an arduous task. Urban ecosystems are made up of complex networks of human
activities and natural forces that are in a constant state of change (Niemelä 1999). Understanding
their components, functions, and benefits to humans, the latter of which is referred to as ecosystem
services or ecosystem goods (Boyd and Banzhaf 2007), can improve urban planning and
environmental management. Studying their spatial and structural components, such as urban
morphology, and socio-economic influences using models and frameworks of understanding, can
be used to improve urban sustainability (Alberti 2008). The UHI phenomenon, and its diverse
effects, should be regarded as an integral component to the study of the urban ecosystem complex.
As a result of the hurricane, New Orleans has become a laboratory of various phenomena
being studied by the scientific community, interlinked by a large-scale, severe weather event
(Knabb 2006). Disasters of this magnitude tend to have consequences that interrupt or change
long-range processes of many different systems on multiple scales, often adding new variables.
Modern remote sensing platforms have enabled researchers to study a wide variety of
phenomenon or variables on different spatial scales, and at great distances (Jensen 2005). The
speed and accuracy at which results can be obtained have also greatly improved, thus helping
expedite the dissemination of timely, important information to those who need it. Thus far, no
comprehensive UHI study of New Orleans has been done, nor have any UHI studies examined
the impact of rapid loss of vegetative cover on the UHI of a coastal city. UHI was briefly
mentioned under “GOAL 8 Enhancement of the environmental value of urban green spaces” in
with reference to the benefit of parks and trees. However, it has not commanded the attention of
other pressing municipal issues like periodic flooding, the latter of which has been thoroughly
examined in a comprehensive plan (Waggonner and Ball 2013). It is an environmental variable
yet to be to be fully addressed. Since the results of this study have demonstrated a linkage
between these two phenomenon, where one impacts the other and vice-versa, as a result of a
catastrophic weather event, then hopefully more city planners will see the imperative need for
UHI mitigation and its implementation in local climate action plans. I surveyed over 30 climate
action plans of medium sized cities and found that only a few even mentioned urban heat island.
The action plans of very large cities like New York and Los Angeles not only mention UHI, but
also have guidelines to mitigate its effects. The forthcoming climate action plan for the City of
New Orleans should include more than a mention of the UHI effect. It should include elaborate
plans to mitigate its negative effects, while incorporating the cooling effects of living with water
in the City.
There are several reasons why cities are just beginning to adopt plans, let alone realize the
need to mitigate intense urban heat. Many cities lack necessary expertise to examine complex
and encompassing problems and the physical processes of UHIs. They may also lack funding and
have different political priorities, have some additional, unforeseen circumstances that focus
attention elsewhere. Furthermore, the pattern of slowly increasing heat is on a much longer time
scale than other natural hazards, and thus hard to recognize by those whom may be affected. Any
scientific knowledge transferred to urban planners must be presented appropriately and
effectively in order to be correctly received by the public. In addition to understanding the causal
factors and physical processes of UHI affecting the City of New Orleans with its unique
affects human health, 2) it provides an opportunity for demonstrating UHI exists via a change
and return, and 3) UHI is an important urban planning variable.
The outcome of this study will hopefully: 1) aid urban planners in New Orleans; 2)
provide useful data to be used as an input to smaller or larger scale models; and 3) inspire similar
UHI studies of other cities, especially those that have scarce resources. Due to advances in
remote sensing science an opportunity exists to analyze the impact of a major hurricane on the
UHI of New Orleans. Previous studies utilizing remote sensing techniques have addressed the
impact of hurricanes on wetlands and forests in coastal regions (Hook et al. 1991; Cablk et al.
1994; Ramsey et al. 1997; Conner 1998; Ayala-Silva and Twumasi 2004). However, there is a
dearth of studies regarding the possible linkages between catastrophic storms, and other natural
disasters, and the impact the UHI of coastal cities. After an extensive literature review, very little
was found regarding the UHI of New Orleans.
1.2 Study Area
New Orleans is the largest city in the State of Louisiana, which according to the 2010
U.S. Census, had a population of 1,167,764 for the GNO area. The state is located in the south of
the United States, and is bordered by Mississippi State to the east, Texas to the west, Arkansas to
the north, and the Gulf of Mexico to the south. The Mississippi River, which flows
approximately 4,100 kilometers from Lake Itasca in Minnesota State to the Gulf of Mexico, is a
dominant physical feature of Louisiana. It had a profound effect on the geological history of the
southeastern part of the state resulting in two, distinct areas: the much older, northern part of the
state, which has rocks that date back to the Late Cretaceous period approximately 66 million
of the Late Pleistocene approximately 125-80 thousand years ago (Coleman et al. 1998). The
most recent alluvial deposit that formed the Holocene deltaic plane, upon which New Orleans
was eventually built, occurred approximately 7,000 years ago. It stretches from the southernmost
area of the Lower Mississippi Valley, north of the capital of Louisiana, Baton Rouge, to the
portion of deltaic land, formed several, composite depositional lobes, that extends into the
northern edge of the Gulf of Mexico (Coleman 1988; Saucier 1994; Coleman et al. 1998).
Located at the edge of the continental shelf, the Mississippi River Delta is subsiding, due to
natural causes and human activities.
The City of New Orleans is located in the Lake Pontchartrain Basin, the world's fourth
largest drainage basin in the seventh largest delta (Blum and Roberts 2012). The Mississippi
River and its natural levees bisect the City from west to east, where the northern part is
colloquially called the “East Bank, and the southern part the “West Bank.” A complex system of
canals, some of which are perpendicular to the River and Lake Pontchartrain, allow for drainage
whenever there is citywide flooding. Since the majority of the City lies below sea level, it is
protected by flood walls that reach up to nearly 10 meters high, and natural levees that are at
approximate 5 meters above mean sea level. Flood protection from the Mississippi River was
originally constructed by heightening the river’s natural bank overflow levees. The natural levees
along the lake and navigation channels, such as the Inner Harbor Navigation Channel and the
Mississippi River Gulf Outlet, are 3 to 6 meters above sea level (Seed et al. 2008). Several
pumping stations are strategically placed throughout the GNO area. 100 years ago they were
“state of the art” technology, and have been updated since hurricane Katrina (Rogers 2008).
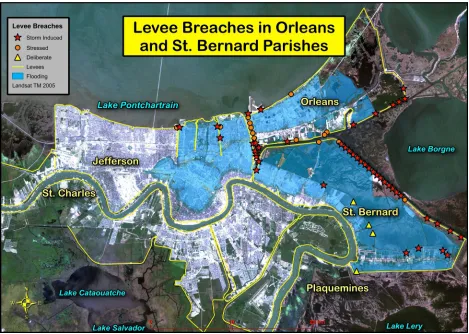
Figure 1.2 indicates where the flood wall and levee breaches occurred in late August 2005 after
city of New Orleans is located, was affected by persistent flooding, as the flood waters remained
for approximately five weeks, depending on the neighborhood and depth of elevation.
Notwithstanding Katrina and her aftermath, New Orleans has always been a high maintenance
city for drainage.
Figure 1.2 – Map showing levee breaches and flooded areas (Based on Seed et al. 2008).
The GNO area is comprised of several areas that dip below sea level, collectively averaging
approximately 1 meter, leading some people in popular media to refer to the City as
“bowl-shaped.” The areas flooded during Katrina average 2 meters below mean sea level (Seed et al.
2008). There are two 1.5 km-wide ridges formed by the river's previous location thousands of years
play an important role in the historical pattern of urbanization (Colten 2005). These former channel
and crevasse deposits form natural borders of high ground within the lowers areas that were
previously marshes and swamps. Within these deltaic channels are interdistributary basins
comprised of clay and organic soils that were formerly marsh and swamp deposits, which are now
mostly residential areas. Approximately ninety percent of the GNO area is built upon these clay,
and organic marsh and cypress swamp deposits, which requires all buildings to be supported by 20
to 50 meter long pilings that are driven down into the ground (Kolb and Saucier 1982).
The climate of New Orleans and the surrounding region is influenced by its subtropical
latitude, and it's proximity to the Gulf of Mexico, which results in milder winters than inland
areas. Summer heat is slightly attenuated by the breeze and the cooling effects of the Gulf of
Mexico to the south and Lake Pontchartrain to the north. During the winter, the average
temperature of the City normally remains above freezing, while north of Lake Pontchartrain
often experiences temperatures below 0° Celsius (C). The temperature often fluctuates between
warm and cold, as warmer tropical air and colder continental air move across the region,
depending on the location and strength of the jet stream to the north. Small water bodies
throughout the area and adjacent wetlands store heat, decreasing the impact of cool air from the
north. These water bodies sometimes have a slight cooling effect on adjacent lands during the
summer, but they tend to become very warm during long, hot summers due to their shallowness.
Humidity is often high due to the combination of increased evaporation over ponds, small lakes,
and wetlands with the high levels of water vapor already present in the subtropical atmosphere of
the region. However, the summer heat generates clouds through the process of convection, and
the prevailing southerly winds bring moist, semitropical weather, which often results in
The average annual temperature (normal dry bulb) in New Orleans is 19.9° C, and daily
average temperature ranges from 11.9° C in January to 28.5° C in July. The lowest recorded
temperature for the City was −11.6° C in December 1989, and the highest was 38.9° C in August,
1980 (NOAA 2012). Heat index calculations are often higher than 40° C on very hot and humid
days. The yearly average relative humidity is 76%, with an average low of 63% at noon, and an
average high of 88% just before sunrise. There were 766 heating days, and 3409 cooling days
from 2011 to 2012 (NOAA 2012). Heating and cooling days are standardized measurements used
to calculate the demand for fuel in order to heat or cool a building, which can be used to
determine heating and cooling costs (NOAA 2010b).
Louisiana is the wettest state in the Union with a total yearly precipitation of 158.62
centimeters (cm), and monthly extremes averaging 45.63 cm (NOAA 2012). Frequent and
sometimes heavy rains occur in the GNO area causing floods every year. Rainfall extremes for
precipitation recorded within a 24 hour period average to 23.33 cm, with the record set in
November 1989 at 32.16 cm. The May 8-10, 1995 New Orleans area flood event set the monthly
record at 53.80 cm, which inundated the City for two days, killing six people and causing 3.1
billion dollars in damage (NOAA 1997). The record was broken again in December 2009 when
75.99 cm of rain was observed for the month. The mean station (KMSY) air pressure is 1016.25
millibars (mb) (NOAA 2012). However, very low air pressures have been observed during
extreme weather events, such as Hurricane Katrina, which had the third lowest recorded central
air pressure for an Atlantic landfalling hurricane at 920 mb (NOAA 2005).
Tropical systems are common in the northern part of the Gulf of Mexico, with
cyclogenesis occurring typically below 25° degrees north latitude. Storms occur frequently
system for the Gulf of Mexico, as prior research has found that approximately 160,000 to
320,000 hurricanes have occurred in the Florida Keys area, for example, during the past two
million years (Conner et al. 1989). In addition to the significant morphological impacts along the
Louisiana coast (Stone et al.1997), hurricanes have often caused severe damage and long-term
changes to coastal ecosystems. Conner et al. (1989) noted that hurricanes could be considered as
“periodic disordering stresses” that cause profound changes to biological and physical structures,
both eliminating some habitats while creating others.
Hurricanes spawn tornadoes and create storm surges that flood coastal and inland areas
with salt water. They are classified into five categories (CAT) based on the Saffir-Simpson
hurricane wind scale (SSHS) according to the intensity and destructiveness of their sustained winds
(NOAA 2013). The majority of land-falling hurricanes spawn one or more tornadoes, which most
commonly occur in the right front quadrant of the cyclone, and can appear days after landfall.
Hurricane Katrina (2005) had 58 recorded tornadoes, and Beulah (1967) had 141. Heavy rainfall
occurs in spiral bands, and as storms intensify, rain usually becomes more concentrated around the
center. Flooding is a major hazard produced by rainfall and the storm surge, the latter of which can
exceed 7 meters in extreme cases, e.g. a 9 meter high storm surge was recorded at Pass Christian,
MS during hurricane Katrina.
The 2005 hurricane season was the most active and destructive season on record, with 23
named storms, 13 hurricanes in total, and 7 intense hurricanes (CAT3-5). Though the effects of
hurricane Katrina are most salient to this study, there have been several destructive storms that
have impacted Louisiana over the past two centuries, such as the Great Barbados hurricane of
1831, the Isle Dernière storm of 1856, the Chenière Caminanda hurricane of October 1893, the
Camille (1969), and Andrew (1992). Hurricanes are a dominant force in the northern Gulf Coast
region, often bringing devastation to people, animals, vegetation, and the built environment.
They are a fact of life for the citizens of New Orleans, the majority of whom have learned to live
with their periodic effects, and to respect their dreadful, destructive power.
The geographic extent of the study area, referred to from now on as area of interest
(AOI), covers the Greater New Orleans metropolitan area (29°51’N to 30°03’N, 89°54’W to
90°18’W) where there is a reasonable delineation between the built and non-built environment
(Figure 1.3). The AOI is approximately 530 square kilometers, or 53,000 hectares, excluding the
river that bisects it, and the distance from west to east (Kenner to New Orleans East) is
approximately 40 km, and north to south (Indian Beach to Estelle) is approximately 25 km. Since
this study focused on determining the impact of a tropical cyclone on the GNO area, it was
necessary to collect data imagery before and after the weather event, and after a period of
vegetative regrowth had occurred. TM and Landsat 7 Enhanced Thematic Mapper Plus (ETM+)
imagery from August, September, and October were acquired because the hurricane impact
occurred at the end of August, and flood water remained in many areas of the City for several
weeks. The acquisition of imagery expanded to include older dates, and different seasons. Not
only did this overcome limitations due to cloud cover and anomalies in some images close to the
target dates, but also it allowed for examination of prior cyclones that impacted the AOI.
Hurricane Andrew was a Category 4 at landfall just eighty-five miles away from New Orleans,
causing severe damage to parts of the City. However, the aftermath of Katrina included
widespread flooding, and it was expected the results from change detection would be different.
Since Andrew occurred on August 26th, 1992, imagery from this time was collected. The time
Figure 1.3 – Landsat 5 TM false-color composite image of study area. The AOI is indicated by the yellow outline. Vegetation is shown in red, and urbanized surfaces and barren soil in light gray-green.
1.3 Research Problem
Since any city, large or small, is susceptible to the UHI phenomenon, then the GNO area
is also likely affected. In addition to the effects of urbanization, the City has endured many
extreme weather events, which may have directly contributed to, if not accelerated, the effects of
natural and anthropogenic causes of UHI phenomenon. Hurricane Katrina caused unprecedented
destruction and degradation of the urban ecosystem, inflicting serious damage to city's extensive
and dense cover of large, old growth shade trees, particularly Live Oaks. Thus, any likely
thermal variation triggered by dramatic perturbation of city's natural landscape should have
measurable consequences in the form of higher sensible heat with a unique distribution and
The rapid and extensive loss of vegetative cover, due to the direct impact of a tropical
cyclone, is a variable that, it is assumed, has significantly affected the pattern, distribution, and
intensity of the UHI effect. Nearly nine years have past since the storm event. Some re-growth
has occurred, and though the City is being rebuilt with great care not to disturb the old cultural
milieu, or genre de vie, some of the slower patterns of urbanization may have changed. Thus, we
have the original formation and the causes and effects of UHI, an increase or change due to a
variable, and a possible decrease depending on the pattern of re-growth of vegetative cover. Even
though researchers are currently studying the ecological effects of hurricane Katrina, and how it
has affected the local human population, no one has focused on the UHI phenomenon and how it
might affect short and long-term plans designed to mitigate natural and human-made hazards.
With regard to urban planning and the re-vitalization of New Orleans, it is a variable that has
been neglected.
When residents returned to New Orleans after hurricane Katrina, they saw thousands of
defoliated, damaged, and destroyed trees, and other distressed vegetative cover. Though it was
October and temperatures were becoming cooler, the weather was drier than usual and the streets
were hot and covered in dust. After several informal surveys, by car, bicycle, and on foot, I
observed what appeared to be a profound environmental change, not just simply because it felt
much hotter in the sun atop a black asphalt street than within a shady grove inside a city park.
These informal observations led to the conclusion that there is a strong relationship between
vegetation abundance, especially shade trees, and temperature. Thus, this study seeks to answer
these fundamental questions regarding the state of the vegetative cover before and after the
hurricane, and how it affected the pattern and intensity of heat distribution throughout the study
1. The loss and re-growth of vegetation after hurricane Katrina altered the UHI.
2. Post-hurricane re-growth of vegetation has occurred in the same locations of significant loss, thus following the historical, pre-established pattern of urbanization.
1.4 Research Objectives
The main focus of this research is analyzing the Hurricane Katrina-induced land cover
change in study area and its impact on the UHI. Changes of surface temperature and vegetation
abundance will be measured by analyzing pre- and post-Katrina satellite imagery in order to
determine whether or not the pattern of UHI was altered as the result of hurricane-induced land
cover changes.Furthermore, this study explores the role of UHI as a dynamic variable of urban
ecosystem function, and therefore why it is an important factor to be considered for urban
environmental management. The main objectives of the study are to examine: 1) the impact of an
extreme weather event on the GNO area UHI; 2) the pattern of vegetative cover of the GNO
area; and 3) the linkage between the pattern and intensity of surface heat with vegetative cover.
The outcome of this study will have implications for subsequent UHI studies and urban planning
in coastal settings.
In addition to understanding the mechanics and processes of the UHI phenomenon, the
results may be of interest to researchers currently addressing topics such as, heat-related
illnesses, air pollution, energy conservation, urban beautification, and the conservation and
creation of urban green spaces. Since UHI can have a direct and indirect impact on these and
other concerns, it should be studied with the same vigor and rigor as other causal factors that
affect human health. For instance, it does not make sense to study heat-related illnesses in a
given urban area without considering the encompassing natural surroundings and climatic
conditions that may cause or be correlated with the problem in some way. Those who are
contribution of sensible heat increase when trying to figure out how to attenuate energy use to
conserve finite resources. The study was conducted with consideration for the City's unique
physical setting, and environmental history, allowing a better understanding of the nature and
2. LITERATURE REVIEW
2.1 Introduction
Urban heat island studies that featured the use of satellite-derived data and remote
sensing methodology for analyzing UHI were reviewed for this investigation. The majority of the
studies addressed technical aspects, such as algorithm testing and a variety of methodologies
used to derive meaning from the data imagery. Within this particular collection of studies, one
can see an evolving relationship between the geophysical perspective and the potential and
practical applications in urban planning, which has been demonstrated by the increased
utilization of remotely sensed data in other fields. For future research, this review could be
expanded to include more examples of applied uses of remotely sensed data in urban planning,
for example, from a social science perspective. There are gaps to be explored within the nexus of
disciplines, but this is beyond the scope of the present study. Nevertheless, a cursory review of
literature from other research domains, such as climatology, urban ecology, and the applied
disciplines of urban planning and environmental management added to the contextual
background for this study and part of its rationale, which is to address a gap in the UHI literature,
and the creation of new knowledge that is prepared for future, practical application. The
emphasis in this review, however, is highly technical and comes from a viewpoint more related
to physical geography and the processes of remote sensing of the environment. The dearth of
UHI data on New Orleans calls for this type of focus at this time.
A significant majority of the journal articles reviewed for this project involved measuring
land surface temperature (LST), the classification of land cover and changes over time,
numerical modeling of heat conduction and atmospheric effects, estimation of surface terrain
Stewart Iain’s (2010) review of the UHI literature published between the years 1950 to 2007
found several problems and inconsistencies in about half of the one hundred and ninety sampled
studies. He found universal weaknesses in definition, measurement, and communication, such as
lack of operational definitions for UHI magnitude or intensity, lack of information regarding
instrument specification or placement height for in situ measurements, insufficient number of
observations, lack of site metadata and local surface features, and description of weather events
would likely have significant impact on the findings. Stewart provided five recommendations for
improving the quality of methods used in UHI research, and a framework for assessing the
outcomes of UHI studies: 1) Reduce the spatial and temporal resolution of the data, 2) Follow
standardized guidelines for site reporting, 3) Disclose the limits of the data, 4) Use terminology
with discretion, and 5) Never accept UHI magnitudes at face value. His formal assessment of this
large body of literature, however, did not include studies that used remotely sensed,
satellite-derived data.
2.2 The Urban Heat Island Phenomenon
The UHI phenomenon occurs in metropolitan areas where the presence of man-made
materials in the built environment, such as asphalt, cement, metals, and other artificial surfaces
causes a higher absorption of solar radiation due to their thermal properties (Aguado 1986; Gulch
et al. 2005; Santana 2007). As cities grow, buildings, roads, and other infrastructure replace open
land and vegetation, causing changes to the landscape, such as the replacement of moist,
permeable surfaces with dry, impermeable ones (EPA 2008). Absorbed heat is re-radiated to the
surroundings in the form of long wavelength thermal radiation causing higher ambient
temperatures at night (Wong and Yu 2005). This creates an “island” of warm air surrounding
Figure 2.1 – EPA depiction of UHI (Based on Voogt 2000).
The UHI effect is more pronounced in winter than in summer, and when the air is still. It
is normally weak during the late morning hours, but becomes more pronounced after sunset due
to the slow release of heat from urban surfaces, whereas in the countryside, nocturnal inversion
occurs as the ground emits longwave radiation into the atmosphere. UHI is reduced under windy,
wet and humid conditions because the nocturnal inversion cannot occur, where the urban and
rural heat budgets are similar (Gedzelman et al. 2003). UHIs are often measured at the local or
mesoscale, from 102 to 104 meters horizontally, which have uniform surface to air temperature
distribution (Stewart and Oke 2010). They can be categorized as three different types according
to methodological approach, instrumentation and data: 1) atmospheric; 2) subsurface; and 3)
surface. For the first type, Oke (1976) identified two layers within UHIs: the urban canopy layer
(UCL), and above it the urban boundary layer (UBL), both of which are generated by different
processes and vary in intensity (Figure 2.2). The UCL is a measure of air temperature at screen
height, one to two meters above ground, which is affected by terrain roughness based on the
Stewart and Oke 2010). Oke (1982) described the factors that contribute to the UHI effect within
these boundaries (Table 2.1).
Figure 2.2 – Components of the urban atmosphere (Oke 1995).
Altered energy balance terms
leading to positive thermal anomaly underlying energy balance changesFeatures of urbanization Canopy layer
Increased absorption of short-wave radiation Canyon geometry - increased surface area and multiple reflection
Increased long-wave radiation from the sky Air pollution - greater absorption and re-emission Decreased long-wave radiation loss Canyon geometry - reduction of sky view factor Anthropogenic heat source Building and traffic heat losses
Increased sensible heat storage Construction materials - increased thermal admittance Decreased evapotranspiration Construction materials - increased ‘waterproofing’ Decreased total turbulent heat transport Canyon geometry - reduction of wind speed
Boundary layer
Increased absorption of short-wave radiation Air pollution - increased aerosol absorption Anthropogenic heat source Chimney and stack heat losses
Increased sensible heat input-entrainment from below Canopy heat island - increased heat flux from canopy layer and roofs
Increased sensible heat input-entrainment from above Heat island, roughness - increased turbulent entrainment Table 2.1 – Factors that contribute to the UHI (Oke 1982).
Measuring a consistent air temperature in the UBL is difficult because it is affected by
windy conditions, which reduces the magnitude of UHI, and the air circulation caused by the
the countryside. Large bodies of water near urban areas can affect the magnitude and extent of
UHI (Streutker 2002), which may require mesoscale measurements to be taken by a more
expansive network of weather stations. To complicate matters further, UHI is also affected by air
pollutants like aerosols, particulate matter, and other Volatile Organic Compounds (VOCs).
VOCs produce ozone gas that develop into smog, which captures outgoing longwave radiation
and re-emits it back to the surface creating a positive feedback loop between UHIs and VOCs
(Shea 1978; Atkinson 2003). Heterogeneous features of terrain type, such as building
morphology, street surface geometry, tree canopy coverage, vegetation type and density, play a
large role in making each UHI profile unique. Though air temperature measurements, e.g.
recorded by fixed hygrometers and mobile infrared thermometers, have high temporal resolution
and can account for processes that occur in three dimensional space in the UCL, they cannot
simultaneously capture the continuous surface of an entire city, at least not without a lot costly
equipment and several people working together over long periods of time. Thus, the third
methodological approach of measuring the surface temperature in two dimensional space was
chosen for this study.
One of the diverse consequences of the Industrial Revolution was the alteration of land
cover in urbanized areas using non-porous materials, e.g. concrete and metal, each with unique
thermal properties, which resulted in an increase in surface heat in comparison to rural
surroundings. In early 1800s, one of the first urban climatologists, the English chemist and
amateur meteorologist Luke Howard, observed that the amount and density of anthropogenic
activities could be correlated to increases in temperature, surface heat, and changes in
atmospheric conditions resulting in the phenomenon known as urban heat island (Myrup 1969).
Cumulus, Stratus, Cirrus, and Nimbus. Volume I of his work entitled, “The Climate of London”
(Howard 1818), is regarded as the first book on urban climatology (Landsberg 1981),
documenting the polluted climate of 19th Century London.
Emilien Renou used a thermometer to measure the warmer air temperature of Paris in
1868, demonstrating a 1 degree Celsius difference. This is one of the first examples of using
quantitative methodology to record the elevation of air temperature in the built environment.
Howard and Renou were observing what is commonly known today as the urban heat island
effect, a manifestation of the effects of urbanization (Sailor 2002). Since Howard’s initial
observations, the process of urbanization had altered land cover to the extent that a temperature
difference between urban and rural areas can now be measured in many populated regions on
Earth, where the average temperatures in urban environments next to large bodies of water tend
to be relatively warmer during the night, and cooler in the day than rural areas at the same
elevation (Streutker 2002).
In the 20th Century, before satellite-based sensors were available, scientists investigated
the effects of the urbanization process on local climates by measuring in situ air temperature and
other climate parameters, sampled at various locations within the research area, or by mounting
weather equipment on a mobile platform (Schmidt 1927; Sundborg 1950; Chandler 1962; Sun et
al. 2009). These early observations were limited to describing, “the response rather than the
forcing of repartitioned surface energy fluxes over urbanized surfaces” (Owen et al. 1998). Since
the advent of multispectral imagery data collected by sensors on board space-based platforms,
UHI research has greatly proliferated, though it has lagged somewhat compared to the
observation of other meteorological phenomena. The ability to more accurately measure certain
resolution. Remote sensing technology has advanced to the point where microclimates can be
measured by using hyperspectral imagery, enabling the detection of minute changes in a small
area, such as the removal of a few trees, building a large parking lot, and macroscale changes due
to the loss of tree canopy for an entire region. Technological advances have also improved the
portability of field equipment for in situ observations.
Whether collected on the ground or from orbital platforms, remotely sensed data can be,
for example, input to a geographical information system (GIS) by climatologists and
meteorologists in order to produce multi-layered maps, including statistical and time-sensitive
data. Amateur weather enthusiasts have also participated in data collection and building their
own models. More recently, scientists of various disciplines like, architects, biologists, engineers,
social scientists and urban planners, are incorporating climate data in their own work. Some have
acknowledged the consequences of the UHI effect on society and the environment. Though the
effect is most pronounced at night and during the winter, anthropogenic heating during the day is
of great interest, especially to urban ecologists and climatologists who are concerned with
maintaining sustainable urban ecosystems and quality of life (Sailor and Fan 2002). The increase
in human population and urbanization coupled with adverse changes in the Earth’s climate, both
immediate and long-term, has prompted scientists and policy makers to address climate change
at global and local levels.
Urban vegetation is one of the variables under investigation for this study because it is a
key component of this UHI model. The remote sensing techniques for measuring, monitoring,
and mapping heat patterns have already been tested in many urban vegetation studies (Ridd
1995; Small 2000; Yuan and Bauer 2007). Several land-use studies provided theoretical and
(Mather 1986; Lo and Fung 1986; Weng and Lu 2009). Ridd (1995) developed the
Vegetation-Impervious surface-Soil (V-I-S) model in order to create a standardized and generalized system
for relating urban features to biophysical and human systems. The model has been tested in
several cities (Ward et al. 2000; Madhaven et al. 2001; Setiawan et al. 2006), and will be utilized
in future research for this study. Weng and Lu (2009), for example, utilized linear spectral
mixture analysis (LSMA) in order to extract the V-I-S components from Landsat imagery. The
results were fitted into urban thematic classes in order to finally demonstrate the effectiveness of
this method for quantifying spatial and temporal changes.
In the past few decades, UHI studies have increased, partly due to the relationship with
other studied climatological phenomena, e.g. local weather events, global climate change, and
natural disasters, but also due to technological developments, like the rapid proliferation of
remote, satellite-based sensors and the computational equipment used to analyze the data
captured by them. Rapid response to disasters and climatic change has been increasingly
important as the human population grows, which relies more and more on advancements in
remote sensing. The continual development of newer, high-resolution instruments, will improve
the capability to identify individual buildings and tree species, for example, providing more
accurate and finer topographic detail for examining the impacts of weather phenomena on urban
systems in microscale climate studies, for example. Ideally, data collected at course and fine
resolutions, both spatial and spectral, can be used in time sensitive models for rapid response
systems, which combine the data in a GIS for comprehensive and timely analysis.
There are several different domains of research that rely upon remotely sensed data and
methods, from studying cosmic dust in space research, to climate monitoring of crop conditions
weather and storm events, the results if which are often quickly communicated to local officials,
the media, and citizens. The data is subsequently archived and later used for long-term analysis.
This study applied remote sensing methods and satellite data imagery to study the local urban
environment, the UHI phenomenon, and its manifestation in the Greater New Orleans Area.
There was large overlap of interests and benefits among the UHI articles reviewed, which
include common areas of inquiry (physical and theoretical), shared data sets, similar statistical
methods, and computer applications.
2.3 Remote Sensing of Urban Heat Islands
For decades scientists have studied the various factors and circumstances that contribute
to the generation and spatial distribution of UHIs, such as air temperature, land surface
temperature (Vidal 1991; Qin and Karnieli 1999; Sobrino et al. 2004), classification of land
cover change (Mas 1999; Foody 2002; Chen et al. 2006), estimation of surface terrain roughness
and albedo (Colby 1991; Voogt and Oke 2003), impervious surface emissivity (Brunsell and
Gillies 2002; Yuan and Bauer 2007; Kalma et al. 2008), tree canopy and evapotranspiration (Oke
1988; Simpson 2002; Liu et al. 2010). Methods for obtaining UHI profiles have ranged from
simple air temperature measurements sampled in situ by hand (Landsberg 1981), to the more
recent studies, which utilized multi-spectral (Owen et al. 1998; Sobrino et al. 2004),
hyper-spectral (Kato and Yamaguchi 2005; Nichol 2005; Sobrino et al. 2006), and thermal imagery
(Rao 1972; Voogt and Grimmond 2000; Schmugge et al. 2002), and the concomitant,
sophisticated computer systems and software used for analysis (Campbell and Wynne 2011).
Studies that utilized remote sensing data and methods often focused on the application of near
infrared (NIR) and thermal infrared (TIR) radiometer imagery (Matson et al. 1978, Carnahan
Remote sensing is the science of acquiring information about the Earth’s surface and
objects without actually being in direct contact with it. Several allied disciplines, such as
computer science, optical and electrical engineering, photography and spectroscopy, satellite
telecommunication, etc. are integrated to produce the necessary technology in creating a
complete remote sensing system. Furthermore, several processes that are the purview of the
physical sciences are what govern the purposes and uses, providing the scientific foundations for
the techniques and methods. According Jensen (2005), remote sensing is a tool or technique
similar to mathematics that utilizes sensors to measure the transmission of electromagnetic (EM)
energy from reflecting and radiating surfaces.
There are two families of sensors used in remote sensing, passive and active. Images
derived from passive sensors represent reflected EM radiation in the visible and the near infrared
regions of the EM spectrum (Fig. 2.3), and active sensors measure the energy emitted by the
surface features in the microwave (thermal infrared) wavelength region.
Active sensors use human-made energy using microwave sensors like synthetic aperture
radar (SAR) that bathe the target with energy, which is then reflected back to the sensor. Passive
sensors work in the daytime when the Sun illuminates surface features, but can also sense
thermal energy in the day or night if the energy is strong enough to be recorded (Jensen 2005).
These instruments are mounted on airplanes and satellites, and more recently unmanned aerial
vehicles (UAV), and used to collect EM energy over wide geographic areas at regular intervals.
Before space-based sensors were available, Bornstein (1968) observed the urban heat
island effect in New York City, analyzing the of differences in the temperature fields of the
atmosphere below 700 m. Data were obtained via meteorological instruments aboard a helicopter
on 42 mornings from July 1964 to December 1966. Once satellite sensors and their digital data
became available, UHI researchers seized upon the opportunity to exploit their advantages. For
example, Matson et al. (1978) analyzed the thermal infrared data from the National Oceanic and
Atmospheric Administration (NOAA) 5 satellite of urbanized areas in the United States. Though
they found a correspondence between the satellite imagery and a US Census map of these areas,
the temperature differences related to different land uses and the presence of water bodies.
Roller and Colwell (1986) used coarse-resolution NOAA satellite imagery for ecological
surveys of large areas, while Roth et al. (1989) used the NOAA Advanced Very High Resolution
Radiometer (AVHRR) satellite sensor to examine UHI intensities in Vancouver, Seattle and Los
Angeles. As the sensors became more sophisticated, with finer geographic and radiometric
resolutions, so did the various, concomitant methods. Medium spatial resolution images from
Landsat and Advanced Spaceborne Thermal Emission and Reflectance Radiometer (ASTER)
have been used in many UHI studies, several of which involved the extraction of Impervious
found that Landsat was better than SPOT data for predicting the percentage ISA at the citywide
level, and performed nearly as well for sub-city level estimates. The latest trend in ISA
estimation and thermal sensing is to fuse data sets of different resolutions and other capabilities,
e.g. SAR or Moderate Resolution Imaging Spectroradiometer (MODIS) data, in order to improve
estimates. Landsat and ASTER data are often combined with in situ measurements in order to
estimate ISA, calibrate the satellite sensors, and validate the results. ISA estimates that used
traditional ground surveys and field measurements are now considered too costly an option, and
labor intensive, especially for large geographical areas of interest (Deng and Wu 2012).
Several factors contribute to generation of UHIs and the surface energy balance (SEB) of
a given area. By comparing the mean and maximum temperature between rural and urban areas
on different time scales, e.g. year by year, month by month, and daily, one can determine the
UHI of an urbanized area (Oke 1988; Magee 1999; Kim and Baik 2005). The net all wave
radiation part of the energy balance represents short and longwave energy within a given area in
which incoming and outgoing radiation is differenced, then measured to determine levels of
attenuation and the causal factors. Oke found that the overall attenuation was negligible, where
the net difference was approximately 5% (Oke 1982, 1988). However, even if this difference is
negligible at the local scale, if all cities on Earth are measured in aggregate, and if the effect is
found to be cumulative, or has a even a slight attenuation effect on the overall energy budget of
the planet, then this very small difference may throw off the balance (Figure 2.4).
While advection may have a role in determining UHIs, its impact is negligible on the
UCL compared to the UBL, which is mostly determined by advective processes (Rotach et al.
2005). This may be particularly true for cities where wind is blocked by natural surface features,
winds do contribute to surface temperature patterns (Voogt and Oke 1998). Anthropogenic heat is
measured by calculating the sum of the heat generated by people, cars, and buildings (Grimmond
1992, Taha 1997; Sailor 2004), which may also include the influence of subsurface heat flux due
to urban the quantity and composition of urbanized surfaces and amount and type of vegetative
cover (Taniguchi et al 2008).
Figure 2.4 – The Earth's annual global mean energy budget. Units are in watts per square meter (W/m2) with up to 10% error for each component. The total heat budget at both the surface and the top of the atmosphere has to balance and all the components add up. 107 + 235 W/m2 outgoing radiation = 342 W/m2 incoming radiation. Kiehl and Trenberth state, “The fact that the components sum to zero means some errors must cancel” (1997).
Based solely on the use of satellite-derived imagery, Streutker (2002) created a UHI
profile of Houston, Texas, using AVHRR Level 1b High Resolution Picture Transmission
(HRPT) data. His study was of interest because Houston, like New Orleans, is located next to
large bodies of water, and resides on the Gulf Coast. There were two main objectives in the
study: 1) quantify the entire urban heat island as a continuously varying surface, measuring the
overall spatial extent of the heat island; and 2) determine whether or not a correlation existed
between the urban/rural temperature difference and the rural temperature. Streutker found that