Open Access
Research article
Phenotypic evolution from genetic polymorphisms in a radial
network architecture
Arnaud Le Rouzic*
1,2, Paul B Siegel
3and Örjan Carlborg
1,4Address: 1Linnaeus Centre for Bioinformatics, Uppsala University, Box 598, SE-75124 Uppsala, Sweden, 2Centre for Ecological and Evolutionary Synthesis, Department of Biology, PO 1066 Blindern, 0316 Oslo, Norway, 3Virginia Polytechnic Institute and State University, Department of Animal and Poultry Sciences, Blacksburg, VA 24061-0306, USA and 4Department of Animal Breeding and Genetics, Swedish University of Agricultural Sciences, Box 7023, SE-750 07 Uppsala, Sweden
Email: Arnaud Le Rouzic* - [email protected]; Paul B Siegel - [email protected]; Örjan Carlborg - [email protected] * Corresponding author
Abstract
Background: The genetic architecture of a quantitative trait influences the phenotypic response to natural or artificial selection. One of the main objectives of genetic mapping studies is to identify the genetic factors underlying complex traits and understand how they contribute to phenotypic expression. Presently, we are good at identifying and locating individual loci with large effects, but there is a void in describing more complex genetic architectures. Although large networks of connected genes have been reported, there is an almost complete lack of information on how polymorphisms in these networks contribute to phenotypic variation and change. To date, most of our understanding comes from theoretical, model-based studies, and it remains difficult to assess how realistic their conclusions are as they lack empirical support.
Results: A previous study provided evidence that nearly half of the difference in eight-week body weight between two divergently selected lines of chickens was a result of four loci organized in a 'radial' network (one central locus interacting with three 'radial' loci that, in turn, only interacted with the central locus). Here, we study the relationship between phenotypic change and genetic polymorphism in this empirically detected network. We use a model-free approach to study, through individual-based simulations, the dynamic properties of this polymorphic and epistatic genetic architecture. The study provides new insights to how epistasis can modify the selection response, buffer and reveal effects of major loci leading to a progressive release of genetic variation. We also illustrate the difficulty of predicting genetic architecture from observed selection response, and discuss mechanisms that might lead to misleading conclusions on underlying genetic architectures from quantitative trait locus (QTL) experiments in selected populations.
Conclusion: Considering both molecular (QTL) and phenotypic (selection response) data, as suggested in this work, provides additional insights into the genetic mechanisms involved in the response to selection. Such dissection of genetic architectures and in-depth studies of their ability to contribute to short- or long-term selection response represents an important step towards a better understanding of the genetic bases of complex traits and, consequently, of the evolutionary properties of populations.
Published: 14 November 2007
BMC Biology 2007, 5:50 doi:10.1186/1741-7007-5-50
Received: 9 May 2007 Accepted: 14 November 2007
This article is available from: http://www.biomedcentral.com/1741-7007/5/50
© 2007 Le Rouzic et al; licensee BioMed Central Ltd.
Background
For decades, evolutionary and quantitative geneticists have suspected that genetic interactions are important for phenotypic evolution. In numerous empirical studies, genetic interactions (epistasis) have implied important contributions to differences among and within species for various quantitative traits, such as plant morphology and growth [1-3], animal behavior and physiology [4-6], metabolism [7] or fitness [8-14] (see [15-18] for reviews). It is now fairly well acknowledged that biological systems rely on complex networks of interacting genes (e.g. [19-21]); however, the extent to which genetic polymorphism in these networks contribute to phenotypic variation remains to be shown.
There is an almost complete lack of insight on mechanis-tic contributions of genemechanis-tic interactions to phenotypic change. Thus, it is important to identify such mechanisms empirically and utilize them as realistic starting points for in-depth theoretical explorations of the importance of genetic architecture on phenotypic evolution. For instance, an expectation from theoretical models is that certain forms of epistatic interactions may promote sus-tained long-term responses to selection, reaching an end-ing point that is much higher than what could be predicted from the observable genetic variation in the ini-tial population (e.g. [22-24]). Recent support for this idea comes from studies [25,26] that reported that strong inter-actions were important in two of the most famous long-term artificial selection experiments: the century long Illi-nois corn selection for oil and protein concentration [27] and the 50-generation body weight selection experiment in the Virginia chicken lines [28].
The availability of high-quality datasets with good esti-mates of the phenotypes corresponding to each genotypic combination of a genetic architecture of interest (geno-type-phenotype map) facilitates explorations of the link between genetic interactions and phenotypic evolution, by providing functional estimates of epistasis independ-ent from allelic frequencies in the population [29,30]. Data from an intercross between the Virginia high and low selected lines used by Carlborg et al [26] provided a unique example of a biological system where strong genetic interactions were involved in the phenotypic change of a quantitative character under strong artificial selection (Figure 1). A network of four interacting loci explained nearly half of the eight-fold body weight differ-ence between the chicken lines, and these data provided direct estimates for the phenotypes corresponding to any genotypic combination among these four loci. In this paper, we use individual-based computer simulations to explore the dynamic properties of this gene network when subjected to divergent phenotypic selection resembling that of the original selection experiment. The results from
the study are used to highlight the impact of radial genetic network architectures on phenotypic evolution and lead to a discussion of the impact of epistasis on the possibility to dissect the genetic architecture of complex traits.
Results
Genetic modeling and network architecture
In traditional statistical genetic models, epistasis describes the multiple locus genetic effects that cannot be explained by additivity and dominance [31]. However, these statisti-cal interaction effects are only valid in the population where they have been estimated. Therefore, they are not useful for inferring unambiguous biological relationships between loci or their potential contribution to the selec-tion response for a populaselec-tion over time. A more useful tool for studying responses to selection from genetic data is the genotype-phenotype map, i.e. a high-quality dataset associating a phenotypic value to each genotype. In this paper we use the dataset from which Carlborg et al [26] observed strong epistasis affecting body weight (see Meth-ods). In the four-locus genotype-phenotype map, alleles inherited from the high line (H) and the low line (L) are combined to form (theoretically) 81 diploid genotypic combinations in the F2 population. The data allowed direct estimation of phenotypic means for 77 of these 81 genotypes.
Further analysis shows that the effect of the central locus of the network (labeled Growth9, according to [26]) is very
Observed response to selection
Figure 1
different from the effects of the three other 'radial' loci (Growth4, Growth6 and Growth12). Figure 2 illustrates how H alleles at the three radial loci increase or decrease the phenotype depending on the genetic background at the central locus Growth9. In homozygous Growth9 HH indi-viduals, H alleles lead to a heavier body weight, while these same H alleles decrease body weight in a Growth9 LL genetic background. Each of the radial loci thus reveals (or buffers) the genetic effect of Growth9. In the studied F2 population with intermediate allelic frequencies at all loci, only part of the maximum effects of the network can be described using marginal additive effects. This explains why Growth9 was the only genome-wide significant quan-titative trait locus (QTL) in a standard analysis [32]: on average, the three radial loci had much smaller additive effects and, hence, could not be detected in a one-dimen-sional QTL analysis.
Genetic network and response to selection
The evolutionary properties of the four-locus genotype-phenotype map were explored using computer simula-tions. Each individual in the simulated population is rep-resented by its genotype and by its phenotype, calculated as the sum of the genotypic value from the genotype-phe-notype map and a random environmental effect (see Methods). Artificial populations were submitted in silico to arbitrary selection pressures, designed to mimic the artificial selection performed in the original selection
experiment to generate the high and low body weight selected chicken lines.
Highly variable response to selection
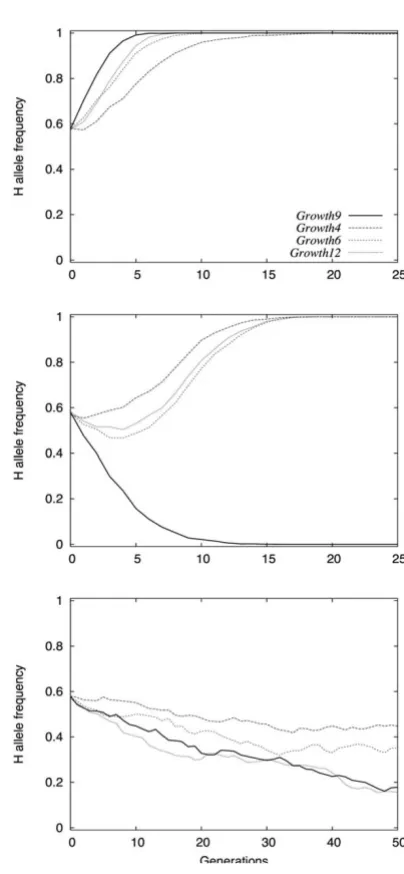
The rate of phenotypic change, as well as the final out-come of the selection process, depends on the initial H-allele frequency f0(H) (Figure 3). As the radial loci display
a similar effect in their interactions with Growth9, they have been assigned the same initial allelic frequency. We found several divergent dynamics, which differ depending on the initial allelic frequencies of the central and/or radial components of the network. An intermediate f0(H)
leads to symmetrical responses during bi-directional selection [33]. Low H frequencies in the radial loci (Figure 3A) correspond to a buffered (canalized) system on which selection is not efficient: the response to selection is very slow, and the system can be trapped in local sub-optimal states. In contrast, decanalization owing to H alleles at the radial loci (Figure 3C) leads to very rapid selection responses. The dynamics that lead to the most symmetric and progressive selection responses occur with intermedi-ate initial frequencies in both central and radial loci (Fig-ure 3B).
Response to directional selection
The dynamics of f(H) were studied for each of the four loci in the network under upward and downward directional selection (Figure 4A and 4B). At any point in the geno-type-phenotype map, the central locus in the network (Growth9) displays the largest individual additive effect with the same sign in all genetic backgrounds. As a result, Growth9 is systematically fixed first, for H and L alleles in the high and low lines, respectively, in all evaluated sce-narios. The effects on the phenotype (either high or low) from the radial loci (Growth4, Growth6 and Growth12) are gradually revealed by increases in Growth9 f(H) and as a result they are fixed after Growth9. Under directional selec-tion, Growth4, Growth6 and Growth12 are fixed for H alle-les in both the high and low lines. This result is rather surprising, given that, by definition, L alleles were called 'L' owing to their origin in the low line.
According to standard quantitative genetics theory, genetic variance consists of additive, dominance and interaction components [34]. The additive genetic vari-ance describes the main resemblvari-ance between parents and offspring and is thus the best predictor of the immediate selection response in a population. Figure 5 shows the dynamics of these genetic variance components in the simulated populations selected for increased phenotypes, illustrating how interaction (epistatic) variance present in the initial population is progressively turned into additive variance. This induction of additive genetic variance sus-tains the selection response much farther than could be expected given the small amount of additive genetic
vari-Effect of the number of H alleles at the radial loci (Growth4,
Growth6, Growth12) depending on the genetic background at
Growth9 (HH or LL)
Figure 2
ation available at the initiation of the selection experi-ment. This clearly illustrates how dependent the amount of additive genetic variance is on the allelic frequencies in a selected population and also shows the advantage of
Dynamics of allelic frequencies under different selection pressures (averages over 10 simulations)
Figure 4
Dynamics of allelic frequencies under different selec-tion pressures (averages over 10 simulaselec-tions). Plain line: central locus (Growth9); dotted lines: radial loci (Growth4, Growth6 and Growth12). Initial frequencies are set to f(H) = 4/7 for all loci, which seems to be one of the most likely situations (see Figure 3). (A) Upwards directional selec-tion; (B) downwards directional selecselec-tion; (C) downwards directional selection including a decrease of the fitness for low-weight individuals, simulating physiological constraints: the normal truncation selection is performed, and then the fitness of low-weight individuals is modified (if the weight is lower than 450 g, then the fitness is 0, and fitness increases linearly between 450 and 550 g; above 550 g, the fitness is maximal and set to 1). In this last situation, the selection intensity has been decreased (40 individuals randomly drawn among the 200 best phenotypes) to avoid too much genetic drift (selection in both sides sometimes lead to much less than 40 fertile adults with the 'standard' selection strength).
Expected dynamics (average over 10 simulations) in high and low lines with different initial H allele frequencies for the central and radial loci
Figure 3
modeling epistatic effects when aiming at addressing the evolutionary properties of genetic architectures.
Stabilizing selection
A general observation in selection experiments for decreased body weight is that the response ceases after a number of generations owing to physiological con-straints. In the Virginia lines, the response in the low line has been small since generation 30 (Figure 1). The result-ing balance between natural and artificial selection resem-bles stabilizing selection with an intermediary optimum. In simulations with stabilizing selection in the low line, we show that this can lead to fixation of the L allele for all four loci in the network (Figure 4C). This illustrates the unconventional manner in which genetic network archi-tectures influence phenotypic evolution and that this could make it difficult to detect such patterns in line-cross experiments between selected lines.
Linear responses to selection
Many empirically observed selection responses where genetic interactions are implied, e.g. the Virginia chicken lines, the Illinois corn lines and others [35], are nearly lin-ear (Figure 1). The expected response to selection from the radial four-locus network is, however, slightly sigmoid (Figure 3). In actual biological systems under selection, the response most likely results from a genetic architecture composed of a mixture of loci with marginal effects of var-ying size as well as loci with interaction effects. To explore how the contribution of other components of a more complex genetic architecture affect selection response, we made simulations where several minor genetic factors were included in addition to the four-locus epistatic net-work. This is a clearly realistic scenario as the four-locus networks contributes to half the selection response in the Virginia lines, and thus other genetic factors need to con-tribute as well. The result is that the selection response is increasingly linearized when the number of additional QTLs increases (see additional file 1: SupFig1). Moreover, because random fluctuations, most likely a result of genetic drift (given the relatively small population sizes generally implied in artificial selection procedures), observed responses from the four-locus network do not systematically exhibit the slightly sigmoid pattern. Simu-lations confirm that even if the average response to selec-tion is not linear, individual realizaselec-tions can range from linear to sigmoidal, with many being too noisy to show a clear pattern (Figure 6).
Discussion and conclusion
QTL-based approach of the population history
Artificial selection experiments generally provide dynamic data, such as heritability, changes in response to selection and estimates of environmental perturbations. Combin-ing these empirical data with the results from a QTL anal-ysis based on an intercross between selected lines is likely to enhance the understanding of the genetic architecture underlying the dynamical properties of the population. Unfortunately, several details of the selection will always remain unknown and thus preclude attempts to directly fit the output of the simulations with the observed selec-tion response.
Explanatory power of detected genetic architectures
Advances in analytical methods for QTL detection has made it possible to unravel gene interaction networks affecting complex traits [15,26]. QTL studies will, how-ever, fail to uncover genetic factors with small individual or interaction effects that segregate in the original lines or that display genetic inheritance patterns that do not con-form to the genetic models used in the analysis (e.g. third-order epistasis or multi-allelic QTLs). Consequently, although the four-locus network detected in the Virginia chickens explains nearly half of the original difference
Dynamics of the variance components
Figure 5
between lines, other factors contributed about 75% of the phenotypic variability among the informative individuals in the F2 population. As illustrated in additional file 1: SupFig1, minor genetic factors of weak effects that cannot be detected (and, therefore, not included in the simula-tions) may modify the expected responses to selection sig-nificantly.
The genotype-phenotype map that is the foundation of our study may itself contain some statistical uncertainties. The estimates of genotypic values are based on a finite-size F2 population and will thus be affected by sampling effects, in particular for the completely homozygous gen-otypes. The sampling could have an impact, in particular, on the selection limit, but less of an effect on the overall dynamics (see additional file 2: SupFig2). Furthermore, as the loci were detected in a QTL experiment, their effect might be overestimated owing to the Beavis effect [36-38]. However, because the major focus in our study was on the dynamic properties of selection on a radial network genetic architecture, the negative impact of overestimated QTL effects should be minor, as these properties will hold
even if the magnitude of the effects of the network was biased.
In a selection experiment, intrinsically random factors, such as genetic drift or environmental noise, are eventu-ally likely to interfere with the theoreticeventu-ally expected selec-tion response. Owing to randomness (genetic drift, sampling errors and perhaps also environmental intergen-eration variation), it appears that the empirically meas-ured phenotype sometimes evolves in the direction opposite to the selection pressure (in the Virginia lines, this happened 17 times over 46 years in the high line, and 12 times over the first 35 generations in the low line). These factors can be accounted for in simulations, and we used an effective population size resembling that used in the production of the Virginia lines, as well as an environ-mental effect based on the amplitude of the non-genetic effects measured in the F2 population. Theoretical results [23,39-42] predict that genetic drift in small or frag-mented populations can have a large impact on the evolu-tion of epistatic characters, and simulated replicates of the same selection pattern evidence the potential impact of genetic drift on the overall shape of the phenotypic evolu-tion (Figure 6).
Benefits of combining QTL and empirical selection data
It is widely acknowledged that the link between the genetic architecture and responses to selection is not direct [35], and that inferences about genetic factors from the output of selection experiments remain largely specu-lative. However, considering both molecular (QTL) and phenotypic (selection response) data, as suggested in this work, provides additional insights into the genetic mech-anisms involved in the response to selection of these lines of chickens, and more generally in long-term sustained selection responses.
The state of the initial population, which remains one of the main unknowns when parameterizing the simula-tions, can also be successfully addressed. We know that the base population of the original selection experiment was formed by the crossing of seven partly inbred chicken lines. There are, however, no empirical estimates of the initial frequencies of the H and L alleles in these lines. We have therefore explored the dynamics in the selection response for a large range of initial states of the base pop-ulation. The results show that the expected dynamics of the network changes dramatically depending on the ini-tial frequencies of alleles, from almost no phenotypic improvement (and a final state far from the theoretical optimal phenotype) to very fast (a few generations) fixa-tion of the best genotype. None of these extreme dynam-ics correspond to the regular response to selection observed empirically during the artificial selection proc-ess, and can therefore be ruled out: the allelic frequencies
Influence of genetic drift on the response to selection
Figure 6
of H and L alleles were probably roughly even in this par-ticular initial population. This also suggests that, in a pol-ymorphic genetic background, no allelic marginal effect seems to be sufficiently high to allow spread (from very low frequency to fixation) in the time scale of the selec-tion experiment. It is thus unlikely that new mutaselec-tions, i.e. alleles that were not present initially, would have had a major impact on the selection response in this particular case, and the initial population was probably already pol-ymorphic for all loci of the network.
Furthermore, theoretical in silico explorations of the reconstructed gene network by submitting it to directional selection facilitates a better understanding of the respec-tive roles of the different components of the genetic archi-tecture. The simulations show that the effects of the major genes in the network were probably rather weak at the beginning of the selection experiment, and that responses during the very early generations were likely to be partly a result of minor genetic factors. In all simulations, the cen-tral locus was the first fixed, and its fixation enhanced the effects of the other loci, which then subsequently contrib-uted to the selection response. Our results therefore sug-gest that the selection response is composed of different stages that lead to the observed linear phenotypic change when they overlap. Dissecting genetic architectures and identifying their ability to contribute in the short or long term to selection response may represent an important step towards a better understanding of the genetic bases of complex traits and, consequently, of the evolutionary properties of populations.
Selection response from genetic networks
Genetic networks can be defined at any interaction level, from molecular to high-level complex phenotypes, such as, in our example, body weight. The evidenced gene net-work has been defined through significant epistatic inter-actions that were detected by a QTL analysis. One cannot deduce whether these four loci correspond to genes that are part of the same metabolic pathway or, on the con-trary, participate in independent high-level functions (e.g. physiology, anatomy, behavior) involved in a complex way in the expression of body weight. In any case, the fact that each of the radial components of the network has a similar effect on the phenotype, both in nature and in amplitude, through similar interactions with a unique central component (as illustrated in Figure 2) remains particularly striking, and strongly supports the hypothesis of the biological meaning of this network.
Although QTL detection experiments are generally not powerful enough to detect networks as large as those deduced from metabolic studies [43], they can confirm that the complexity of a biological system is higher than the sum of its components (individual genes or individual
pairwise interactions). As shown in this paper, an impor-tant difference in the realized response to selection from radial network architectures compared with selection responses from individual loci per se is the dependence on the initial allelic frequencies at other loci to achieve the full genetic potential for phenotypic change. Furthermore, as the effects of the network components are in the same direction, there are likely to reinforce each other and to lead to clearer patterns. For instance, the genetic network described in our study shows positive epistasis (i.e. syner-gistic epistasis) when selected towards heavier body weights, where the effects of the H alleles reinforce each other. Such directional epistasis is known to induce a dif-ferent response to selection than that expected from the traditional additive model (e.g. [44-46]), and the theoret-ical resulting selection curve is a sigmoid (Figure 3), with a slow response in the first generations (changes in allelic frequencies without major consequences on the pheno-type) followed by a 'burst' of additive variance when the favorable genotypic combinations become more fre-quent. It is not clear whether such an effect might have been detected (or even might have a significant effect on the phenotypic change) if only two components (e.g. the central locus and one of the radial factors) would have been involved.
QTL detection of genetic networks
Studying crosses between divergently selected or evolu-tionary distant populations remains a powerful way to infer the genetic architecture underlying selection response to natural or artificial selection (e.g. [47]). One of the strongest assumptions in this approach is that the original populations are fixed for alternative alleles or at least segregating for multiple different alleles. If, however, the same allele is fixed in both populations owing to the underlying genetic architecture, one will fail to detect these loci.
rather lead to the optimal phenotype selected through sta-bilizing selection.
It is often assumed that the part of the genetic variability that cannot be detected in the experiment is a result of numerous minor QTLs, QTLs in a repulsion phase or epistasis. Minor effect QTLs and, to a lesser extent, epista-sis could potentially be detected by increasing the quality of the data (i.e. more genotyped individuals and more markers). Here we indicate a genetic architecture that no line-cross-based QTL experiment, regardless of the accu-racy of the statistical tools or the number of sampled indi-viduals, would be able to evidence as the same allele is fixed in all lines; only the central locus will be found and implied to have a major additive effect. Indeed, if natural selection would have been bypassed in the experiment, then the final fixed genotype would likely have been the same in both high and low lines for Growth4, Growth6 and Growth12 and the conclusion from the QTL experiment would have been that a single QTL, Growth9, was the major factor of the selection response in both lines. Con-sequently, the complexity of the genetic architecture that has contributed to the phenotypic evolution would remain unknown and, furthermore, as the effect of this locus is entirely dependent on its context, this could be a problem in future efforts to clone the underlying gene or use it, for example, in marker-assisted selection.
Methods
Chicken linesFrom a common base population, constituted by a mix-ture of seven partially inbred lines, two chicken lines have been selected for eight-week body weight; one towards high weights (high line, H) and the other towards low weights (low line, L). After 46 generations of artificial selection [33,47,48], the average weight of the high line (1412 g) was about eight times the average weight of the low line (170 g); see Figure 1. The lines were crossed and 795 individuals of the resulting F2 were genotyped for 145
genetic markers. A standard QTL analysis for eight-week body weight in the F2 population revealed only one genome-wide significant QTL located on chromosome 7 (Growth9). Three additional loci, Growth4, Growth6 and Growth12 (located on chromosomes 3, 4 and 20, respec-tively) were evidenced by a pairwise analysis [26], all of these three loci interacting significantly with Growth9. Growth9 emerges as the central point of a radial epistatic genetic network (Figure 1).
F2 population and genotype-phenotype map
A subset of 538 individuals, which were the most geneti-cally informative for the four loci in the genetic network with a large effect on growth [26], were used to design the genotype-phenotype map. In this report we refer to alleles from the low line and the high line as L and H,
respec-tively. There are three possible genotypes (LL, HL or HH) at each locus, with twice as many heterozygous individu-als as homozygous, owing to the F2 design. Among the 34
= 81 possible genotypes, we obtained information (i.e. an estimate of the average phenotype) for 77 genotypes, with between 1 and 38 phenotyped individuals per genotype.
The total phenotypic variance in this dataset is = 2.82 × 10⁴ and the residual variance (i.e. taking into account
both environmental effects and minor genetic factors) is
= 2.13 × 10⁴. The four missing phenotypes were
esti-mated from the mean of the closest genotypes, and simu-lations with different values have been run to confirm the minor impact of these estimates on the general dynamics of the system (see additional file 3: SupFig3).
Simulations
Individual-based computer simulations were performed to explore the dynamics of the four-locus system when submitted to artificial selection. Each individual i was characterized by its genotype gi (i.e. the allelic combina-tion carried at each of the four loci of the network) and by its phenotype Pi. The artificial selection used relied on a truncation process. In each generation, a given number of individuals NS were allowed to reproduce depending on
their phenotype (highest weight individuals in the high line, lowest weight individuals in the low line). For sim-plicity, the sex ratio was considered as even. For each of the NT individuals expected in the following generation (NT/2 males and NT/2 females), two parents (one male and one female) were randomly drawn. Each parent gives a 'gamete' (i.e. a haploid combination of their genotype, loci being considered as genetically independent), and both gametes were merged to constitute the genotype of the new individual i. The phenotype Pi was then com-puted by Pi = Gi + εi, where Gi is the phenotypic value of the genotype gi directly read from the genotype-phenotype map and εi is a random factor following a normal distri-bution N(0, σR), corresponding to environmental effects.
Parameterization
One of the main unknowns of the system is the state of the initial population. The selection experiment, started in 1957, was initiated from a polymorphic population obtained by crossing seven partly inbred chicken lines (inbreeding coefficient around 50%). Unfortunately, no tissue or DNA samples exist from these lines and any ini-tial allelic frequency is potenini-tially realistic for each of the four loci, leading to many possible initial scenarios. How-ever, for simplicity we considered that the polymorphism of the four loci in each of the seven initial inbred lines can be neglected and, thus, allelic frequencies at generation 0 were a multiple of 1/7.
σP2
The simulation of the selection procedure has been slightly simplified compared with the real selection. Pop-ulation sizes have been considered as constant, with NT = 300, while the actual number of individuals fluctuated depending on the environmental and economical condi-tions (between 126 and 428, mean 269 in the high line, and between 83 and 511, mean 309 in the low line). Sim-ulations evidenced that random fluctuations of the popu-lation size have no effect on the overall dynamics (see additional file 4: SupFig4).
The intensity of the selection process was considered as constant in simulations, while it was not the case during the actual selection procedure. During the four first gener-ations, 8 males and 48 females were mated, and the inten-sity of selection has been slightly decreased to 12 males/ 48 females for generations 5 to 25, and 14 males/56 females thereafter. These correspond to effective popula-tion sizes of 27.4, 38.4 and 44.8 individuals, respectively, and we chose to simulate them by a constant NS = 40
par-ents at each generation. Preliminary simulations show that these simplifications only had a minor impact on the system (see additional file 4: SupFig4). Moreover, the actual selection intensity was lower than what can be expected from the proportion of selected individuals. There was concern about the potential loss of genetic diversity and to limit inbreeding: upper limits were placed on family sizes and there was avoidance in mating closely related chickens. This modified and less-stringent trunca-tion selectrunca-tion was simulated by truncating 100 individu-als and drawing the NS = 40 parents randomly among
these 100 individuals.
Finally, the environmental variation was estimated from the F2 population, where the phenotypic variance that could not be explained by the four loci was σR2 = 2.13 ×
104. The value of σ
R has thus been fixed at 146 g and
includes both the environmental variance and the genetic variation that cannot be explained by the identified QTLs.
Authors' contributions
The project was initiated by OC, and all authors partici-pated in the design of simulations, discussion and inter-pretation of results. PBS and OC provided and analyzed phenotypic and molecular data, respectively. AL per-formed and analyzed the simulations. AL and OC wrote the manuscript. All authors provided comments on the manuscript.
Additional material
Acknowledgements
We thank J. M. Álvarez-Castro for his careful reading of the manuscript. The Knut and Alice Wallenberg foundation, the Swedish Research Council for Environment, Agricultural Sciences and Spatial Planning and the Swedish Foundation for Strategic Research are acknowledged for financial support.
References
1. Doebley J, Stec A, Gustus C: Teosinte branched1 and the origin of maize – evidence for epistasis and the evolution of domi-nance. Genetics 1995, 141:333-346.
2. Lukens LN, Doebley J: Epistatic and environmental interactions for quantitative trait loci involved in maize evolution. Genet Res 1999, 74:291-302.
Additional file 1
Effect of the presence of extra low-effect QTLs on the expected dynamics. The average selection response of the network itself is compared with that of the network plus six small-effect independent loci. Increasing the number of small additive QTLs clearly leads to a more linear response that fits better with the experimental data.
Click here for file
[http://www.biomedcentral.com/content/supplementary/1741-7007-5-50-S1.pdf]
Additional file 2
Impact of the sampling effect. The genotype-phenotype map was evaluated from a finite F2 population and the estimates of genotypic values are nec-essarily subject to sampling effects. The most sensitive genotypes are likely to be fully homozygous, because they are less frequent in the F2. Click here for file
[http://www.biomedcentral.com/content/supplementary/1741-7007-5-50-S2.pdf]
Additional file 3
Effect of the missing genotypes estimation on the overall dynamics. The table summaries the four missing genotypes and their estimates following three different methods: taking the average of the population (624 g), esti-mating from the mean of the neighbor genotypes and estiesti-mating from the regressions of Figure 2. The figure presents the resulting dynamics, with the same parameters as Figure 3B. The differences are of the same order of magnitude as the stochastic differences between the repetitions, and the method to estimate the missing genotypes appears to have almost no influ-ence on the results.
Click here for file
[http://www.biomedcentral.com/content/supplementary/1741-7007-5-50-S3.pdf]
Additional file 4
Impact of the simplification of the model. Simulations were simplified compared with the actual selection experiment. One of these simplifica-tions was to consider an even and constant number of males and females selected each generation; the other was to consider that the population size was constant in both lines. Simulations show that the results remain con-sistent when these hypotheses are relaxed.
Click here for file
Publish with BioMed Central and every scientist can read your work free of charge
"BioMed Central will be the most significant development for disseminating the results of biomedical researc h in our lifetime."
Sir Paul Nurse, Cancer Research UK
Your research papers will be:
available free of charge to the entire biomedical community
peer reviewed and published immediately upon acceptance
cited in PubMed and archived on PubMed Central
yours — you keep the copyright
Submit your manuscript here:
http://www.biomedcentral.com/info/publishing_adv.asp
BioMedcentral 3. Kroymann J, Mitchell-Olds T: Epistasis and balanced
polymor-phism influencing complex trait variation. Nature 2005,
435:95-98.
4. Hard JJ, Bradshaw WE, Holzapfel CM: The genetic-basis of pho-toperiodism and its evolutionary divergence among popula-tions of the pitcher-plant mosquito, Wyeomyia smithii. Am Nat
1993, 142:457-473.
5. Lair KP, Bradshaw WE, Holzapfel CM: Evolutionary divergence of the genetic architecture underlying photoperiodism in the pitcher-plant mosquito, Wyeomyia smithii. Genetics 1997,
147:1873-1883.
6. van Swinderen B, Greenspan RJ: Flexibility in a gene network affecting a simple behavior in Drosophila melanogaster. Genet-ics 2005, 169:2151-2163.
7. Clark AG, Wang L: Epistasis in measured genotypes: Dro-sophila P-element insertions. Genetics 1997, 147:157-163. 8. Galloway LF, Fenster CB: Population differentiation in an
annual legume: Local adaptation. Evolution 2000, 54:1173-1181. 9. Fenster CB, Galloway LF: Population differentiation in an annual legume: genetic architecture. Evolution 2000,
54:1157-1172.
10. Carroll SP, Dingle H, Famula TR, Fox CW: Genetic architecture of adaptive differentiation in evolving host races of the soap-berry bug, Jadera haematoloma. Genetica 2001, 112:257-272. 11. Carroll SP, Dingle H, Famula TR: Rapid appearance of epistasis
during adaptive divergence following colonization. Proc R Soc Lond B Biol Sci 2003, 270:S80-S83.
12. Ungerer MC, Linder CR, Rieseberg LH: Effects of genetic back-ground on response to selection in experimental populations of Arabidopsis thaliana. Genetics 2003, 163:277-286.
13. Ungerer MC, Rieseberg LH: Genetic architecture of a selection response in Arabidopsis thaliana. Evolution 2003, 57:2531-2539. 14. Bradshaw WE, Haggerty BP, Holzapfel CM: Epistasis underlying a
fitness trait within a natural population of the pitcher-plant mosquito, Wyeomyia smithii. Genetics 2005, 169:485-488. 15. Carlborg Ö, Haley C: Epistasis: too often neglected in complex
trait studies? Nat Rev Genet 2004, 5:618-625.
16. MacKay TFC: The genetic architecture of quantitative traits: lessons from Drosophila. Curr Opin Genet Dev 2004, 14:253-257. 17. Malmberg RL, Mauricio R: QTL-based evidence for the role of
epistasis in evolution. Genet Res 2005, 86:89-95.
18. Roff DA, Emerson K: Epistasis and dominance: evidence for dif-ferential effects in life-history versus morphological traits.
Evolution 2006, 60:1981-1990.
19. Whitlock MC, Phillips PC, Moore FBG, Tonsor SJ: Multiple fitness peaks and epistasis. Annu Rev Ecol Syst 1995, 26:601-629. 20. Brodie ED: Why evolutionary genetics does not always add
up. In Epistasis and the Evolutionary Process Edited by: Wolf JB, Brodie ED, Wade MJ. Oxford: Oxford University Press; 2000:3-19. 21. Phillips PC, Otto SP, Whitlock MC: Beyond the average: the
evo-lutionary importance of gene interactions and variability of epistatic effects. In Epistasis and the Evolutionary Process Edited by: Wolf JB, Brodie ED, Wade MJ. Oxford: Oxford University Press; 2000:20-40.
22. Cockerham CC, Tachida H: Permanency of response to selec-tion for quantitative characters in finite populaselec-tions. Proc Natl Acad Sci USA 1988, 85:1563-1565.
23. Goodnight CJ: Epistasis and the effect of founder events on the additive genetic variance. Evolution 1988, 42:441-454.
24. Le Rouzic A, Carlborg Ö: Evolutionary potential of hidden genetic variation. Trends Ecol Evol in press.
25. Dudley JW: From means to QTL: why selection for oil and protein is still effective after 100 generations. Proceedings 61st Corn and Sorghum Seed Research Conference: 5–8 December 2006; Chi-cago, IL .
26. Carlborg Ö, Jacobsson L, Ahgren P, Siegel PB, Andersson L: Epistasis and the release of genetic variation during long-term selec-tion. Nat Genet 2006, 38:418-420.
27. Dudley JW, Lambert RJ: 100 generations of selection for oil and protein in corn. Plant Breed Rev 2004, 24:79-110.
28. Siegel PB, Dunnington EA: Selection for growth in chicken. Crit Rev Poult Biol 1987, 1:1-24.
29. Cheverud JM, Routman EJ: Epistasis and its contribution to genetic variance components. Genetics 1995, 139:1455-1461.
30. Álvarez-Castro J, Carlborg Ö: A unified model for functional and statistical epistasis and its application in quantitative trait loci analysis. Genetics 2007, 176:1151-1167.
31. Phillips PC: The language of gene interaction. Genetics 1998,
149:1167-1171.
32. Jacobsson L, Park HB, Wahlberg P, Fredriksson R, Perez-Enciso M, Siegel PB, Andersson L: Many QTLs with minor additive effects are associated with a large difference in growth between two selection lines in chickens. Genet Res 2005, 85:115-125. 33. Dunnington EA, Siegel PB: Long-term divergent selection for
eight-week body weight in White Plymouth Rocks chickens.
Poult Sci 1996, 75:1168-1179.
34. Lynch M, Walsh B: Genetics and Analysis of Quantitative Traits Sunder-land, MA: Sinauer Associates; 1998.
35. Falconer DS, MacKay TFC: Selection: the results of experi-ments. In Introduction to Quantitative Genetics 4th edition. Harlow: Pearson; 1996:208-227.
36. Beavis WD: The power and deceit of QTL experiments: les-sons from comparative QTL studies. In Proceedings of the 49th Annual Corn and Sorghum Industry Research Conference Washington, DC: American Seed Trade Association; 1994:250-266.
37. Beavis WD: QTL analyses: power, precision, and accuracy. In
Molecular Dissection of Complex Traits Edited by: Patterson AH. New York: CRC Press; 1998:145-162.
38. Xu S: Theoretical basis of the Beavis effect. Genetics 2003,
165:2259-2268.
39. Goodnight CJ: On the effect of founder events on epistatic genetic variance. Evolution 1987, 41:80-91.
40. Goodnight CJ: Epistasis and the increase in additive genetic variance: implications for phase I of Wright's shifting balance process. Evolution 1995, 49:502-511.
41. Goodnight CJ: Quantitative trait loci and gene interaction: the quantitative genetics of metapopulations. Heredity 2000,
84:587-598.
42. Hallander J, Waldmann P: The effects of non-additive genetic interactions on selection in multi-locus genetic models.
Heredity 2007, 98:349-359.
43. Proulx SR, Promislow DEL, Phillips PC: Network thinking in ecol-ogy and evolution. Trends Ecol Evol 2005, 20:345-353.
44. Rice SN: The evolution of canalization and the breaking of Von Baer's laws: modeling the evolution of development with epistasis. Evolution 1998, 52:647-656.
45. Rice SN: A general population genetics theory for the evolu-tion if developmental interacevolu-tions. Proc Natl Acad Sci USA 2000,
99:15518-15523.
46. Carter AJR, Hermisson J, Hansen TF: The role of epistatic gene interactions in the response to selection and the evolution of evolvability. Theor Popul Biol 2005, 68:179-196.
47. Siegel PB: Selection for body weight at 8 weeks of age 1. Short term response and heritabilities. Poult Sci 1962, 41:954-962. 48. Liu G, Dunnington EA, Siegel PB: Correlated responses to
long-term divergent selection for 8-week body-weight in chickens – growth, sexual maturity, and egg-production. Poult Sci 1995,