Coding and classifying GP data: the
POLAR project
Christopher Pearce ,1 Adam McLeod,1 Jon Patrick,2 Jason Ferrigi,1 Michael Michael Bainbridge,3 Natalie Rinehart,1 Anna Fragkoudi1
To cite: Pearce C, McLeod A, Patrick J, et al. Coding and classifying GP data: the POLAR project. BMJ Health Care Inform 2019;26:e100009. doi:10.1136/ bmjhci-2019-100009
Received 09 May 2019 Revised 21 October 2019 Accepted 28 October 2019
1Outcome Health, East Burwood,
Victoria, Australia 2Health Language Analytics,
Eveleigh, New South Wales, Australia
3School of Health Information
Sciences, University of Victoria, Victoria, British Columbia, Canada
Correspondence to Dr Christopher Pearce; drchrispearce@ mac. com © Author(s) (or their employer(s)) 2019. Re- use permitted under CC BY- NC. No commercial re- use. See rights and permissions. Published by BMJ.
Summary box
What is already known?
► SNOMED CT is the international standard for coding medical records.
► However, implementation is patchy and poorly used. ► Usability issues remain.
What does this paper add?
► Natural language processing can be used to code diagnoses from free text.
► In doing so, pragmatic choices have to be made that give priority to clinical utility.
AbStrACt
background Data, particularly ‘big’ data are increasingly being used for research in health. Using data from electronic medical records optimally requires coded data, but not all systems produce coded data.
Objective To design a suitable, accurate method for converting large volumes of narrative diagnoses from Australian general practice records to codify them into SNOMED- CT- AU. Such codification will make them clinically useful for aggregation for population health and research purposes.
Method The developed method consisted of using natural language processing to automatically code the texts, followed by a manual process to correct codes and subsequent natural language processing re- computation. These steps were repeated for four iterations until 95% of the records were coded. The coded data were then aggregated into classes considered to be useful for population health analytics.
results Coding the data effectively covered 95% of the corpus. Problems with the use of SNOMED CT- AU were identified and protocols for creating consistent coding were created. These protocols can be used to guide further development of SNOMED CT- AU (SCT). The coded values will be immensely useful for the development of population health analytics for Australia, and the lessons learnt applicable elsewhere.
IntrOduCtIOn
Data, particularly ‘big data’, are being increas-ingly used for research in health.1 2 Currently,
research largely involves developing a protocol before collecting the carefully curated data and then analysing it. However, increasing attention is turning to the poten-tial of interrogating pre- existing large data sets.3 These come with a particular set of
challenges. The data are usually collected for purposes other than research4 and
poten-tially from different sources. Issues such as coding, data quality and completeness must all be addressed and approached with care and maturity of thought.
As a specific subset, the potential power of primary care data has long been identified.5
In many settings, primary care is often synon-ymous with general practice (family prac-tice). Most of the Australian population see a
general practitioner (GP) at least once a year, and can visit as many practices as they wish.6
Hospital databases only contain a limited subset of patient encounters that may be separated by many years.
Therefore, when looking at true popula-tion health issues, pooled general practice data should be a key resource.7 This
multi-plicity relates to how data are used by indi-vidual GPs for direct patient care, compared with how data can be used for other uses such as clinical governance and population health.
General Practice care in Australia is funded by universal, government provided health insurance called Medicare, supported by a publicly funded hospital network through the states. Referrals to private specialists must be made through a GP who acts as a gatekeeper to specialist care.8 Australian general practice
is the primary contact for the population: 90% of the population see a GP each year. GPs are also almost universally computerised, and have been for over 10 years.9 Therefore,
the largest and most comprehensive elec-tronic database of the population sits on the 8000 servers that service these independent GP practices.
This is not just a theoretical exercise. Demonstrating the link between a coding and care has been done in other settings; usually around a specific diagnosis.10 11 These
projects coded to SCT the complete content of GP records from a subset of practices. SCT
copyright.
on September 12, 2020 by guest. Protected by
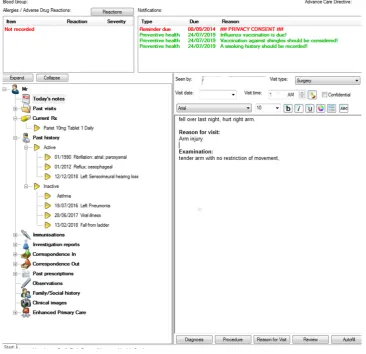
Figure 1 Summary screen.
has been the endorsed and recommended Australian standard for coding in clinical systems since 2005.12 It
is an increasingly global standard with over 39 member countries of the SCT consortium. Despite this, its local adoption remains an ongoing challenge. In Australia, only a small number of implemented systems are mature enough to allow full integration of SCT.13 Australia has its
own extension, SNOMED- CT- AU and its own medicines terminology extension, the Australian Medicines Termi-nology. Hospital systems, for the most part, still use the International Classification of Diseases rather than a clin-ical terminology.
Australian General Practice, also, has a lack of a ‘coding culture’14 (unlike in the UK and USA). The two main
clin-ical systems, for instance, still use their own, proprietary coding terms. There is no published mapping to recom-mended and international standards and each study must perform its own mapping and validation. Also, coding is not in any way enforced. An Australian clinician can (and often does) write free text into the diagnosis, reason for encounter, or indication for prescribing field. There are also no professionally led or large- scale attempts to mini-mise the variability in the way clinicians enter data.
Given the background, this paper outlines an approach to dealing with these issues,15 and how to develop data
suitable for a broad number of uses, not just direct patient care.
MethOd data source
Outcome Health provides Population Level Analysis and Reporting (POLAR) services to Primary Health Networks (PHNs), including for collaborative research in the AURORA Data Space. The current database includes over 6000 contributing providers including GPs, practice nurses and other general practice staff in 600 individual practices. This covers approximately 18 million patient records across the eastern half of Australia. It covers both urban and rural areas. This number will continue to grow with POLAR rolling out into other geographical areas in 2020.
The basic programme (called POLAR GP) provides quality assurance and audit/feedback loops to GPs, to enhance care and improve data quality.15
In order to minimise the identifiability of extracted information, we chose to work on the diagnosis field within the software, rather than attempt to use the full clinical notes. Figure 1 shows a screenshot of a popular GP
copyright.
on September 12, 2020 by guest. Protected by
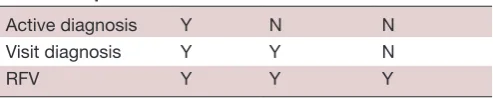
Table 1 Visit problems
Recorded problem Diabetes Viral illness Certification
Active diagnosis Y N N
Visit diagnosis Y Y N
RFV Y Y Y
RFV, reason for visit. software programme (using dummy data). The data we
extracted is on the left—the active and inactive diagnoses. The method for coding that we developed consists of using clinical natural language processing (CNLP) to automatically code the texts, followed by a manual process to correct codes and subsequent CNLP re- computation. These steps were repeated for four iterations until 95% of the records were coded. The coded data were then aggre-gated into classes considered to be useful for population health analytics.
Coding diagnoses
The NLP used in this project is an algorithm that analyses the grammatical structure of a clinical sentence and then tests a variety of phrase formations against the SNOMED CT (SCT) descriptions to both the Fully Specified Name and all its synonyms. For example, the sentence ‘liver core biopsy shows carcinoma’ will be matched to the SCT concept <hepatocellular carcinoma>. The project then used a machine learning programme developed specif-ically for this purpose by Health Language Analytics (JP). The major algorithm building tasks included the following:
► Building a coherent representation of the patient records suited for computing a predictive model. ► Testing a variety of combinations of attributes for the
best results.
► Converting the many attributes available into domain ranges that were relevant to the task.
► Testing many class configurations around 30- day, 90- day, 180- day, 365- day and post-1- year attendances. ► Devising representations of the various time lapses
between the GP visits of patients.
The term diagnosis is differently defined depending on the software system in use. Within widely used Australian clinical systems, each patient has a summary page which may present manually classified ‘important’, ‘active’ and ‘inactive’ diagnoses. Diabetes is both an example of an important and active diagnosis in this classification. A past hip replacement may be labelled as inactive. These summary diagnoses are those used in communications such as referrals and additionally, when the software checks for chronic disease management prompts. Indi-vidual visits may also be variably recorded with data relating to a problem, a diagnosis, a reason for visit (RFV), medicines prescribed, tests ordered or a procedure.16
These diagnoses can be linked to individual consultations and form a problem list within the software.
If a visit is for the ongoing management of diabetes, then diabetes may be recorded as the RFV or a diagnosis, as well as appearing in the active diagnosis list. A diag-nosis of viral illness may appear only as the RFV, as a self- limiting illness does not need to appear in the ongoing diagnosis section. Similarly, an attendance for a driver’s license medical examination with no problem being found would generate no diagnosis but an RFV (see
table 1).
In figure 1 (the clinical front page), the active/inactive
diagnosis is on the left, while the RFV/visit diagnosis is in the visit section.
The use of the data for quality improvement (QI) and clinical governance processes is designed to improve the overall quality of the data, ensuring that viral illness is not recorded in the ongoing diagnosis section, for instance, and encouraging diabetes to be recorded there. Without that, the QI process cannot identify diabetics and the standard of their care.
Our objective was to process and standardise the data with a standard coding system so that it could be manip-ulated and presented at the population level. This was done in two stages, first by an automated process using clinical natural language processing, and then by manual review for quality checking.
reSultS
Preliminary analysis
Initially, approximately 57 000 records were reviewed to identify diagnoses that could be directly mapped to SCT with minimal language transformation17 This produced
a list of approximately 100 common diseases from about 10 000 records. The remaining 47 000 records were anal-ysed in a number of different ways:
SNOMED CT- AU concept codes were allocated and mapped for all records coded in the proprietary host coding system. Any residual text not covered by the SCT codes was separated for later manual checking. This left a number of validation tasks to be completed:
► To check that the concepts identified were a correct representation of the texts.
► To identify the SCT concepts that could cover the residual text.
► To identify the appropriate relations for connecting the identified concepts so as to create valid SCT Expressions.
Secondary analysis
Initially, terminologists with clinical experience were used to read the text and validate the SCT mapping. In this work, they identified errors in coding and developed a richer understanding by selecting the correct relations between concepts. After completing the code mappings their work was reviewed by an expert in coding to SCT and appropriate corrections were made. The corrections were integrated into the original computational entities and process, and the mappings recomputed to add more
copyright.
on September 12, 2020 by guest. Protected by
corrections. The process was repeated four times, that is, until the correction rate became diminishing small.
This resulted in SCT coding of 56 999 individual records. 609 records were deemed un- codable. This was usually because the author had used the free text to write a note not related to a diagnosis (eg, ‘given flowers by Mrs Smith today’). The iterated coding protocol was integrated into the full dataset and used to develop the POLAR programme dashboards and reports for General Practices and PHNs. The un- coded diagnoses were then reviewed by a GP with experience in Health Informatics (CP), who identified which un- coded diagnoses could be allocated to a grouping.
dISCuSSIOn rationale
Other systems have tried various approaches to the problem of coding GP records; in the USA, studies have used a code that is applied to billing. In the UK, coding is embedded in the clinical process. However, the code’s data descriptions do not always represent the breadth of clinical reality. For example, a common coding selection delivers a diagnosis of ‘Depression NOS’, where the term NOS refers to ‘Not Otherwise Specified’. This is not a clinical diagnosis. So rather than try to apply ontologies for common data models, we needed to take the rich-ness of clinical diagnoses and make practical decisions in coding them.
Accuracy issues
We found that the method of deriving the SCT codes and the quality of the output is subject to multiple issues in the original data. Namely:
► Ambiguous use of words and acronyms.
► Spelling errors in the original free- text. Particularly in examples such as: ‘plaque’ miswritten as ‘plague’. ► More than one diagnosis being noted in the
clin-ical system free- text, for example, diabetes/ckd/ hyperlipidaemia/urti.
► Having a diagnosis grouped with treatment, for example, diabetes/care plan rv/doppler.
► Commencement of a treatment, vaccination or medi-cation being recorded as a diagnosis.
► The grammatical choices of the authors. GPs can write the same concept in many different forms. These forms can lead to different SCT expressions of the same concept while both being correct:
a. 49218002 | Hip pain |: 272741003 | Laterality | = 24028007 | Right.
b. 49218002 | Hip pain |: 363698007 | Finding site | = 287579007 | Right hip region structure|.
► References to real world entities and third persons— raising privacy concerns. The GPs often make refer-ences to organisations, geographical locations and other real entities including drug names and people’s names, and referral end points. Generally, these
cannot be codified in SCT and so a generic name is substituted.
► Recording of time. In some records there is a refer-ence to time either as something at a specified past time point (eg, last week) or action for a future time (for 2 weeks) creating a conflict between the date and time the record was created in the clinical system and the date and time implied by the record and needing to be captured as a SCT concept.
► Abbreviated and contracted references. GPs often abbreviate their entries to a minimal content. This leads to misinterpretation of content. For example, ‘pap’ as an abbreviation of ‘pap smear’ can lead to an incorrect identification of ‘pulmonary arterial pressure’.
► ‘suspected’ or ‘provisional’ diagnoses. Working from the list of established diagnoses meant this was not a large issue and were excluded.
relations and expressions in SnOMed-Ct-Au
When a group of entities needs to be described in a statement then they must be written according to the rules of SCT expressions.17 Approximately 80% of the
records needed to be written as multiterm expressions. All expressions are defined as two concepts joined by a relation and cascaded in the same pattern as necessary for the remaining concepts. This has led to the adoption of a number of pragmatic approaches to formulating expressions.
1. If two concepts come from the same SCT axis/hierarchy then they are conjoined by one of the ‘Associated’ rela-tions of: 116676008 | ASSOCIATED MORPHOLOGY|, 363589002 | ASSOCIATED PROCEDURE |, 246090004 | ASSOCIATED FINDING |.
2. If two concepts have no obvious relation then use the general expression ‘47429007 | Associated with |’. Hence, any analysis of the data should not draw on these two relations to make inferences about statistical distributions of clinical significance. There are a num-ber of concepts that were used with some persistence, namely: 363698007 | Finding site |, 272741003 | Lateral-ity |, 246112005 | SeverLateral-ity |.
3. These persistent relations would have been used inap-propriately in very rare occasions and may have some modest level of false negatives. Other relations will be used less consistently.
4. References to referrals, reports, care plans, assessment and like procedures were conjoined |363702006 | has
focus|with a relationship between the primary entity
and the topic of interest.
5. Procedures of all types were related to disease and disor-der entities using the relation: 405816004 | Procedure morphology |, whereas clinical findings were related to abnormal morphology using the relation: 116676008 | ASSOCIATED MORPHOLOGY |. Statistical analysis to accumulate all instances of morphology needs to in-clude both of these relations.
copyright.
on September 12, 2020 by guest. Protected by
SCt expression grammar
The above process necessitated deviation from the stan-dard SCT grammar at a number of points:
► The first case is where the coded clinical conditions are not semantically related to each other but are mentioned in the one Visit note. for example, Wound care, BP & Blood Sugar Level Check. These separate issues are separated using the ‘&’ symbol rather than using the standard relation of ‘Associated finding’, per: 225358003|Wound care|& 75367002 |Blood pressure|& 33747003|Glucose measurement blood|& 225885004 |Health assessment.
► Errors can also occur in the grammar syntax itself as it is quite precise. The symbol ‘:’ has to be use after the first entity in any expression and therefore before the first relation. However, subsequent relations are preceded by the character ‘,’ to show they are attached to the first entity in the expression.
► Entries in the original notes sometimes refer to named entities (hospital, drugs, specialists). We captured this information by expanding the format of the expression grammar by placing the text string in quotation marks and putting it immediately after the entity it refines, for example, 471300007 | On waiting list for organ transplant |‘St Vincent’s Renal Unit’|: 363698007 | Finding site |=64033007 | Kidney structure.
Context
While a purist clinical mapping of the data can be desir-able, the context of the end user also needs to be taken into perspective. There are three distinct audiences for the clinical data: The GP who originally entered the information and would wish to use it to audit patient care needs; The PHN which accesses a de- identified view of the SCT data, and researchers who use the data for specific projects.
At a macro level, an epidemiologist at a PHN, taking the time and effort to group a large number of diagnoses, is performing a deeper dive into the data. For a practi-tioner who just wants to know ‘How many diabetics do I have in my practice’, a simple grouping is required.
Using the diabetes example, there were hundreds of variations of SCT diabetes that were originally mapped, however, with so many variations of SCT diabetes, answering a simple question for a practice can quickly become very complex. Accordingly, in cases such as diabetes, a deliberate strategy was put in place to ‘re- map’ to a list of nine diabetes related terms where possible. This allowed simple searches to be undertaken, but also allowed for granularity of specific areas to be viewed as the original information and how it was mapped was displayed to practices.
next steps
Clinicians are not coders, nor should they be asked to be coders. The process as outlined here is now in place across all of the practices involved. It allows maximum flexibility
for the clinicians to record the diagnosis according to their clinical need, while in part still training them to the benefits of coded diagnoses by demonstrating in the programme as a whole how coded data can improve their practice.12 It emphasises minimal disturbance to
clin-ical workflows. The derived process is not limited to the POLAR programme per se, and could be applied to any list of diagnoses.
COnCluSIOnS
Over ninety- five percent of the corpus of records have now been coded to SCT. The methodology of review and correction of codes prepared by trainees by a coder experienced with SCT followed by iterative re- compu-tation of codes proved to be operationally effective and required four iterations to produce a diminishing small return on improvement of codings. The large size of the coded corpus paves the way for large scale analysis of GP records, promising reliable results in understanding the population health of Australians.15
The process highlighted the potential disconnects between the clinical narrative and the coding world. Text in the diagnosis field of: ‘OA left knee with hemi-arthroplasty’, communicates a wealth of information to a clinician, but combines multiple SNOMED concepts. Our process does not impose a workload cost to the clini-cian to select codes. It takes a pragmatic approach that attempts to serve both the needs of the clinician and the needs of other users. By doing so it increased the utility of the data.
The heart of the POLAR programme is to demon-strate that coded and structured data will improve their ability to deliver care, through clinical governance activities – while at the same time not losing narrative information. Even if SCT were integrated into the Elec-tronic Medical Record—it would not completely cover all activities, at this stage of development. Therefore, some form of automated processing is required, and this study provides a guide on how to do this. The next challenge is to apply this method to other parts of the record—pathology (in train18), and indeed, the corpus of the narrative record.
Good information must be coded, but not with loss of narrative.
twitter Christopher Pearce @ChrisMP
Contributors All authors were involved in the design and implementation of the study. All authors contributed to the writing of the article.
Funding This research was funded by the HCF Research Foundation, and we gratefully acknowledge their support.
Competing interests CP, AM, NR, JF and AF are the employees of Outcome health, the not for profit organisation that performed this study. JP is an employee of HLA analytics that provided the machine learning tool.
Patient consent for publication All practices, as part of their Australian accreditation must have a process in place to inform patients of their use of data (for research and population health). Individual practices must also consent to their data being used in the POLAR programme.
copyright.
on September 12, 2020 by guest. Protected by
ethics approval Outcome health has ethical approval for the collection and storage of the information. Further ethics approval is required for research. Ethical approval for this project was granted by Monash University and Eastern Health. Provenance and peer review Not commissioned; externally peer reviewed. data availability statement Data are available upon reasonable request. Open access This is an open access article distributed in accordance with the Creative Commons Attribution Non Commercial (CC BY- NC 4.0) license, which permits others to distribute, remix, adapt, build upon this work non- commercially, and license their derivative works on different terms, provided the original work is properly cited, appropriate credit is given, any changes made indicated, and the use is non- commercial. See: http:// creativecommons. org/ licenses/ by- nc/ 4. 0/.
OrCId id
Christopher Pearce http:// orcid. org/ 0000- 0001- 5371- 8196
reFerenCeS
1 Andreu- Perez J, Poon CCY, Merrifield RD, et al. Big data for health.
IEEE J Biomed Health Inform 2015;19:1193–208.
2 Bainbridge M. Big Data Challenges for Clinical and Precsion Medicine. In: Househ M, Kushniruk A, Borycki E, eds. Big data, big challenges: a healthcare perspective. Switzerland: Springer, 2019: 17–32.
3 Goetz T. Sergey brin's search for a Parkinsons cure. Wired, 2010. 4 de Lusignan S, Mimnagh C. Breaking the first law of informatics: the
quality and outcomes framework (QOF) in the DOCK. Inform Prim Care 2006;14:153–6.
5 de Lusignan S, van Weel C. The use of routinely collected computer data for research in primary care: opportunities and challenges. Fam Pract 2006;23:253–63.
6 Australia Deptartment of Health and Ageing. General practice in Australia: 2004. 1st edn. Canberra: Commonwealth of Australia, 2005: xix. 651.
7 Pearce C, Shearer M, Gardner K, et al. A division's worth of data.
Aust Fam Physician 2011;40:167–70.
8 Duckett SJ. The Australian health care system. 3rd edn. South Melbourne, Vic: Oxford University Press, 2007: xxi. 370.
9 Pearce C. The adoption of computers by Australian general practice – a complex adaptive systems analysis. J Gen Pract 2013;1:1–3. 10 Lougheed MD, Thomas NJ, Wasilewski NV, et al. Use of SNOMED
CT® and LOINC® to standardize terminology for primary care asthma electronic health records. J Asthma 2018;55:629–39. 11 Mukherjee M, Wyatt JC, Simpson CR, et al. Usage of allergy codes
in primary care electronic health records: a national evaluation in Scotland. Allergy 2016;71:1594–602.
12 Australian Commision on Safety and Quality in Health Care. Ninth my health record and national digital health infrastructure clinical safety review, summary report. Sydney: Australian Commision on Safety and Quality in Health Care, 2018.
13 Pearce CM, de Lusignan S, Phillips C, et al. The computerized medical record as a tool for clinical governance in Australian primary care. Interact J Med Res 2013;2:e26.
14 Springate DA, Kontopantelis E, Ashcroft DM, et al. ClinicalCodes: an online clinical codes Repository to improve the validity and reproducibility of research using electronic medical records. PLoS One 2014;9:e99825.
15 Pearce C, McLeod A, Rinehart N, et al. What a comprehensive, integrated data strategy looks like: the population level analysis and reporting (polar) program. Stud Health Technol Inform. In Press 2019;264:303–7.
16 Pearce C, Arnold M, Phillips CB, et al. The many faces of the computer: an analysis of clinical software in the primary care consultation. Int J Med Inform 2012;81:475–84.
17 IHTSDO. SNOMED CT expressions - SNOMED CT starter guide - SNOMED confluence. Available: https:// confluence. ihtsdotools. org/ display/ DOCSTART/ 7.+ SNOMED+ CT+ Expressions
18 Sezgin G, Georgiou A, Hardie R- A, et al. Compliance with pathology testing guidelines in Australian general practice: protocol for a secondary analysis of electronic health record data. BMJ Open
2018;8:e024223.
copyright.
on September 12, 2020 by guest. Protected by