AN IMPROVED PROCEDURE FOR FOURIER REGRESSION ANALYSIS
Abass Taiwo, Timothy Olatayo
Olabisi Onabanjo University - Nigeria, Department of Mathematical Science
Corresponding Author: Abass Taiwo, taiwo.abass@oouagoiwoye.edu.ng
ABSTRACT: Fourier regression is a method used to
represent time series by a set of elementary functions called basis. This work was used to propose a new procedure for Fourier regression which has the ability to reveal the period of significant frequencies and can be used to fit a periodic trend. The procedure involved the use of spectral analysis for component identification, discrete Fourier transform for estimating the coefficients and 95% confidence bound of the autocorrelation function for residual diagnostic check. The method was applied to Nigerian road accidental death time series data in order to test the efficiency. From the results, the spectral analysis magnitude plot revealed one and three components Fourier regression model. The periodic trend of one and three components Fourier regression model was fitted. The three components Fourier regression model was the most suitable and appropriate model since it has a close pattern to the original series and as well revealed the cyclical movement in Nigerian road accidental death. This was validated based on the three components residual autocorrelation function values which fell within the 95% confidence bound and this indicated the residuals are whiten. In conclusion, the proposed procedure for Fourier regression model was adequate for studying the important periodicities and their frequencies, fitting periodic trend and suitable for forecasting Nigerian road accidental death time series data.
KEYWORDS: Fourier regression, Spectral density
function, Periodic time series, Autocorrelation function and Road accidental death.
1. INTRODUCTION
The traditional method usually used to analysis and discuss time series data has been Autoregressive moving average model ([BJ70]). It has been extensively used in modeling linear time series and when the series is stationary after differencing, Autoregressive integrated moving average (ARIMA) model is considered. The ARIMA models assume that the present observation depends on weighted previous observations, weighted previous random shocks and present shock ([Wei06]). However, in recent time, most time series data are becoming non-linear due to nature and man-made variations ([Tai17]). The series are rather assuming periodic or seasonal variations. A Seasonal time series contain a seasonal phenomenon that repeats itself after a regular period of time. Such phenomena stem from factors such as weather which affects many business and
2. MATERIALS AND METHODS
2.1. Fourier Regression Analysis
A Fourier Regression Analysis is defined as
(1)
where µ is the overall mean, is the length of the time series, is the number of frequency components to be included and is a white noise sequence of independent and identically-distributed Gaussian random variables with zero mean and some variance. The additive noise term accounts for the randomness inherent in the data. The parameters of the model are the overall mean and the amplitudes of the cosines and sines.
2.2. Component Identification in Fourier Regression Analysis
The number of components to be included in the model will be identify using the magnitude plot obtained from the plot of spectral density function and its frequencies. The maximum and number of sinusoids will be used to choose the number of components. The Spectral density function is given as
(2)
where is the Autocorrelation function at lag
2.3. Estimation Method
The coefficients of the Fourier regression Analysis will be obtained using the inverse of the discrete Fourier transform. Since equation (1) is linear in parameters and
(3)
is a discrete Fourier transform. The frequencies to be used will be specified for the cosines and sines, a matrix design is formed and the matrix will be solved to obtain the parameters using inverse discrete Fourier transform given below
(4)
2.4 Diagnostic Test for the Error Term
The stability of the residual or error term will be checked using the upper and lower bounds of the
Residual Autocorrelation function plot. The Autocorrelation function is given as
(5)
where
3. RESULT AND DISCUSSION
In other to determine the efficiency of the proposed procedures for Fourier regression Analysis. Nigerian road accidental death time series data will be analysed to reveal which frequencies contributed significantly to the variability in the data. Fitted periodic trend will be obtained as well and this will be used to explain the cyclical pattern of Nigerian road accidental death time series data. A visual inspection of Nigerian yearly road accidental death time plot in Figure 1 from 2010 to 2016 indicated that number of accidental deaths varies in a periodic manner. The period of the oscillation appears to be roughly 1 year (12 months). The periodic nature of the data suggests that an appropriate model may be a one component Fourier regression analysis given as
(6)
where Based on Figure 2, the frequency of 1 cycle/12 months is the most significant oscillation in the data. The magnitude at 1 cycle/12 months is more than twice as large as any other magnitude. However, the magnitude plot revealed that there are also other periodic Based on Figure 2, the frequency of 1 cycle/12
months is the most significant oscillation in the data. The magnitude at 1 cycle/12 months is more than twice as large as any other magnitude. However, the magnitude plot revealed that there are also other periodic components in the data. These were periodic components at harmonics (integer multiples) of 1 cycle/12 months and periodic component with a period of 1 cycle/72 months. Hence a three components Fourier Regression analysis will be fitted, if the one component model failed to describe the cyclical movement in Nigerian Road accidental death.
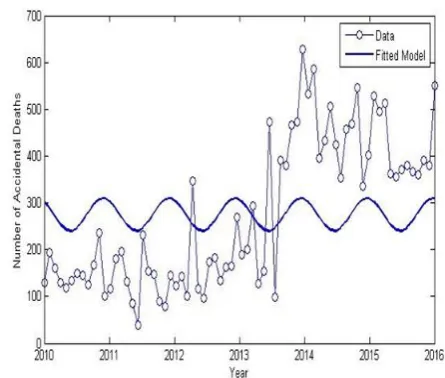
One Component Fourier Regression Analysis model was fitted using the model in equation (6), the discrete Fourier transform was inverted and overall mean was added to obtain the model as
(7)
3, the periodic movement of the fitted model deviated from the original data. This implied equation (7) is not adequate for analysing the cyclical movement in Nigerian road accidental death and a further analysis is required. The residual autocorrelation function values in Figure 4 fall outside the 95% confidence bounds at a number of lags. It does not appear that the residuals were white noise. The conclusion is that the frequency domain linear model with one sinusoidal component does not account for all the oscillations in the number of road accidental deaths. This is expected because the spectral analysis revealed additional periodic components in addition to the dominant oscillation. Hence fitting three components will be necessary has suggested based on the magnitude plot in Figure (2).
Figure1. Time Plot of Nigerian Monthly Road Accidental Death from 2010 to 2015
Figure 2. Magnitude Plot of the Spectral Analysis of Nigerian Monthly Road Accidental Death
from 2010 to 2015
Figure 3. Original and Fitted Nigerian Monthly Road Accidental Death using One component
Fourier regression Analysis
Figure 4. Autocorrelation Plot of the Residual of the Fitted One component Fourier Regression
Analysis
Three components model that incorporated additional periodic terms as indicated by the spectral analysis was fitted. The fitted three components Fourier regression analysis model is
(8)
autocorrelation function of the residuals in Figure 6 and this indicated that residual autocorrelation function values fall within the 95% confidence bounds at all lags. It appears that the residuals were white noise and the three components Fourier Regression model with three sinusoidal components accounted for all the oscillations and cyclical movement in the number of road accidental deaths in Nigeria. Hence, the periodic trend of Nigeria road accidental death is properly fitted with the three components Fourier regression analysis.
Figure 5. Original and Fitted Nigerian Monthly Road Accidental Death using Three components Fourier
Regression Analysis
Figure 6. Autocorrelation Plot of the Residual of the Fitted Three components Fourier Regression Analysis
CONCLUSION
This research work was used to propose a new procedure for Fourier regression analysis which has the ability to reveal the period of significant frequencies and can be used to fit a periodic trend. The procedure involved component identification, estimation method and diagnostic checking. Nigerian road accidental death time series data from 2010 to 2015 was analysed in order to test the efficiency of the model. From the results, the spectral analysis magnitude plot revealed a single and three components Fourier regression model. The inverse discrete Fourier transform estimation method was used to obtain the coefficient. The periodic trend of one and three components Fourier regression model was fitted. Three components Fourier regression model was the most suitable and appropriate model since it has a close pattern to the original series and as well revealed the cyclical movement in Nigerian road accidental death. This was validated based on the three components residual autocorrelation function values which fell within the 95% confidence bound and this indicated the residuals are whiten. In conclusion, the proposed procedure for Fourier regression analysis was adequate for studying the important periodicities and their frequencies, fitting periodic trend for Nigerian road accidental data. It is suitable for forecasting Nigerian road accidental time series data since the residual of the model are whiten.
REFERENCES
[Ade10] J. O. Adejuwon - A Spectral analysis of Rainfall in Edo and Delta State
(Formely Mid-Western Region),
International Journal of Climatology, 2365-2370, 2010.
[Bli58] C. I. Bliss - Period Regression in
Biology and Climatology, New Haven:
The Connecticut Agriculture Experiment Station, 345-355, 1958.
[Blo00] P. Bloomfield - Fourier Analysis of
Time Series, An Introduction, Raleigh:
Wiley Series, 230-250, 2000.
[BJ70] G. E. P. Box, G. M. Jenkins - Time
Series Analysis; forecasting and
control, Holden Day, San Francisco,
California, 125-135, 1970.
Forecasting and Control, 4th ed. John Willey & Sons, 238-262, 2008.
[GM10] A. T. Gurudeo, I. Mahbub - Time
series analysis of Rainfall and
Temperature in Kewkun in Coastal
Catchments, Journal of Mathematics
and Statistics, Vol. 6, 372-390, 2010.
[HVP15] O. Hodger, B. Viatcheslav, S. Petar -
T-Optimal Discriminating design for
Fourier Regression model,
Computational Statistics and Data Analysis, Elsevier, 1-17, 2015.
[Ism09] S. O. Ismaila - Statistical Procedure for analysing road accident data in
Nigeria, Proceedings of 22nd AGM and
International conference of Nigerian Institute of Mechanical Engineers, Osogbo, Nigeria, 182-184, 2009.
[Nic06] J. C. Nicholas - In Praise of
Trigonometric Predictors. The Stata
Journal, Vol. 6, 561-579, 2006.
[Olu93] A. J. Oluwasanmi - Accident Analysis
and prevention. Elsevier, Vol. 25,
485-487, 1993.
[RPD98] J. O. Rawlings, S. G. Pantula, D. A. Dickey - Applied Regression Analysis,
A Research Tool, 2nd ed. Springer,
Verlag, New York, 235-250, 1998.
[Tai17] A. I. Taiwo - Spectral and Fourier Parameter Estimation of Periodic
Autocorrelated Time Series Data, Ph.D.
Thesis Dissertation. Olabisi Onabanjo University, Ago-Iwoye, Nigeria, 2017.
[Uko14] V. N. Ukoji - Trends and Patterns of fatal road Accidents in Nigeria
(2006-2014), IFRA – Nigeria Working papers
series, No. 35, 2014.
[Wei06] W. W. S Wei - Time Series Analysis
Univariate and Multivariate Methods,
2nd ed. Addison Welsley: Pearson Press, 237-258, 2006.
[Wol74] H. O. A. Wold - A Study in the
Analysis of Stationary Time series.