Multivariate analyses of selected mechanical properties of dry bean grain
Hakan KibarDepartment of Seed Science and Technology, Faculty of Agriculture and Natural Sciences, Abant Izzet Baysal University, Bolu, Turkey
Received September 3, 2014; accepted January 3, 2015
Corresponding author e-mail: [email protected]
A b s t r a c t. The direct shear test are widely used to measure the bulk material properties for economical design of bulk han-dling equipment and to estimate wall pressure inside storage structures, namely their bulk density, the angle of internal friction, shear strength, Poisson ratio, and lateral pressure ratios are required. Tests were conducted at thirty six different shear speeds (between 0.30-1.00 mm min-1) and three different normal stresses were applied (60, 120 and 180 kPa). The angle of internal friction, Poisson ratio, and lateral pressure ratios demonstrated fluctua-tions depending on the shear speeds. The results of the principal component analysis indicated that the first three principal com-ponents accounted for 97.40% of the total variability among the thirty six different shear speeds for all the traits investigated. The first principal component was the most important. In the result of principal component analysis, the shear speeds were divided into seven clusters. The pressures were decreased and increased with the change of the angle of internal friction and the lateral pressure ratio. The data obtained from the study will be useful in the struc-tural design of dry bean bins to calculate loads on bins from the stored material and grain handling equipment.
K e y w o r d s: dry bean, direct shear test, the angle of internal friction, principal component analysis, cluster analysis
INTRODUCTION
Dry bean is one of the oldest cultivated grains in the world. Low-cost dry beans contain vitamins, minerals, so-
luble dietary fiber, and protein. A serving of dry beans is
rich in B-vitamins, iron, calcium, potassium, phosphorous but is low in sodium and calories. Dry beans also contain high levels of complex carbohydrates with a low to mo- derate glycemic index. Carbohydrates with a low glyce-mic index such as the ones that are found in dry beans are
able to provide energy over a long period of time by being slowly released into the bloodstream to provide sustained energy levels (USDA, 2012).
Some of the mechanical properties are becoming in- reasingly important for improvement of the design of stora- ge structures and conveyance facilities of dry bean mate-rials in modern agriculture. These mechanical properties have been studied with the direct shear test for various agri- cultural materials which by many researchers such as Molenda et al. (2001) for wheat, corn meal, and soybean meal, Zou and Brusewitz (2001) for marigold, and Moya
et al. (2002a) for barley, corn, oat, sunflower, lentil vetch,
and wheat. Agricultural enterprises have increased in size and have incorporated mechanized feeding systems which require reliable grain handling equipment. Improved farm- ing techniques and marketing considerations have contribu- ted to the increased demand for more economical approach-es to dry bean storage. Storage of dry beans whose supply
or demand fluctuates in a predictable manner, especially
seasonal produce, is necessary to increase availability. It is essential that processors maintain stocks of dry beans; therefore, storage is necessary to buffer demand. The quan-tities of dry beans held in store and the times of storage vary widely for different cases, depending on the above considerations. The primary objective is to maintain the best possible quality during storage, and hence avoid spoil-age during the storspoil-age period. Dry beans are commonly stored in vertical structures, in particular in reinforced con-crete silos and in steel bins. An economical layout of the various silos and bins is essential. The foremost advantage
of vertical storage is the efficient discharge of the dry bean
by gravity flow. Steel bins have gained popularity rather
recently. In addition to their advantages over concrete silos with respect to initial costs and erection time, steel bins are more easily accessible through manholes and are more
easily fitted with aeration equipment and
temperature-mea-suring instrumentation.
Knowledge of real moisture distribution of dry bean and components at harvest is an essential requirement
for designing efficient processing operations and obtain -ing desired high quality products. The moisture content of
beans has an influence on their mechanical properties and
wall pressure as well as the dry bean quality.
The direct shear testing is a standard testing method employed for estimation of grain shear strength parameters. The direct shear test is widely used to measure the agricul-tural material properties for the design of storage structures, processing equipment, and machines (Härtl and Ooi, 2008). The direct shear cell can be used according to ASTM standards D3080-90 and D6128-97 (ASTM 2000a, b) to obtain a yield locus with fairly reproducible results (Zou and Brusewitz, 2001).
The angle of internal friction is a measure of the force required to cause particles to move or slide on each other. Stable slopes and hang-ups in bins are highly dependent
on the angle of internal friction. Internal friction is influ -enced by many parameters such as particle surface friction, shape and hardness, size, and size distribution. It is needed for calculating the lateral pressure on the walls of storage
silos and in the design of gravity flow in bins and hoppers
(Ganesan et al., 2005).
The application of numerical methods to silo design has made possible a better understanding of the behaviour of stored material inside silos. The complexity of the cases studied with this technique has increased because tech-nological improvements have made more powerful tools available. With these methods, it is possible to consider some new material properties, such as the angle of internal friction, Poisson ratio, and the modulus of elasticity in the analysis (Moya et al., 2006).
The objective of this research was to determine the angle of internal friction, Poisson ratio, lateral pressure ratio, and silo wall pressures at different shear speeds of dry bean grain for design of storage structures as well as peel- ing and processing equipment. Another objective of the study, the structure of variability in different shear speeds using multivariate statistical analyses (principle component analysis, cluster analysis) was to determine. These para- meters can be used in silo modelling and processing
equip-ment using the finite eleequip-ment method in order to better
understand the interaction that exists between the grain and the storage structure.
MATERIAL AND METHODS
The experiments were carried out with the Zülbiye variety that is widely cultivated in the Black Sea region of Turkey during the 2010-2011 harvest periods. The dry bean variety (cv. Zülbiye) was provided by the Black Sea
Agricultural Research Institute in Samsun, Turkey. Firstly, the dry beans brought to the laboratory were manually cleaned to remove all foreign matter such as dust, dirt, stones, and chaff as well as immature, broken seeds. To determine the average size of the dry bean, a sample of 100 dry beans was randomly selected. In this study, 100 seeds were measured. The length (L), width (W), and thickness (T) were measured using a digital caliper read-ing to ± 0.01 mm accuracy. The initial moisture content of dry bean after harvest was determined by oven drying at 80±5°C for 24 h (AOAC, 1984). In order to cool the
dry beans, the dried samples were transferred into a de- siccator. The samples were dried under these conditions to reach constant dry weight. The dry bean grains were left for natural drying in the laboratory to decrease the desired moisture level. After natural drying, the dry bean was kept in closed plastic bags and stored in a refrigerator at 4°C until further use. The dry bean grains were kept in the refrigerator for about 15 days. They were prepared for tests by keeping them under controlled laboratory conditions for at least 24 h prior to tests. The temperature of 23±2°C and relative humidity of 65-75% were maintained as the main environmental parameters.
A normal load was applied to the specimens and the specimens were sheared across the pre-determined hori-zontal plane between the two halves of the shear box. Measurements of shear load, shear displacement, and nor-mal displacement were recorded. The test was repeated for two or more identical specimens under different normal loads. A shear test was conducted to determine the angle of internal friction (φ) and cohesion of a sample using a di- rect shear cell installed in a universal testing machine. The testing system consisted of a direct shear cell (standard in soil testing), including dead weight as normal load, and the universal testing machine (Zou and Brusewitz, 2001). The tests were conducted at thirty six different speeds (between 0.30-1.00 mm min-1) and three different normal stresses
were applied (60, 120, and 180 kPa, respectively). Their descriptions are presented in Table 1.Each test was
repli-cated five times (measure 1, 2, 3, 4, and 5) depending on
the type of the test.
T a b l e 1. Angles of internal friction and their description in the different shear speed (SS)
The strength of grain depends of its resistance to shear-ing stresses. It is basically made up of two components:
-frictional – due to friction between individual particles, -cohesive – due to adhesion between the grain particles.
The two components are combined in Coulomb shear strength equation:
, tanϕ σ τf =c+ f
(1) where: τf – shearing stress of grain at failure, c – apparent cohesion of grain, σf – total normal stress on failure plane,
φ – angle of internal friction (angle of shearing resistance of grain).
Poisson ratio (ν) was calculated with Eq. (2) developed
as a function of the angle of internal friction by Qu et al. (2001): . sin 2 sin 1 ϕ ϕ ν − −
= (2)
A number of equations relating the lateral pressure ratio (k)to the angle of internal friction (φ) have been proposed. The stress ratio can be also derived from the theory of elas-ticity as a function of Poisson ratio. Theoratical equalities relating to the issue are given in Eqs (3-5). These equalities:
, 1 ν ν − = k (3)
Jaky (1948) (according to Lohnes, 1993) derived a rela-tionship for the at-rest state of stress:
. sin 1 ) sin 3 2 1 ( ) sin 1 ( ϕ ϕ ϕ + + − = k (4)
Equation (5) was modified and recommended by
Euro-code 1 (2006) as:
,) sin 1 ( 1 .
1 −
ϕ
= k
(5) where: k – lateral pressure ratio, φ – angle of internal fric-tion, degrees.
In the study, the basic properties of the wall mate-rial were taken from the Eurocode 3 standard (2004). The
steel cylindrical silo (flat bottom) created as a theoretical
model in this study had height 10.0 m, diameter 5.0 m and thickness 4 mm. The wall of the silo was assumed to be
made of flat steel. S235 steel was used as steel material
(Eurocode 3, 2004). In this study, values concerning dry bean
(γ: 8.20 kN m-3, μ: 0.331) were used to calculate wall pres
-sures. The lateral pressure ratios on the wall of the silo were calculated according to Eurocode 1. The steel wall was considered to be isotropic depending on the mechanical properties of the wall (E: 2.1x10⁸ kPa, ν: 0.3, γ
a: 80 kN m-3
and fyi: 188 000 kPa). The storage capacity of the dry bean silo according to this geometry is 160 t.
The vertical pressure acting on a flat bottom (inclina -tion a≤5°) may be taken as uniform (Eurocode 1, 2006). The vertical pressure should be determined acting on a flat
bottom. The most comprehensive design standard for these
loads is the new Eurocode 1, which defines different classes
of the silo by the size, aspect ratio, wall roughness, and construction material and requires a range of properties to be considered for the stored solids and several different loading conditions to be examined in design calculations. In storage design, physical parameters play a role on the structure side as well as on the load side. These parameters are always subjected to some variations.
The vertical pressure acting on a flat bottom during dis -charge should be taken as identical to the vertical pressure
at the end of filling (Eurocode 1, 2006). The vertical pres
-sure acting on a flat bottom should be determined as:
( )
Y( )
z,k P z
Pvft = ho j (6)
in which:
( )
Y( )
z ,k P z
Pvft = ho j (7)
,
o o
h kz
P =γ (8)
, U k
A zo =
µ
(9)
where: A – plan cross-sectional area of vertical walled seg-ment (m2), P
ho – asymptotic horizontal pressure at great
depth due to stored particulate solid (kPa), Pvft – vertical
pressure solid after filling (kPa), U – internal perimeter of the plan cross-section of the vertical walled segment (m),
Yj – Janssen pressure depth variation function, z – depth below the equivalent surface of the solid in the full condi-tion (m), zo – Janssen characteristic depth (m), a – mean angle of inclination of wall measured from the horizontal,
degree, γ – characteristic value of the bulk unit weight of
solid (kN m-3), μ – characteristic value of the coefficient of
wall friction for a vertical wall.
The Duncan multiple range and cluster and principal component analysis (PCA) statistical analyses were used for various parameters at different shear speeds and these data were statistically analyzed using SPSS and Minitab. Cluster analyses were performed to determine which angles of internal friction were similar and dissimilar to categorize them according to different shear speed. The hierarchical (linkage) method can be chosen from the Cluster analy-ses. To start with, requested complete linkage clustering by selecting the furthest neighbour (the furthest neighbour is a synonym for complete linkage). In addition, PCA was applied to investigate the factor structure of these thirty six different speeds.
RESULTS AND DISCUSSION
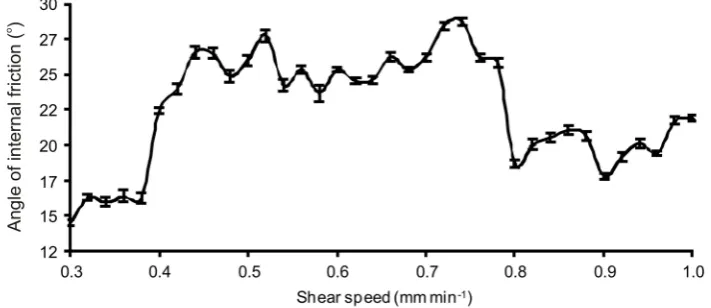
High and low values of the angle of internal friction are indicated in Fig. 1. As seen in Fig. 1, the values of the angle of internal friction at different shear speeds ranged from 14.00 to 28.250. The lowest mean value for the angle of
internal friction was determined as 0.30 mm min-1 and the
highest mean value was determined as 0.74 mm min-1. In
addition, the values obtained for the angle of internal fric-tion were quite different. The differences among the angles of internal friction at the different shear speeds were statis-
tically significant at p<0.01. Expressed statistically, a signi-ficant difference is the difference between the values of all
the angles of internal friction. Despite the statistical diffe- rence, the values of the angles of internal friction at the shear speeds are very low. Therefore, the values of the angles of internal friction of shear speeds from 0.30 to 0.38 mm min-1
are not recommended. Because these shear speeds are very
low, the values of the angle of internal friction are difficult
to calculate. The values of the internal friction angle can not give accurate results in the calculation of the silo wall pres-sures. Therefore, in terms of silos, designers can be misled. Moya et al. (2002b) reported both decreased and increased
angles of internal friction at different shear speeds (0.065, 0.32 and 0.63 mm min-1) for various agricultural products
(kym barley, krona barley rapeseed, eulalia chickpea,
sun-flower, camacho wheat, camarma triticale, senda vetch,
vereda vetch, lentil vetch). The values of the internal friction angle, especially in the determination of the silo wall thick-
ness, are used in both empirical equations and finite ele -ment software such as ANSYS and ABAQUS. In addition, it is a useful parameter for the optimum design of hoppers.
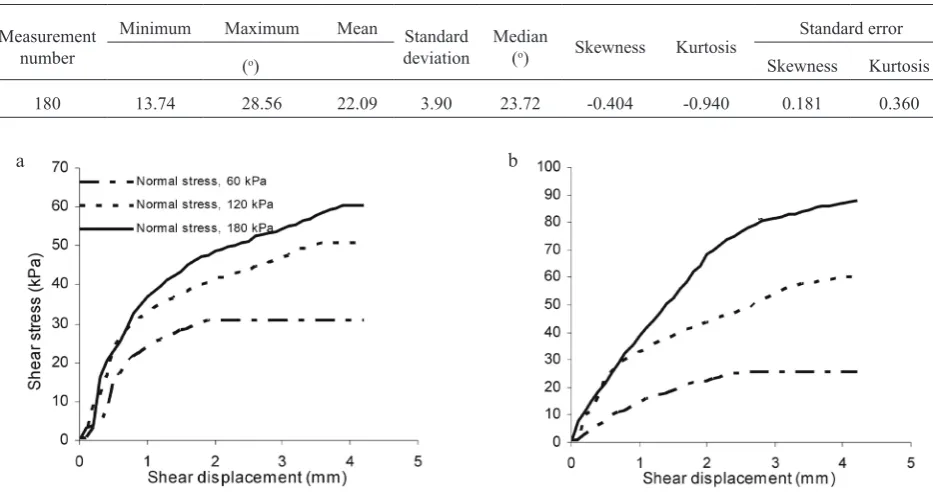
The histogram plot relating to frequency distribution of the angles of internal friction at different shear speeds is shown in Fig. 2. Each histogram displays the frequencies of certain ranges of the angles of internal friction within the sample. Summary information related to the histogram is shown in Table 2. The angle values ranged from 13.74 to 28.56o. 19 different classes were composed for the angle
of internal friction in the histogram plot. The mean and median values for a quick check were compared. These va- are close to each other and can be said to conform to a nor-mal distribution of data. As can be seen from Table 2, the mean value is 22.09, while the median is 23.72. Although
normally distributed, histogram data should be concerned
about the Skewness coefficient. Skewness coefficient for
the normal distribution must be from -1 to +1. Skewness
coefficient is -1<-0.404<+1 (Table 2). However, to be
normal distribution, the double of the Standard error of
Skewness (0.181x2<) must be less than the skewness coefficient. Accordingly, the angles of internal friction at
different shear speeds did not show a normal distribution (0.181x2>-0.404).
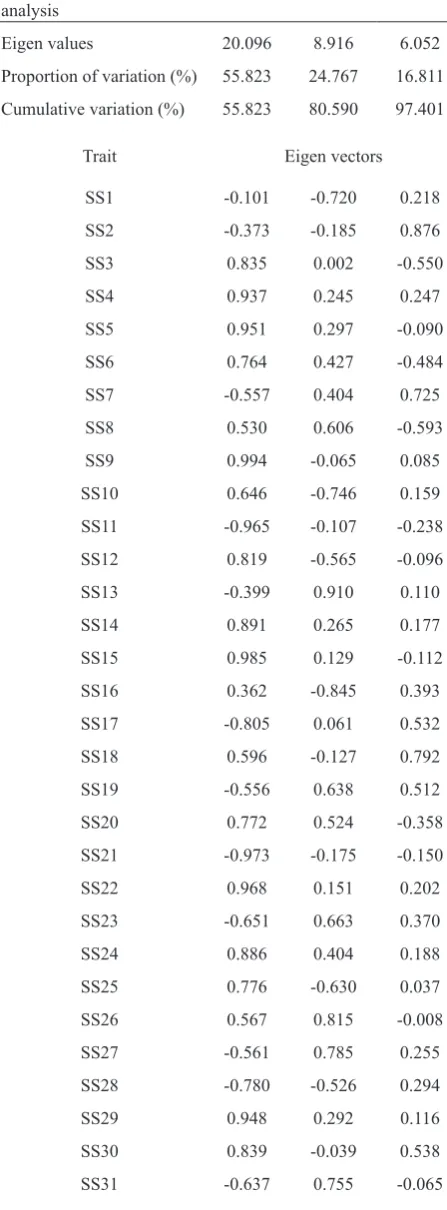
Figure 3 shows the displacement curves of varying
con-fining stresses for dry bean. The test results show that these
increased at the shear stress values with the increase in nor-mal stress (60, 120, 180 kPa) for both 0.30 and 0.74 mm min-1 shear speed. Here, the shapes concerning minimum
Fig. 1. Mean angles of internal friction at different shear speeds.
Fig. 2. Histogram plot of the angles of internal friction at different shear speeds.
and maximum values in the angles of internal friction are given. Peak stresses in each two-speed were determined in 180 kPa normal stress. However, the shear stress value at 0.74 mm min-1 and 60 kPa is higher than the shear stress
value at 0.30 mm min-1 and 60 kPa. An increase in the
dis-placement values with the increase in the applied normal load (60-180 kPa) was observed. The cause of higher shear stress at 0.74 mm min-1 is that the values of the angle of
internal friction obtained at 0.74 mm min-1 were higher than
at 0.30 mm min-1. This can also be seen from Eq. (1).The
same results for the direct shear test have been reported by
Mofiz et al. (2004), Ramirez et al. (2004), and Nakao and Fityus (2008).
At the end of PCA, factor coefficients of identifying
qualities were evaluated and the attributes scoring a
coef-ficient value higher than 0.7 in the first three PCA were
determined. The results of the PCA are presented in Table 3.
The first three principal components (PCs) accounted for
97.401% of the total variability among the 36 shear speeds
for all the traits investigated. The first principal component
(PC1), which is the most important component, explained 55.82% of the total variability and was related to SS3 – 6, SS9, SS11, SS12, SS14 – 15, SS17, SS20 – 22, SS24 – 25, SS28 – 30, SS32 and SS35 – 36. These traits have a great in-
fluence on the mechanical properties and silo wall pressures.
The second principal component (PC2) had 24.76% of the total variation in different shear speeds. SS13, SS26 – 27,
SS31 and SS33 contributed positively to PC2. In contrast, SS1, SS10, SS16 contributed negatively to PC2. The third principal component (PC3) exhibited 16.81% of all shear speeds and was associated with SS2, SS7, SS18, and SS34.
The plot of the angles of internal friction on the first
three PCs obtained from analysis of 36 shear speed traits are presented in Fig. 4. The scatter diagram of the angles of internal friction showed that there was a high level of
diversity and the angles of internal friction had significant
differences in the important shear speeds.
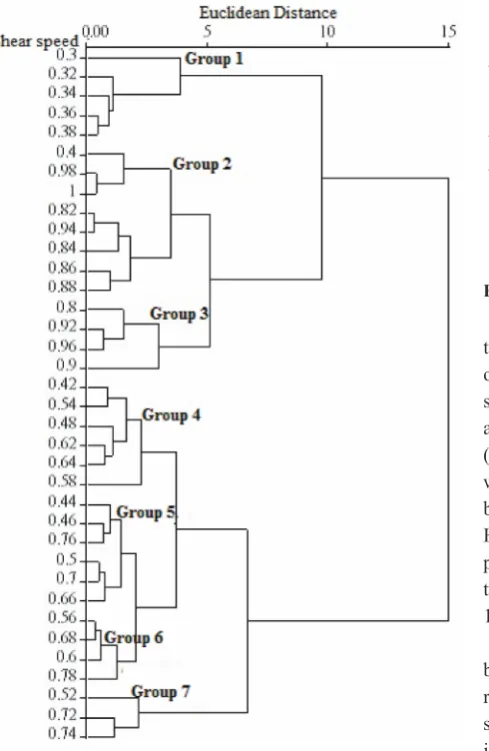
The angle of internal friction grouping of thirty six shear speeds using the clustering algorithm is shown in Fig. 5. The shear speeds were divided into different clusters by their distribution on the dendogram. In the research, seven clusters occurred in the result of the CA, in terms of shear
speed traits. Group 1 consisted of five shear speeds. There
was a total of seven shear speeds in the biggest Group 2. Groups 3 and 6 had four shear speeds. Groups 4 and 5 con-tained six shear speeds. However, there were only three shear speeds in Group 7.
Poisson ratio of dry bean ranged from 0.345 to 0.431 (Fig. 6). The relationship between Poisson ratios with the angles of internal friction depending on different shear speed is inversely proportional as shown in Fig. 6. The dif-ferences between Poisson’s ratios at different shear speeds
were statistically significant at p<0.01. Poisson ratio is
T a b l e 2. Values relating to the angle of internal friction and histogram
Measurement number
Minimum Maximum Mean Standard
deviation Median (o) Skewness Kurtosis
Standard error
(o) Skewness Kurtosis
180 13.74 28.56 22.09 3.90 23.72 -0.404 -0.940 0.181 0.360
Fig. 3. Shear stress (shear speed: a – 0.30, b – 0.74 mm min-1)concerning the maximum and minimum angle of internal friction.
necessary in design with finite element analysis of wall
pres-sures in storage structures. Poisson ratio was used to
deter-mine the minimum slope of flow at the self emptying bin in
a silo hopper and the stress distribution in the silo wall at
ANSYS finite element software. Molenda et al. (2001) also reported the same results for soybean meal and corn meal. Moya et al. (2006) reported both decreased and increased Poisson ratios at different shear speeds (0.19 and 1.02 mm min-1) of various agricultural products (amelia chickpea,
flaxseed, lentil, rice, rye, horzal wheat).
The observed values in the lateral pressure ratios accord-ing to the different angles of internal friction are shown in Fig. 7. Lateral pressure ratios determined according to thir-ty six different shear speeds and different methods changed as non-linear with the increase in the shear speed. At the present time, to calculate pressures acting on silo walls, the equation proposed by Eurocode 1 is generally used. Here, a comparison is made between the other methods and Euro- code 1. The pressure ratio values calculated according Fig. 4. Scatter diagram based on the first three principal compo-nents (PC) axes at thirty six shear speeds.
T a b l e 3. Principal component analysis (for the first three PCs) of angles of internal friction studied for shear speeds
Principal component
analysis PC 1 PC 2 PC 3
Eigen values 20.096 8.916 6.052
Proportion of variation (%) 55.823 24.767 16.811 Cumulative variation (%) 55.823 80.590 97.401
Trait Eigen vectors
SS1 -0.101 -0.720 0.218
SS2 -0.373 -0.185 0.876
SS3 0.835 0.002 -0.550
SS4 0.937 0.245 0.247
SS5 0.951 0.297 -0.090
SS6 0.764 0.427 -0.484
SS7 -0.557 0.404 0.725
SS8 0.530 0.606 -0.593
SS9 0.994 -0.065 0.085
SS10 0.646 -0.746 0.159
SS11 -0.965 -0.107 -0.238
SS12 0.819 -0.565 -0.096
SS13 -0.399 0.910 0.110
SS14 0.891 0.265 0.177
SS15 0.985 0.129 -0.112
SS16 0.362 -0.845 0.393
SS17 -0.805 0.061 0.532
SS18 0.596 -0.127 0.792
SS19 -0.556 0.638 0.512
SS20 0.772 0.524 -0.358
SS21 -0.973 -0.175 -0.150
SS22 0.968 0.151 0.202
SS23 -0.651 0.663 0.370
SS24 0.886 0.404 0.188
SS25 0.776 -0.630 0.037
SS26 0.567 0.815 -0.008
SS27 -0.561 0.785 0.255
SS28 -0.780 -0.526 0.294
SS29 0.948 0.292 0.116
SS30 0.839 -0.039 0.538
SS31 -0.637 0.755 -0.065
SS32 0.821 0.261 0.481
T a b l e 3. Continuation
Principal component
analysis PC 1 PC 2 PC 3
Trait Eigen vectors
SS33 -0.452 0.880 0.146
SS34 0.296 -0.081 0.913
SS35 0.873 0.366 0.251
to Eurocode had higher values than those obtained with the other methods (Fig. 7). The highest value for lateral pres-sure ratio was determined according to Eurocode 1 (0.757) and the lowest value was determined according to Jaky (1948) (0.470). The differences related to each method
were statistically significant (p<0.05). Similar results have
been reported by Molenda et al. (2001) for wheat, and Horabik and Rusinek (2002) for some cereal grains. Lateral pressure ratio is necessary to calculate pressures acting on the walls (standards such as Eurocode1, 2006; DIN1055-6, 1987; AS3774, 1996) in silos.
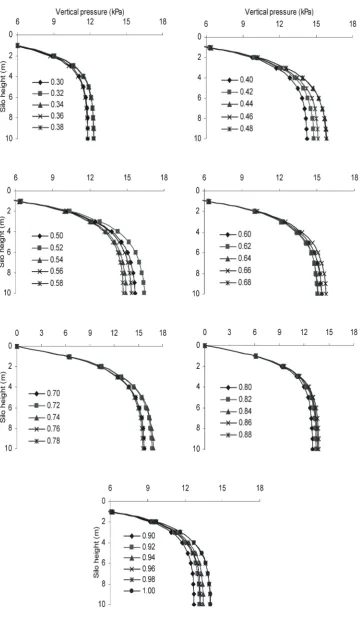
The filling pressure distributions were calculated for dry
bean using the angle of internal friction and lateral pressure ratio at different shear speeds (Fig. 8). The theoretical pres-sure distributions for the cylindrical silo are also presented in Eurocode 1 (2006). The distribution of vertical
pres-sures along the wall of the silo was significantly influenced
by the angle of internal friction and lateral pressure ratio
(Fig. 8). The lowest filling pressures were determined in
mechanical properties caused by the shear speeds from 0.30 to 0.38 mm min-1. This difference leads to the proportio-
nal change between the mechanical properties. While the highest value (16.88 kPa) for the vertical pressures was recorded at 0.74 mm min-1 shear speed, the lowest value
(5.74 kPa) for the horizontal pressures was recorded at 0.36 mm min-1 shear speed. Figure 8 shows considerable
spread or variation in pressures, especially in the lower por-tions of the silo. The pressure changes with height in silo walls due to pressures of bulk material have been reported by different researchers. Many researchers have also found
a significant influence of grain pressures on the values of
the angle of internal friction (Mahapatra and Lan, 2007; Tomas, 2014).
Fig. 5. Dendrogram of the angles of internal friction obtained from cluster analysis based on shear speed traits.
Fig. 6. Poisson ratios concerning different shear speeds.
Fig. 7. Lateral pressure ratios according to the different methods.
Poisson ratio
According to
Lohnes Eurocode Poisson ratio
Shear speed (mm min-1)
CONCLUSIONS
1. The influence of shear speed on the mechanical
pro-perties can be determined using the direct shear test. 2. The test results showed that the important effect of shear speeds on the shear stress change. The angles of inter-nal friction with the increases in the shear speeds show both increases and decreases.
3. The values of Poisson ratio were dependent on the angle of internal friction. The values of Poisson ratio were
significantly different for the different angle of internal
friction.
4. The lateral pressure ratio of dry bean decreased and increased depending on increases in the angle of internal friction. The effect of shear speed on these changes is extremely important. The lateral pressure ratio for dry bean was greatest on Eurocode 1, followed according to Poisson ratio and Jaky.
5. The wall pressures decreased and increased during
the filling conditions with change in the angle of internal
friction. In addition, there was a huge variability in the angle of internal friction among the different shear speeds.
6. The results obtained suggest that the design of silo structures and postharvest processing equipment may not neglect the features of real pressure distribution developed
by the stored material. Therefore, an analysis using finite
element programs (ANSYS, FELASH and ABAQUS etc.) in silos and storage structures should be made.
7. This study is the first one to determine angles of
inter-nal friction variability at different shear speeds using
mul-tivariate statistical analyses. In conclusion, these findings
are important for the mechanical and physical properties of different shear speed studies for all agricultural materials undertaken in the future.
REFERENCES
AOAC, 1984. Official method of analysis 14th Ed., Association of Official Analytical Chemists. Washington, DC, USA. ASTM, 2000a. D3080-90: Standard test method for direct shear
test of soils under consolidated drained conditions. In: Annual Book of ASTM Standards. West Conshohocken, PA: American Society for Testing and Materials.
ASTM, 2000b. D6128-97: Standard test method for shear testing of bulk solids using the Jenike shear cell. In: Annual Book of ASTM Standards. West Conshohocken, PA: American Society for Testing and Materials.
AS3774, 1996. Loads on bulk solids containers. Standards Australia, Sydney, Australia.
DIN1055-6, 1987. Design loads for buildings: loads in silo bins, Deutsches Institut fur Normung, Berlin, Germany.
Eurocode 1, 2006. EN 1991-4, Eurocode 1: Basis of Design and Actions on Structures, Part 4 – Silos and Tanks. European Committee for Standardisation, Brussels.
Eurocode 3, 2004. Design of Steel Structures (EN 1993-1-3), Part 1-3: General Rules-Supplementary Rules for Cold Formed Thin Gauge Members and Sheeting. European Committee for Standardisation, Brussels, Belgium.
FAOSTAT, 2012. World crop production statistics. Food and Agricultural Organization of United Nations Statistical Database Online Services.
Ganesan V., Rosentrater K.A., and Muthukumarappan K., 2005. Flowability and handling characteristics of bulk solids and powders – A review. ASAE Annual Int. Meeting, ASAE Tampa Convention Center, July 17-20, Tampa, Florida. Härtl J. and Ooi J.Y., 2008. Experiments and simulations of
direct shear tests: porosity, contact friction and bulk fric-tion. Granular Matter, 10, 263-271.
Horabik J. and Rusinek R., 2002. Pressure ratio of cereal grains determined in uniaxial compression test. Int. Agrophysics, 16, 23-28.
Jaky J., 1948. Pressures in silos. Proc. 2nd Int. Conf. Soil Mechanics and Foundation Engineering, 1, 103-107. Lohnes R.A., 1993. Lateral stress ratios for particulate materials.
Powder Handling and Processing, 5, 331-335.
Mahapatra A.K. and Lan Y., 2007. Postharvest handling of grains and pulses. In: Handbook of Food Preservation (Ed. M.S. Rahman). CRC Press, New York, USA.
Mofiz S.A., Rhaman M.M., and Alim M.A., 2004. Stress-strain behaviour and model prediction of reinforced residual soil. 15th Southeast Asian Geotechnical Soc. Conf., November 22-26, Bagkok, Thailand.
Molenda M., Montross M.D., Horabik J., and Ross I.J., 2001. Mechanical properties of granular feed ingredients. ASAE Annual Int. Meeting, Sacramento Convention Center, July 30 – August 1, Sacramento, CA, USA.
Moya M., Ayuga F., Guaita M., and Aguado P., 2002a. Mecha- nical properties of granular agricultural materials consi- dered in silos design. 15th ASCE Eng. Mechanics Conf., Columbia University, June 2-5, New York, USA.
Moya M., Ayuga F., Guaita M., and Aguado P., 2002b. Mecha- nical properties of granular agricultural materials. Trans. ASAE, 45, 1569-1577.
Moya M., Guaita M., Aguado P., and Ayuga F., 2006. Mechani- cal properties of granular agricultural materials. Part 2. Trans. ASAE, 49, 479-489.
Nakao T. and Fityus S., 2008. Direct shear testing of a marginal material using a large shear box. Geotechnical Testing J., 31, 393-403.
Qu Q., Negi S.C., and Jofriet J.C., 2001. Storage of cohesive material in silos. Part 2: Parametric study. Powder Handling Proc., 13, 27-30.
Ramirez A., Moya M., and Ayuga F., 2004. Determination of mechanical properties of agricultural powder materials and sugar to be used in silos design. ASAE/CSAE Annual Int. Meeting, Fairmont Chateau Laurier, The Westin, Govern- ment Centre Ottawa, August 1-4, Ontario, Canada. Tomas J., 2014. Silo and bunker pressure calculations. Faculty of
Process and Systems Engineering, Mechanical Process Engineering, Magdeburg, Germany.
USDA, 2012. Dry Beans. United Stated Department of Agricul- ture, Economic Research Service, Washington, DC, USA. Zou Y. and Brusewitz G.H., 2001. Angle of internal friction and