ISSN: 0976-3031
Research Article
COMPARISON OF CONCRETE PROPERTIES BY USING DIFFERENT TYPES OF FINE
AGGREGATES AVAILABLE IN LUCKNOW
Asra Faizan., Anwar Ahmad., Syed Aqeel Ahmad and Mohd Sadat
Department of Civil Engineering, Integral University, Lucknow, India
DOI: http://dx.doi.org/10.24327/ijrsr.2018.0904.2018
ARTICLE INFO ABSTRACT
In lieu of exponential infrastructure growth, the demand for raw materials has grown tremendously. Unchecked, exploitation of resources for concrete production has led to the environmental crisis. This study aims to analyze the use of alternative materials to replace fine aggregate in concrete production. Natural Sand, Stone Dust (Grey) and Stone Dust (Brown) are used to caste cube, cylinder and rectangular beams to test compressive, tensile and flexural strengths respectively. Among aforementioned fine aggregates natural sand, sourced from river beds, is extensively used in the Uttar Pradesh (India). The 7 and 28-day strength achieved by replacing natural sand with stone dust for M 25 is comparable and thus it can be used as fine aggregate. Thus Stone dust which isa waste product from quarries can be utilized in concrete production. This will result in not only reduced pressure on natural sand extraction from river beds but also solving the problem of waste disposal in stone quarries.
INTRODUCTION
Urbanization has led to increased construction activities in different regions of India which is becoming a threat. One such threatisoverexploitation of natural sand. In the last 15 years, availability of fine aggregate (natural sand) is decreasing due to a rapid growth of construction activity. Concrete has been preferred construction material for the past few years due to its mould ability, durability, ease of availability and rigidity. Manufacturing of concrete involves the use of construction materials like aggregate, cement, water and admixture. Aggregates form a major part of concrete gel which is formed after hydration. Overexploitation of natural sand causes lowering of water table, the sinking of bridge piers and erosion of river bed posing enormous challenges for governments. Environmental concern has also been arising against uncontrolled extraction of natural sand. Overconsumption of natural sand has increased and therefore degrading the quality of sand. The government has restricted quarrying of the sand which has led to the problem of scarcity and increased the cost of natural sand. In today's competitive world we cannot stop the construction activity but can curtail the use of natural sand by innovative ideas. The prime duty of civil engineers to
conserve natural resources without affecting the construction activities. One of theways is to search alternatives material which can fully or partially replace naturally available material in construction. Stone dust can be a viable alternative to natural sand which can be effectively be used in construction material. Stone dust is a waste product and causes environmental pollution.It is obtained from the aggregate crushing plant, it may be used as raw material without any processing. In the earlier review paper works of scholars like Manjunath et al. (2017), Naresh Kumar et al. (2017 Karuna Devi et al. (2017) Ayushi R.Sharma(2016), Kavitha Karthikeyan et al. (2017) , Azhahendran et al. (2016) Chabbara et al. (2015) , Yusut et al. (2015) Sadat and Celikoglu (2017), Abuamer et al.(2017) and Sadat et al. (2017) were summarized.
This study involves a comparative analysis of concrete prepared by using Badarpur Sand (moorum), Stone Dust (grey) and Stone Dust (brown) as fine aggregates. These are available in the Lucknow region of the state of Uttar Pradesh, India. Performance parameters were a compressive strength,split tensile strength and flexural strength of cubes, cylinder,and beamrespectively after a curing period of 7 and 28 days.In this study, we used an M25 grade of concrete to test various aforementioned sands.
International Journal of
Recent Scientific
Research
International Journal of Recent Scientific Research
Vol. 9, Issue, 4(J), pp. 26235-26239, April, 2018
Copyright © Asra Faizan et al, 2018, this is an open-access article distributed under the terms of the Creative Commons Attribution License, which permits unrestricted use, distribution and reproduction in any medium, provided the original work is properly cited.
DOI: 10.24327/IJRSR CODEN: IJRSFP (USA)
Article History:
Received 5th January, 2018
Received in revised form 20th February, 2018
Accepted 8th March, 2018 Published online 28th April, 2018
Key Words:
MATERIALS AND THEIR PROPERTIES
Cement: Cement is a hydraulic binder and fine powder which when mixed water it gets set and hardens. It has a tendency to unit fragments of all masses of solid matter together to produce a mechanically strong material. In this research, we use Ordinary Portland Cement 43 grade confirming to IS 8112:1989.
Fine Aggregate:The aggregate whose size is 4.75mm and less is considered as a fine aggregate. In this research, we use stone dust and natural sand as a fine aggregate. The testing procedures of sieve analysis of fine aggregate are given in IS 383-1970.
Coarse Aggregate: The size of aggregate bigger than 4.75mm is considered as coarse aggregate. In this research, we use aggregate of size 10mm and 20mm.
Water: Water is an important constituent for producing concrete. It chemically reacts with cement to produce the desired properties of concrete. The water is used in this investigation is recommended from IS: 456-2000, the water to be used for curing and mixing is free from deleterious materials.
Admixture: In this research, we use complast sp430 as an admixture.
Figure 1 a) Natural sand (Badarpur) b) Stone Dust (grey) c) Stone Dust
(brown)
Figure 1 shows Badarpursand as a natural sand and use of artificial sand (stone dust which is grey and Stone dust which brown in color) replacing of natural sand. These three grains of sand are available in Lucknow. Concreting is done using these three sand and then testing as well as comparative analysis is performed.
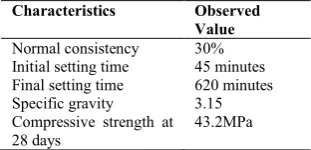
Table 1 physical properties of cement
Characteristics Observed
Value
Normal consistency 30% Initial setting time 45 minutes Final setting time 620 minutes Specific gravity 3.15 Compressive strength at 28 days
43.2MPa
Table 2 physical properties of natural sand (Badarpur), stone dust (grey) and stone dust (brown)
S.No. Aggregate Grading zone
Fineness modulus
Specific gravity
Silt content 1 Natural Sand
(Badarpur) 3 2.35 2.61 2.6% 2 Stone dust
(grey) 3 2.67 2.69 1.9% 3 Stone dust
(brown) 3 2.54 2.78 2.1%
Table 3 physical properties of coarse aggregate
Physical properties Observed value
10mm aggregate 20mm aggregate
Fineness modulus 5.98 6.40 Aggregate crushing value (%) 17.2 23.99
Aggregate Impact value (%) 27.91 23.10 Specific gravity 2.66 2.65
METHODOLOGY
Following processes were adopted in order to cast the test specimens. Batching is the process of measuring of all materials for making concrete. Batching is followed by Mixing where dry constituent of concrete making material like cement, water, coarse aggregate, fine aggregate are mixed until a homogeneous mixture is obtained. Mixing of constituent is done by concrete mixer machine. Further casting is done which is a process of placing concrete into a specified mould in layers with appropriate blows by the standard tamping rod. Curing: All specimens were demoulded after 24 hours and stored in water until the age of testing. All tests are conducted after the specified cured period. Mix design M25 grade of concrete
Figure 2 Methodology
Therefore we collected all the concrete making materials like cement, water,and coarse aggregate, fine aggregate. First cubes, cylinders and beams are casted using Badarpursand as a natural sand. Later natural sand is replaced with the artificial sand like stone dust grey and brown in colour. Specimens are cured for 7 and 28 days. Then the cube, cylinder and beam specimen are tested and data is recorded. Later results are analyzed mathematically and graphically. Three tests are conducted on the samples in this study namely compressive strength test, split tensile strength test, and flexural strength test.
Mix Design
Concrete for the M25 grade was prepared as per IS 10262:2009 for M25 grade concrete for the material of as follows
Materials Quantity
Cement 350Kg/m3 Sand 635Kg/m3 Coarse aggregate 1310Kg/m3 Water 148.8Kg/m3 Admixture 4.2Kg/m3
The table below summarizes the results for Compressive Strength, Split Tensile Strength and Flexural Strength. Average values of samples have been presented to weed out error arising from poor workmanship and improper mixing.
RESULT
This section discusses the results in detail. The figures below show the variation of compressive strength for cubes three types of fine aggregates for 7 and 28-days. Similarly, figures also show the Split Tensile Strength and Flexural Strength.
The figure clearly shows that 7 days average compressive value for stone dust (grey) which is 17.93 MPa is higher than Badarpur sand and stone dust (brown) values which is 16.7 MPa and 16.51Mpa respectively.
Figure 3 Average compressive strength of cubes at 7 days.
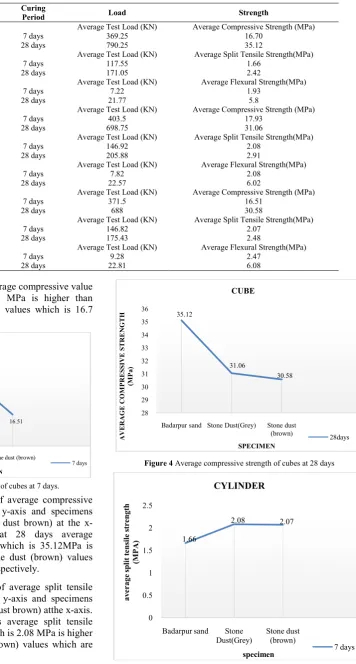
Figure 4 shows a comparative study of average compressive strength values for 28 days cubes at y-axis and specimens (Badarpur sand, stone dust grey, stone dust brown) at the x-axis. The figure clearly shows that 28 days average compressive value for Badarpur sand which is 35.12MPa is higher than stone dust (grey) and stone dust (brown) values which are 31.06 MPa and 30.58 MPa respectively.
Figure 5 shows a comparative study of average split tensile strength values for 7 days cylinder at y-axis and specimens (Badarpur sand, stone dust grey, stone dust brown) atthe x-axis. The figure clearly shows that 7 days average split tensile strength value for stone dust (grey) which is 2.08 MPa is higher than Badarpur sand and stone dust (brown) values which are 1.66MPa and 2.07MPa respectively.
Figure 4 Average compressive strength of cubes at 28 days
Figure 5 Average split tensile strength of cylinders at 7 days
16.7 17.93 16.51 15.5 16 16.5 17 17.5 18 18.5
Badarpur sand Stone Dust(Grey) Stone dust (brown)
A V E R A G E C O M P R E S S iV E S T R E N G T H (M P a ) SPECIMEN CUBE 7 days 35.12 31.06 30.58 28 29 30 31 32 33 34 35 36
Badarpur sand Stone Dust(Grey) Stone dust
(brown) A V E R A G E C O M P R E S S IV E S T R E N G T H (M P a ) SPECIMEN CUBE 28days 1.66 2.08 2.07 0 0.5 1 1.5 2 2.5
Badarpur sand Stone Dust(Grey) Stone dust (brown) a v e r a g e s p li t te n si le s tr e n g th (M P A ) specimen CYLINDER 7 days
S.No: Specimen Shape Curing
Period Load Strength
1 Badarpur Sand
Cube
Average Test Load (KN) Average Compressive Strength (MPa)
7 days 369.25 16.70
28 days 790.25 35.12
Cylinder
Average Test Load (KN) Average Split Tensile Strength(MPa)
7 days 117.55 1.66
28 days 171.05 2.42
Beam
Average Test Load (KN) Average Flexural Strength(MPa)
7 days 7.22 1.93
28 days 21.77 5.8
2 Stone Dust (Grey)
Cube
Average Test Load (KN) Average Compressive Strength (MPa)
7 days 403.5 17.93
28 days 698.75 31.06
Cylinder
Average Test Load (KN) Average Split Tensile Strength(MPa)
7 days 146.92 2.08
28 days 205.88 2.91
Beam
Average Test Load (KN) Average Flexural Strength(MPa)
7 days 7.82 2.08
28 days 22.57 6.02
3 Stone Dust (Brown)
Cube
Average Test Load (KN) Average Compressive Strength (MPa)
7 days 371.5 16.51
28 days 688 30.58
Cylinder
Average Test Load (KN) Average Split Tensile Strength(MPa)
7 days 146.82 2.07
28 days 175.43 2.48
Beam
Average Test Load (KN) Average Flexural Strength(MPa)
7 days 9.28 2.47
Figure 6 shows a comparative study of average split tensile strength values for 28 days cylinder at x-axis and specimens (Badarpur sand, stone dust grey, stone dust brown) aty-axis. The figure clearly shows that 28 days average split tensile strength value for stone dust (grey) which is 2.91 MPa is higher than Badarpur sand and stone dust (brown) values which are 2.42MPa and 2.48MPa respectively.
Figure 6 Average split tensile strength of cylinders at 28 days
Figure 7 shows a comparative study of average flexural strength values for 7 days beam at y-axis and specimens (Badarpur sand, stone dust grey, stone dust brown) atthe x-axis. The figure clearly shows that 7 days average flexural strength value for stone dust (brown) which is 2.47MPa is higher than Badarpur sand and stone dust (grey) values which are 1.93 MPa and 2.08 MPa respectively.
Figure 7 Average flexural strength of beams at 7 days
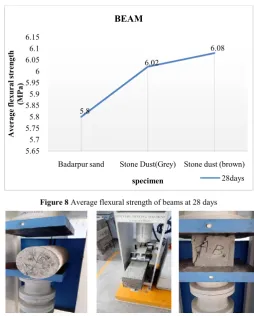
Figure8 shows a comparative study of average flexural strength values for 28 days beam at y-axis and specimens (Badarpur sand, stone dust grey, stone dust brown) at the x-axis. The figure clearly shows that 28 days average flexural strength value for stone dust (brown) which is 6.08MPa is higher than Badarpur sand and stone dust (grey) values which is 5.8MPa and 6.02 MPa respectively.
Figure 8 Average flexural strength of beams at 28 days
Figure 9 a)shows the testing of the cylindrical specimenb) shows the failure of
the beam specimenc) shows the testing of the cubicalspecimen
CONCLUSION
An experimental study was done on concrete using different types of sand and coarse aggregate and also with an admixture of cement and concluded that.
1. Workability of the concrete is decreased when using stone dust brown.
2. The maximum compressive strength was obtained when 35% stone dust was used with coarse aggregate and cement content was increased by 10 %.
3. The maximum split tensile strength are obtained for stone dust brown 5% of replace with coarse aggregate. 4. It is also observed that the compressive strength is found to be optimum when fine aggregate was replaced by 5% with stone dust (grey) at the end of 7 days.
5. Stone dust can be used as partial or full replacement of natural fine aggregate in concrete.
6. The use of stone dust in concrete is beneficial in environmental aspects. Also, it can bea good quality of fine aggregate from strength criteria.
7. The workability of concrete decreased at increment level of stone dust in concrete which can maintained by extra doses of admixture.
8. Stone dust can be used as fine aggregate where setting time is not much important.
Reference
1. B.T. Manjunath, A., Manjunath.M.S., Karthick.T.R., Lakshmi.k.,(2017). Partial replacement of sea and desert sand in place of river sand for mortar in
2.42
2.91
2.48
0 0.5 1 1.5 2 2.5 3 3.5
Badarpur sand Stone Dust(Grey) Stone dust (brown)
a
v
e
r
a
g
e
s
p
li
t
te
n
si
le
s
tr
e
n
g
th
(M
P
A
)
specimen
CYLINDER
28days
1.93 2.08
2.47
0 0.5 1 1.5 2 2.5 3
Badarpur sand Stone Dust(Grey) Stone dust (brown)
A
v
e
r
a
g
e
f
le
x
u
r
a
l
st
r
e
n
g
th
(M
P
a
)
specimen
BEAM
7 days
5.8
6.02
6.08
5.65 5.7 5.75 5.8 5.85 5.9 5.95 6 6.05 6.1 6.15
Badarpur sand Stone Dust(Grey) Stone dust (brown)
A
v
e
r
a
g
e
f
le
x
u
r
a
l
st
r
e
n
g
th
(M
P
a
)
specimen
BEAM
construction. Global Research and developmentJournal for engineering, 2(7), 81-85
2. Naresh Kumar.D.V., Ganaraju.P.M., Avinash. P.& Rambabu.G. (2017). A study on compressive strength of concrete by partial replacement of coarse aggregate with coconut shell and with addition of fibres. International Journal of Civil Engineering Research, 8(1), 57-68. 3. Kavitha Karthikeyan, S., Priya.P., Azhahaendran, D. &
Nagarajan., P. (2017). Exploratory study on partial replacement of coarse aggregate by Talipot Palm seed. International Journal of Civil Engineering and Technology, 8(7), 208-213.
4. Sadat, M., & Celikoglu, H. B. (2017). Simulation-based Variable Speed Limit Systems Modelling: An Overview and A Case Study on Istanbul Freeways. Transportation research procedia, 22, 607-614.
5. Sadat, M., Abuamer, I. M., Silgu, M. A., & Celikoglu, H. B. (2017, February). A CoMParative Performance Analysis of Variable Speed Limit Systems Control Methods Using Microsimulation: A Case Study on D100 Freeway, Istanbul. In International Conference on Computer Aided Systems Theory(pp. 462-469). Springer, Cham.
*******
How to cite this article: