disease in acute myeloid leukemia
Elaine Coustan-Smith, … , James R. Downing, Dario
Campana
JCI Insight.
2018;3(9):e98561. https://doi.org/10.1172/jci.insight.98561.
BACKGROUND.
Optimal management of acute myeloid leukemia (AML) requires
monitoring of treatment response, but minimal residual disease (MRD) may escape
detection. We sought to identify distinctive features of AML cells for universal MRD
monitoring.
METHODS.
We compared genome-wide gene expression of AML cells from 157 patients
with that of normal myeloblasts. Markers encoded by aberrantly expressed genes, including
some previously associated with leukemia stem cells, were studied by flow cytometry in 240
patients with AML and in nonleukemic myeloblasts from 63 bone marrow samples.
RESULTS.
Twenty-two (CD9, CD18, CD25, CD32, CD44, CD47, CD52, CD54, CD59,
CD64, CD68, CD86, CD93, CD96, CD97, CD99, CD123, CD200, CD300a/c, CD366,
CD371, and CX3CR1) markers were aberrantly expressed in AML. Leukemia-associated
profiles defined by these markers extended to immature CD34
+CD38
–AML cells;
expression remained stable during treatment. The markers yielded MRD measurements
matching those of standard methods in 208 samples from 52 patients undergoing
chemotherapy and revealed otherwise undetectable MRD. They allowed MRD monitoring
in 129 consecutive patients, yielding prognostically significant results. Using a
machine-learning algorithm to reduce high-dimensional data sets to 2-dimensional data, the markers
allowed a clear visualization of MRD and could detect […]
Clinical Medicine
Hematology
Oncology
Find the latest version:
Conflict of interest: ECS and DC are inventors in a patent application (no. 62/577,673) relevant to the work described in this manuscript.
Submitted: November 7, 2017
Accepted: March 28, 2018
Published: May 3, 2018
Reference information:
JCI Insight. 2018;3(9):e98561. https:// doi.org/10.1172/jci.insight.98561.
Universal monitoring of minimal residual
disease in acute myeloid leukemia
Elaine Coustan-Smith,1 Guangchun Song,2 Sheila Shurtleff,2 Allen Eng-Juh Yeoh,1,3 Wee Joo Chng,3
Siew Peng Chen,1 Jeffrey E. Rubnitz,4,5 Ching-Hon Pui,2,4,5 James R. Downing,2,5 and Dario Campana1,3
1Department of Pediatrics, National University of Singapore, Singapore. 2Department of Pathology, St. Jude Children’s
Research Hospital, Memphis, Tennessee, USA. 3National University Cancer Institute, Singapore, National University of Singapore, Singapore. 4Department of Oncology, St. Jude Children’s Research Hospital, Memphis, Tennessee, USA. 5University of Tennessee Health Science Center, Memphis, Tennessee, USA.
Introduction
In most patients with acute myeloid leukemia (AML), leukemic cells become undetectable after chemother-apy. Nevertheless, leukemia may subsequently relapse due to persisting chemoresistant cells indistinguishable from normal hematopoietic progenitors by conventional morphologic analysis, i.e., minimal residual disease (MRD) (1–3). In both childhood and adult AML, MRD is a powerful and independent prognostic factor (4–13). Despite compelling evidence supporting its clinical importance, MRD assays in AML have remained largely unchanged over the last decade.
MRD has been measured by either PCR amplification of genetic abnormalities or flow cytometric detec-tion of leukemia-associated cell marker profiles. In about 20% of adult and 35% of pediatric AML cases, cells carry gene fusions, such as RUNX1-RUNX1T1, CBFB-MYH11, or MLL fusion transcripts (4, 14); NPM1 mutations occur in about 30% of adult and <10% of pediatric cases (15, 16). Detection of these molecular
BACKGROUND. Optimal management of acute myeloid leukemia (AML) requires monitoring of treatment response, but minimal residual disease (MRD) may escape detection. We sought to identify distinctive features of AML cells for universal MRD monitoring.
METHODS. We compared genome-wide gene expression of AML cells from 157 patients with that of normal myeloblasts. Markers encoded by aberrantly expressed genes, including some previously associated with leukemia stem cells, were studied by flow cytometry in 240 patients with AML and in nonleukemic myeloblasts from 63 bone marrow samples.
RESULTS. Twenty-two (CD9, CD18, CD25, CD32, CD44, CD47, CD52, CD54, CD59, CD64, CD68, CD86, CD93, CD96, CD97, CD99, CD123, CD200, CD300a/c, CD366, CD371, and CX3CR1) markers were aberrantly expressed in AML. Leukemia-associated profiles defined by these markers extended to immature CD34+CD38– AML cells; expression remained stable during treatment. The markers
yielded MRD measurements matching those of standard methods in 208 samples from 52 patients undergoing chemotherapy and revealed otherwise undetectable MRD. They allowed MRD monitoring in 129 consecutive patients, yielding prognostically significant results. Using a machine-learning algorithm to reduce high-dimensional data sets to 2-dimensional data, the markers allowed a clear visualization of MRD and could detect 1 leukemic cell among more than 100,000 normal cells.
CONCLUSION. The markers uncovered in this study allow universal and sensitive monitoring of MRD in AML. In combination with contemporary analytical tools, the markers improve the discrimination between leukemic and normal cells, thus facilitating data interpretation and, hence, the reliability of MRD results.
abnormalities during treatment correlates with relapse (5, 10, 17–20). Flow cytometric monitoring of MRD is also prognostically informative and, unlike PCR, is not limited to patients with specific genetic abnormalities (7–9, 21–29). Nevertheless, standard flow cytometric monitoring of MRD has a sensitivity often not exceed-ing 0.1% (1 leukemic cell in 1,000 normal bone marrow cells) (22, 25, 26), it requires considerable expertise to avoid incorrect MRD estimates, and it is still not appli-cable to all patients.
The capacity of contemporary flow cytometers to detect 8 or more markers simultaneously can increase the discriminating power of MRD analysis (30–33). This potential, however, can be fulfilled only if suffi-ciently distinct leukemia markers are available. Thus, the discovery of markers differentially expressed in leukemic versus normal myeloid cells should increase applicability, sensitivity, and reliability of MRD moni-toring by flow cytometry. In turn, this could widen the implementation of response-guided protocols in AML. In this study, we compared the genome-wide gene expression profiles of AML cells with those of their normal counterparts. The aberrant expression of selected genes was validated by flow cytometry by ana-lyzing their expression in large sets of normal and leukemic specimens (Figure 1). The findings led to the formulation of marker panels and analytical algorithms for highly sensitive monitoring of MRD in AML.
Results
Genes aberrantly expressed in AML cells and normal myeloid progenitors. To identify genes aberrantly expressed
in AML, we compared global gene expression of 157 AML diagnostic samples to that of normal CD34+
myeloid progenitor cells (CD13+ and/or CD33+) purified from the bone marrow of 7 healthy donors. We
found 395 probe sets that were overexpressed in AML (i.e., at least 100% higher than the highest signal measured in normal myeloid cells) and 260 that were underexpressed (i.e., at least 50% lower than the lowest normal value) in 66% or more AML cases. Widening the inclusion criterion to genes aberrantly expressed in at least 33% of AML cases raised the numbers to 1,958 and 1,271, respectively (Supplemental Tables 1 and 2; supplemental material available online with this article; https://doi.org/10.1172/jci.insight.98561DS1).
Among the differentially expressed genes, some had been previously shown to be aberrantly expressed in AML. Those overexpressed genes included WT1 (in 84.7% of cases) (34, 35), CD56 (46.5%) (36), CD7 (38.2%) (37, 38), CD33 (36.9%) (39), CD4 (36.3%) (40), CD14 (30.6%) (39), and CD19 (28.0%) (40), while
CD34 was underexpressed (36.3%) (41). Interestingly, genes previously reported to be leukemia stem cell
specific had also emerged in our screening. These included 18 of the 25 genes reported by Saito et al. (42) to be overexpressed in CD34+CD38– AML cells; the remaining 7 were either overexpressed in <25% of cases
(n = 4) or not probed by the HG-U133A array (n = 3). Similarly, we identified 16 of the 21 genes associated with AML stem cells by Kikushige et al. (43); the remaining 5 were either overexpressed in <25% of cases (n = 3) or not probed by our array (n = 2) (Supplemental Table 3).
Flow cytometric analysis of proteins encoded by aberrantly expressed genes. Some genes differentially expressed
by gene array analysis (e.g., CD7, CD19, CD56) encoded proteins already used as flow cytometric markers for MRD studies (8, 21, 22, 25, 26, 29, 33, 36, 44, 45), suggesting that mining the microarray data might uncover other useful markers. For further studies, we prioritized genes that were (a) differentially expressed in at least 33% of cases of AML; (b) overexpressed by at least 5-fold of the maximum value in normal cells or underexpressed by at least 5-fold of the minimum value; and (c) targetable by commercially available, flu-orochrome-conjugated, antibodies. We selected 24 genes (22 overexpressed in AML, 1 underexpressed, and 1 overexpressed in some cases and underexpressed in others) (Table 1). To these, we added CD47, CD123, CD366 (HAVCR2, TIM3), and CD371 (CLEC12A, CLL-1), which had been previously associated with AML stem cells (43, 46–48). In our gene expression analysis, CD47 and CD123 were overexpressed in <33% of cases and did not meet our selection criteria; CD366 and CD371 were not probed by the HG-U133A oligonucleotide microarray.
After confirming the specificity of the antibodies with positive and negative target cells (Supplemen-tal Table 4), we tested the expression of the 28 markers in 191 AML and 63 leukemia-free bone marrow samples. These were from either healthy donors (n = 23) or children with leukemia who were on therapy and MRD negative (n = 40); many of the latter samples contained high proportions of regenerating CD34+ myeloid progenitors. Six of the twenty-eight markers (CD115, CD163, CD177, CD209, CD210,
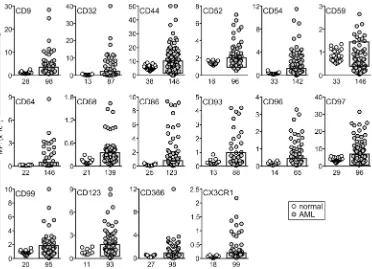
and CCL5/Rantes) were expressed in AML cells at levels too low to allow reliable MRD studies and were excluded from further studies. Among the remaining 22 markers, expression in AML was signifi-cantly different (P < 0.01) for 16: CD9, CD32, CD44, CD52, CD54, CD64, CD68, CD86, CD93, CD96, CD97, CD99, CD123, CD366, and CX3CR1 were predominantly overexpressed, while CD59 was pre-dominantly underexpressed, in agreement with the gene array result (Figure 2 and Supplemental Figure 1A). For the other 6 markers, differences between leukemic and normal cells were either not statistically significant (CD18, CD47, CD200, and CD371; P > 0.05) or yielded a higher P value (CD25, P = 0.049; CD300a/c, P = 0.020). Regardless, some AML cases had clear overexpression or underexpression (Fig-ure 3), suggesting their potential as markers for MRD studies.
For each of the 22 markers, we determined the number of AML cases that expressed them at a median fluorescence intensity (MFI) higher than the maximum level seen among normal CD34+ myeloid cells plus 1
SD or lower than the lowest value minus 1 SD. By these criteria, the 22 markers were differentially expressed in 14.8%–57.3% (median, 36.5%) of cases (Table 2). Interestingly, several (CD18, CD44, CD47, CD52, CD59, CD123, CD200, and CD300a/c) were overexpressed in some cases but underexpressed in others.
Among the 191 AML cases studied for marker expression, 34 (17.8%) had less than 25% leukemic cells that expressed CD34. We performed a subanalysis of the 22 selected markers in these cases, comparing
Table 1. Differentially expressed markers according to gene array analysis selected for further studies
Probe Symbol and/or common name % of AML cases with differential expressionA
Overexpressed in AML
202638_s_at ICAM1, CD54 84.1
204655_at CCL5, RANTES 80.3
211395_x_at (203561_at) FCGR2C, CD32 (FCGR2A, CD32) 76.4 (56.7)
214511_x_at FCGR1A, CD64 75.8
205898_at CX3CR1 73.2
206761_at CD96 66.9
205686_s_at CD86 64.3
212014_x_at CD44 64.3
207277_at CD209 59.2
202878_s_at C1QR1, CD93 56.7
215049_x_at CD163 56.1
202803_s_at ITGB2, CD18 52.9
207270_x_at CD300C 52.9
203104_at CSF1R, CD115 51.0
211269_s_at IL2RA, CD25 47.8
201028_s_at CD99 42.0
203507_at CD68 41.4
202910_s_at CD97 37.6
219669_at CD177 37.6
201005_at CD9 36.9
209582_s_at CD200 34.4
204912_at IL10RA, CD210 33.1
204661_at CD52B 28.7
Underexpressed in AML
200985_s_at CD59 65.6
AGene expression was studied by HG-U133A oligonucleotide microarrays in 157 AML samples and 7 samples of normal CD34+ myeloid progenitors.
Shown are the percentage of AML cases with expression signals higher than 2-fold of the highest value obtained among normal CD34+ myeloid cells
(Overexpressed in AML) or at least 50% lower than the lowest signal among the normal CD34+ myeloid cells (Underexpressed in AML). BCD52 was
their expression to that of CD117+CD33+ cells from nonleukemic bone marrow samples, including
matur-ing myeloid cells, monoblasts, and erythroblasts and excludmatur-ing mature monocytes and granulocytes. As shown in Supplemental Figure 2, expression in this subset of AML was significantly different (P < 0.001) for 6 of the markers (CD9, CD44, CD86, CD97, CD99, and CX3CR1). For another 8 markers (CD32, CD54, CD59, CD64, CD68, CD123, CD200, and CD300a/c) comparisons yielded a higher P value (P < 0.05 but P > 0.01). For the remaining 8 markers, the differences were not significant (P > 0.05), although some AML cases had clear overexpression or underexpression.
The selected markers persist at relapse and are expressed on AML cells with an immature phenotype.
Leuke-mia subclones at diagnosis may become predominant at relapse, resulting in immunophenotypic shifts (26). We determined the prevalence of expression shifts using paired samples collected at diagnosis and relapse from 16 AML patients, for a total of 168 tests. As shown in Figure 4A, in 146 of the 168 (86.9%) tests, at least one of the selected markers was aberrantly expressed both at diagnosis and at relapse. In an additional 13 (7.7%) tests, markers not present at diagnosis were detected at relapse. In only 9 (5.4%) tests, an aberrantly expressed marker at diagnosis reverted to normal range at relapse. Importantly, in all 16 patients studied, markers aberrantly expressed at diagnosis in more than 50% of blasts remained abnormally expressed at relapse (Supplemental Figure 3). Thus, the markers remained prevalently expressed at relapse, indicating that their aberrant expression extended to virtually all sub-clones within the leukemic cell populations.
The potential usefulness of the markers was further corroborated by studies of phenotypically more immature AML cells, i.e., CD34+, CD38dim/–. We studied 12 diagnostic samples containing 13%–65%
(median, 27%) CD34+CD38dim/– AML cells. Collectively, the markers were aberrantly expressed in these
cells and in the more mature CD38bright cells in 48 tests (43 overexpressed in both subsets, 5 underexpressed
in both subsets), while in an additional 12, clear aberrant expression was confined to the immature cell subset. In only 5 tests, the markers were aberrantly expressed in the more mature cells but were with-in the normal range with-in the immature cell population. Although variations with-in expression with-intensity among AML subsets with different maturity features were observed, marker expression largely overlapped: median
Figure 2. Genes significantly overexpressed and/or underexpressed in AML cells at the protein level, as determined by flow cytometry. Plots indicate median fluorescence intensity (MFI) of each marker in CD34+ myeloid cells (see Supplemental Figure 1A) from leukemia-free bone marrow aspirates (white
MFI for the overexpressed markers in immature AML cells was 104% (range, 27%–597%) of that in more mature cells (Figure 4, B and C, and Supplemental Figure 4).
Validation of the selected markers for MRD detection. The above results indicated that the markers
iden-tified in this study should allow reliable detection of MRD. This assumption was tested in 190 bone marrow and 18 peripheral blood samples that were collected from 52 patients with AML (35 children and 17 adults) during treatment (68 at the end of the first or second cycle of remission induction therapy, and 140 collected subsequently). In all 52 patients, at least one of the markers was found to be abnormally
Figure 3. Genes whose expression in AML cells by flow cytometry was not statistically different than that of their normal counterparts. Plots indicate median fluorescence intensity (MFI) of each marker in CD34+ myeloid cells from leukemia-free bone marrow aspirates (white
circles) and in diagnostic AML samples (gray circles). The box on the AML plots indicates the upper and lower normal limits. The number of samples studied is indicated under each plot. By unpaired t test with Welch’s correction, P > 0.05 for all markers, except CD25 (P = 0.049) and CD300a/c (P = 0.020). Some AML samples show considerable overexpression or underexpression.
Table 2. Expression of the selected markers in AML cells relative to their expression in nonleukemic bone marrow CD34+ myeloid cells, as determined by flow cytometry
Marker No. of AML cases studied No. of nonleukemic bone
marrow studied No. of AML cases with overexpressionA
No. of AML cases with
underexpressionB
% of AML cases with overexpression or
underexpression
CD18 82 15 15 32 57.3
CD54 142 33 79 0 55.6
CD52 96 16 34 17 53.1
CD97 96 29 50 0 52.1
CD96 65 14 32 0 49.2
CD59 146 33 7 63 47.9
CD200 132 18 25 35 45.5
CD44 148 38 53 12 43.9
CX3CR1 99 18 43 0 43.4
CD366 98 27 40 0 40.8
CD300a/c 145 27 26 28 37.2
CD86 123 25 44 0 35.8
CD123 93 11 29 4 35.5
CD32 87 13 27 0 31.0
CD9 98 28 28 0 28.6
CD99 95 20 25 0 26.3
CD64 146 22 43 0 29.5
CD371 68 9 15 0 22.1
CD47 67 11 7 7 20.9
CD68 139 21 24 0 17.3
CD25 87 13 14 0 16.1
CD93 88 13 13 0 14.8
ANumber of AML cases that expressed the indicated marker at levels higher than the highest median fluorescence intensity (MFI) value (+1 SD) recorded
among normal CD34+ myeloid progenitors. BNumber of AML cases that expressed the indicated marker at levels lower than the lowest MFI (–1 SD)
expressed at diagnosis. We used 8-marker panels, including markers identified in this study plus CD34, CD117, CD45, and CD33.
By standard flow cytometric methods (Supplemental Table 5) (25, 28), of the 208 samples studied, 7 had 0.01% to <0.1% and 47 had ≥0.1% leukemic cells, while the remaining 154 had no detectable leukemic cells. There was an excellent correlation between these results and those obtained with the markers identified in this study (Figure 5A). All 54 specimens with MRD according to the standard method also had MRD by the addi-tional markers, with levels of MRD estimated by the two sets of markers closely matched (Spearman r = 0.9816,
P < 0.0001). Moreover, in 3 samples in which the standard MRD markers failed to detect residual leukemic cells,
the additional markers revealed the presence of 0.10%, 0.19%, and 0.28% leukemic cells (Figure 5A).
To be useful for MRD studies, leukemia markers should persist despite exposure to chemotherapy. To this end, we measured levels of expression in leukemic cells of 27 patients who had MRD ≥0.1% during treatment according to standard flow cytometric methods (Supplemental Table 5). Figure 5B shows data obtained for 6 markers; data for 13 other markers are shown in Supplemental Figure 5. Overall, expression levels remained beyond the threshold of the maximum normal value (or minimum for CD59) plus 1 SD; in only 5 of 175 (2.9%) MRD tests (one each for CD32, CD54, CD59, CD97, and CD366), the marker’s median fluorescence intensity crossed that threshold. Thus, exposure to chemotherapy is unlikely to cause false-negative results in MRD studies with these markers.
Association of the selected markers with AML subtypes. We determined whether expression of the
mark-ers identified in this study was associated with clinically relevant features of AML, including
RUNX1-RUNX1T1, CBFB-MYH11, MLL gene rearrangements, BCR-ABL, NPM1 mutations, FLT3 internal tandem Figure 4. The selected markers persist at relapse and are expressed on phenotypically immature AML cells. (A) Expression of the markers in paired samples collected at diagnosis (D) and at relapse (R). Bars indicate the number of paired samples studied for each marker; gray bars denote samples with aberrant marker expression at both diagnosis and relapse, white bars samples in which the aberrantly expressed marker was present only at relapse, and black bars samples in which the aberrantly expressed marker at diagnosis was not detectable at relapse. (B) Expression of the markers in AML blasts with the CD34+CD38dim/– immunophenotype, in comparison with the more mature CD38bright cell population. Each symbol represents the percentage median
duplications (ITD), monosomy 7, or M7 morphology with or without t(1;22) (p13;q13). We found that aberrant expression of some of the markers was more prevalent in some AML subtypes (Figure 6 and Sup-plemental Figure 6). Thus, among RUNX1-RUNX1T1 cases there was a significantly higher prevalence of CD52 (P < 0.0001 by Fisher’s exact test), CD96 (P = 0.0012), CD200 (P = 0.0002), CD366 (P = 0.0018), and CD371 (P = 0.0029) overexpression, while CD59 (P = 0.0015) and CD300a/c (P < 0.0001) were particularly underexpressed. CBFB-MYH11 cases commonly overexpressed CD54 (P = 0.0009) and CD93 (P = 0.0016);
MLL rearranged cases overexpressed CD18 (P = 0.0009), CD64 (P < 0.0001), and CD68 (P = 0.0090); and FLT3 ITD cases overexpressed CD25 (P = 0.0047). Finally, AML M7 cases with or without t(1;22) (p13;q13)
showed a higher prevalence of CD44 (P < 0.0001) and CD200 (P = 0.0002) underexpression.
The selected markers improve discrimination between leukemia and normal cells. To visualize how the
leuke-mia-associated markers identified in this study could improve the resolution of leukemic and normal cells, we prepared artificial mixtures containing various proportions of AML cells and normal bone marrow mononucleated cells (from 2 healthy donors and 2 MRD-negative children with ALL regenerating after chemotherapy). The individual samples had been labeled with either the most distinctive set of standard markers (CD13, CD133, and CD38) or the most distinctive additional markers (CD9, CD44, and CD54) identified in the AML cells; both standard and additional markers had been combined with CD34, CD117, CD45, and CD33, which identified immature myeloid cells. All flow cytometric files were merged and ana-lyzed by using t-Distributed Stochastic Neighbor Embedding (tSNE) machine-learning algorithm (49). As shown in Figure 7A, the additional markers provided a clear separation between AML and normal cells, whereas these overlapped with the best standard markers.
Next, we used tSNE to visualize data from bone marrow samples collected during therapy from two patients with AML in morphologic remission. In one of the samples, one aliquot was labeled with the 4 best available standard markers (CD38, CD133, CD7, and anti-HLA-Dr) and the other with 2 markers that emerged from this study (CD52 and CD47), in addition to CD34, CD117, CD45 and CD33. As shown in Figure 7B, there was considerable overlap between the cells identified as AML and normal immature myeloid cells, despite the use of 4 standard MRD markers. By contrast, the cell populations were clearly distinct with CD52 and CD47, and MRD 0.05% could be unequivocally identified. The second sample illustrates the advantage of adding CD96 to a standard marker (CD7); addition of CD96 improved the discrimination of MRD, estimated at 0.04% (Figure 7C and Supple-mental Figure 1B).
Finally, we determined the potential sensitivity of MRD detection by using tSNE. Figure 7D shows superimposed data from 10 nonleukemic bone marrow samples and 1 diagnostic AML specimen at differ-ent ratios. After convdiffer-entional gating of CD34, CD33 and CD117 viable single cells, AML cells were clearly distinguishable as a separate cluster, even when they represented only 1 in 100,000 cells; a subsequent anal-ysis of the cluster demonstrated the predicted AML marker profile.
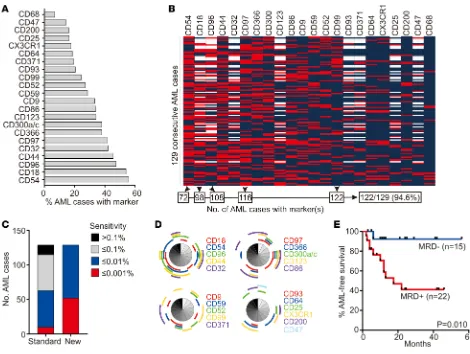
Application of the selected markers for MRD monitoring. The availability of additional markers should allow
MRD studies in patients lacking suitable leukemia-associated immunophenotypes by traditional methods. By improving the resolution of leukemic and normal cells, the sensitivity of the test should also increase. To test these predictions, we applied 8- to 10-antibody panels, including markers identified in this study, to 129 consecutive samples obtained from 118 patients with AML at diagnosis and 11 at relapse. The percent-age of cases expressing each marker and the immunophenotype of the individual cases are summarized in Figure 8, A and B. The additional markers allowed the definition of an aberrant profile for MRD monitor-ing in all 129 cases, while panels composed only of traditional markers (Supplemental Table 5) could not identify an aberrant immunophenotype in 14 (10.8%) of the 129 cases (Figure 8C); the additional markers expressed in each of these 14 cases are shown in Figure 8D. Of note, 5 of the markers were sufficient to allow MRD studies in 122 of the 129 cases (94.6%) (Figure 8C). Possible antibody combinations, including these and other markers, are shown in Supplemental Table 6.
Comparisons between the immunophenotype of AML cells and that of normal hematopoietic cells indi-cated that the markers discovered in this study would allow a sensitivity of MRD detection at a level of 0.01% or better in all 129 cases (0.001% in 52 cases, 40.3%). Sensitivity with the standard markers, however, was limited to 0.1% in 52 (40.3%) and extended to 0.01% in 53 (41.1%) and 0.001% in only 10 (7.8%) (Figure 8C). Hence, the additional markers not only expanded the possibility of MRD studies by flow cytometry, but also
increased their sensitivity overall. It should be noted that at least 10 clustering events are required for MRD recognition (50). Hence, to achieve a sensitivity of 0.001%, at least 1,000,000 mononucleated cells must be available for analysis.
In 37 children and adolescents with AML treated according to the Malaysia-Singapore AML 2006 pro-tocol after the first course of remission induction therapy, we used the additional markers to detect MRD (≥0.01%) in 22 patients while 15 were MRD negative. As shown in Figure 8E, absence of detectable MRD was associated with a significantly more favorable outcome (P = 0.010).
Discussion
Sequential measurement of treatment response and, hence, MRD monitoring are essential for a “precision medicine” approach to the clinical management of AML. The only option to monitor MRD in the majority of patients with AML is flow cytometric detection of markers aberrantly expressed in leukemic cells. The success of this approach depends entirely on the identification of cell marker profiles that are unequivocally distinct from those expressed by normal hematopoietic cells. In this study, we used genome-wide gene expres-sion analysis to uncover differences between AML cells and normal CD34+ myeloid hematopoietic cells,
which are the most challenging cells to distinguish from AML blasts by flow cytometry because of their close
Figure 7. Improved discrimination of AML and normal cells with the additional markers. (A) tSNE analysis of the cell profile of normal bone mar-row CD34, CD117, CD45, and CD33 mononucleated cells from 4 donors (shown in blue) mixed with various proportions of AML cells (shown in red). The percentage of AML cells in each mixture is shown. (B) MRD visualization in bone marrow mononucleated cells from a patient with AML after the first cycle of remission induction chemotherapy. Cells were labeled with either the best available standard markers (CD38, CD133, CD7, and anti-HLA-Dr) or with CD52 and CD47; both sample aliquots were also labeled with CD34, CD117, CD45, and CD33. tSNE was performed on gated myeloid CD34+ cells. The percentage estimated MRD (red contour plots) according to CD52 and CD47 is shown. (C) MRD visualization in bone marrow
mono-nucleated cells from another patient with AML after the second cycle of remission induction chemotherapy. Cells were labeled with CD34, CD117, CD45, and CD33, in combination with CD7 (the best standard marker in this case) and CD96 (see Supplemental Figure 1B for details on the analysis process). The percentage estimated MRD (red contour plots) according to CD7 plus CD96 is shown; histograms illustrate the individual marker expression in normal (blue) versus AML cells (red). (D) tSNE analysis of the cell profile of normal bone marrow CD34+CD33+CD117+ mononucleated
immunophenotypic resemblance (50). The results of this analysis, enriched by genes previously reported to be differentially expressed in leukemic and normal hematopoietic “stem cells,” led us to the identification of 22 promising markers, which reliably detected MRD in follow-up samples of patients with AML. The addition of these markers greatly improved the identification of AML cells in the background of normal hemato-poiesis. With antibody panels targeting these markers, unique leukemia profiles could be defined in all 129 consecutive diagnostic AML samples studied, and the potential sensitivity of MRD detection increased to 1 leukemic cell in 10,000 normal bone marrow cells or greater for all cases. Thus, it is now possible to imple-ment highly sensitive and reliable assays to monitor MRD in all patients with AML.
Leukemia-associated markers currently used for MRD studies in AML had been identified empirical-ly, primarily by observing flow cytometric data obtained during the process of leukemia diagnosis (50). Instead, our starting point was an unbiased and wide-ranging comparison of gene expression in normal and leukemic cells, an approach that had previously led us to discover new markers for MRD studies in ALL (31). It might be argued that differential expression at the mRNA level cannot predict protein expres-sion levels, but the flow cytometric data in our study generally reflected the differences emerging from the gene array comparisons. Mirkowska et al. (51) used mass spectrometry to study protein expression on the surface of ALL cells and amplified leukemic samples through xenograft models to obtain sufficient cell
quantities. It is possible that this approach could also be used to discover new markers for AML. To this end, the data that we generated for gene expression of normal versus leukemic myeloid cells could also be a useful reference for studies attempting to define the surfaceome of AML by mass spectrometry. Although our gene expression analysis relied on a cohort of predominantly pediatric AML, the immunophenotypic aberrations that we observed extended to adult AML cases. We noted, however, that some markers were particularly prevalent in cases with specific genetic features. For example, cases with RUNX1-RUNXT1, an abnormality more common in pediatric than adult AML (52, 53), often had abnormal expression of CD52, CD59, CD96, CD200, CD300a/c, CD366, and CD371, whereas CD25 was more frequently overexpressed in cases with FLT3 ITD, more common in adults (54).
Gene expression differences between normal and leukemic stem cells had been previously noted (42, 43). Our gene expression results and the immunophenotypic studies of cell subsets within the AML populations study suggest that these differences extend to most leukemic cells, regardless of their maturity status. Saito et al. (42) used the immunophenotype CD34+CD38– to sort leukemia stem cells from 21 AML samples;
corre-sponding cells from 5 cord blood or bone marrow samples served as a normal control. Using a similar approach, Kikushige et al. (43) analyzed gene expression of leukemia stem cells from 12 AML samples and 5 normal bone marrow samples. Collectively, the two studies identified 40 genes overexpressed in leukemia stem cells, 35 of which were probed by our HG-U133 array. Surprisingly, all 35 genes were also found to be overexpressed in our analysis. We tested 5 of these by flow cytometry and found that 3 (CD32, CD96, and CD97) were also signifi-cantly overexpressed at the protein level, while CD18 and CD25 were less consistently overexpressed. Another marker recently reported to be associated with leukemia stem cells, CD99 (55), was also overexpressed in AML cells according to both our gene expression analysis and subsequent flow cytometric validation. It is noteworthy that CD99 has been proposed to be a targetable marker for immunotherapy (55), and CD123, another marker overexpressed in our group, is being targeted by antibodies and chimeric antigen receptor–T cells for the treat-ment of AML (47, 56). While our objective was the identification of markers of AML to track MRD, the result-ing data warrant further exploration for targetable markers preferentially expressed in AML cells.
In patients with AML, a better assessment of treatment response should help prediction of relapse and optimization of therapy. Therefore, measuring MRD levels at key points during chemotherapy can steer decisions about intensity of subsequent chemotherapy and eligibility for allogeneic hematopoietic stem cell transplantation (1, 57). Moreover, MRD is likely to become increasingly used as eligibility and response criteria in clinical trials of new anti-AML agents. The markers identified in this study were generally stable during chemotherapy and remained expressed at relapse. MRD levels measured using these markers correlated well with those detectable by standard methods, but our approach significantly improved sensitivity and allowed MRD measurement in all patients. A limitation of MRD monitoring by flow cytometry has been the requirement for an expert operator to interpret the complex patterns. Although MRD monitoring is inherently a specialized task and should be performed by those who are proficient in this task, the combination of the markers identified in this study with contemporary ana-lytical tools should significantly clarify the distinction between normal and leukemic cells and mitigate the risk of incorrect interpretation. Undoubtedly, applying a larger number of markers at diagnosis and during follow-up could add significantly to the costs. It can be argued, however, that the potential gains in applicability, sensitivity, and reliability might well offset these expenses.
Methods
Patients and cells. Bone marrow samples were collected at diagnosis from 370 patients with de novo or
Leukemic and normal mononucleated cells were obtained by centrifugation on a density gradient (AccuPrep, Nycomed) and washed 3 times in PBS. All samples used in the gene expression studies were cryopreserved. To obtain normal myeloid progenitor cells for gene expression analysis, CD19+ B cells
were removed from cryopreserved bone marrow mononucleated cells of 7 healthy donors using a MACS separation system (Miltenyi Biotec). The remaining cells were labeled with anti-CD34 conjugated to phycoerythrin (PE; BD Biosciences) as well as anti-CD13 (from Dako) and anti-CD33 (BD Biosciences), both conjugated to FITC. We then sorted CD34+ cells expressing CD13 and/or CD33 using a MoFlo
fluorescence-activated cell sorter (Cytomation, Beckman Coulter).
Gene expression arrays studies. Gene expression array studies were performed as previously described
(59). Briefly, after isolating total RNA from 157 AML samples and 7 normal myeloid progenitor cell sam-ples using Trizol reagent (Invitrogen), we generated cDNA and prepared biotin-labeled cRNA hybridiza-tion soluhybridiza-tions (Affymetrix). Three of the seven normal myeloid progenitor cell preparahybridiza-tions yielded low RNA and were pooled into one. The solutions were hybridized to HG-U133A oligonucleotide microar-rays (Affymetrix), which were stained with phycoerythrin-conjugated streptavidin. Armicroar-rays were read with a laser confocal scanner (Agilent), with signal values computed using Affymetrix GeneChip Operating Software. AML microarray data are available at http://www.stjuderesearch.org/data/AML1.
Flow cytometric analysis and MRD studies. The antibodies used to determine marker expression by flow
cytometry are listed in Supplemental Table 4. These antibodies were used in combination with anti-CD34 peridinin chlorophyll protein (PerCP), CD117 conjugated to allophycocyanin (APC), CD45 conjugated to APC-H7, and CD33 PE-Cy7 (all from BD Biosciences). Isotype-matched nonreactive antibodies were used as controls. For flow cytometric analysis, mononucleated cells were washed in PBS containing 0.5% bovine serum albumin and 0.5% sodium azide (PBSA), mixed with rabbit serum to block surface Fc receptors, incu-bated with the antibodies for 10 minutes at 20°C in the dark, washed twice in PBSA, and fixed with 0.5% formaldehyde. For intracellular markers, cells were permeabilized and fixed before exposure to antibodies using 8E, a reagent prepared in our laboratory from a proprietary formula. Measurements of antibody label-ing were performed by multiparameter flow cytometry, uslabel-ing an LSRII flow cytometer (BD Biosciences).
Studies of MRD by flow cytometry were performed using combinations of monoclonal antibodies that identified leukemia-associated immunophenotypes determined at diagnosis. Cell staining was essen-tially performed as described above. Data acquisition and analysis were performed as previously described (6, 11, 25) using an LSRII flow cytometer (BD Biosciences) and DIVA (BD Biosciences) and FlowJo (Tree Star) software (Supplemental Figure 1). At least 100,000 viable mononucleated cells (up to 1,000,000) were analyzed in each sample.
Statistics. Unpaired 2-tailed t test with Welch’s correction was used to analyze differences in marker
expression between AML cells and their normal counterparts; P < 0.01 was considered significant. Levels of MRD detected by standard and new markers were analyzed by Spearman’s correlation. Fisher’s exact test was used to determine marker association with different AML subtypes; P < 0.01 was considered significant. Log-rank test was used to compare AML-free survival in patients with or without detectable MRD; P < 0.05 was considered significant.
Study approval. These studies were approved by the National University of Singapore Institutional Review
Board, with informed consent obtained from patients or their guardians.
Author contributions
ECS performed cell sorting and flow cytometric studies with SPC and analyzed all data; GS, SS, and JRD performed and directed gene expression array studies; AEJY, WJC, JER, and CHP led the clinical proto-cols, under which the samples studied were collected and annotated; and DC and ECS initiated the study, analyzed data, and wrote the manuscript with the contribution of all other authors.
Acknowledgments
Address correspondence to: Dario Campana, Department of Paediatrics, Yong Loo Lin School of Med-icine, National University of Singapore, Centre for Translational MedMed-icine, 14 Medical Drive, Level 9 South, Singapore 117599. Phone: 65.6601.2666; Email: paedc@nus.edu.sg.
1. Coustan-Smith E, Campana D. Should evaluation for minimal residual disease be routine in acute myeloid leukemia? Curr Opin
Hematol. 2013;20(2):86–92.
2. Kayser S, Walter RB, Stock W, Schlenk RF. Minimal residual disease in acute myeloid leukemia--current status and future per-spectives. Curr Hematol Malig Rep. 2015;10(2):132–144.
3. Araki D, et al. Allogeneic hematopoietic cell transplantation for acute myeloid leukemia: time to move toward a minimal residu-al disease-based definition of complete remission? J Clin Oncol. 2016;34(4):329–336.
4. Grimwade D, Vyas P, Freeman S. Assessment of minimal residual disease in acute myeloid leukemia. Curr Opin Oncol. 2010;22(6):656–663.
5. Krönke J, et al. Monitoring of minimal residual disease in NPM1-mutated acute myeloid leukemia: a study from the Ger-man-Austrian acute myeloid leukemia study group. J Clin Oncol. 2011;29(19):2709–2716.
6. Inaba H, et al. Comparative analysis of different approaches to measure treatment response in acute myeloid leukemia. J Clin
Oncol. 2012;30(29):3625–3632.
7. Buccisano F, et al. Prognostic and therapeutic implications of minimal residual disease detection in acute myeloid leukemia.
Blood. 2012;119(2):332–341.
8. Terwijn M, et al. High prognostic impact of flow cytometric minimal residual disease detection in acute myeloid leukemia: data from the HOVON/SAKK AML 42A study. J Clin Oncol. 2013;31(31):3889–3897.
9. Walter RB, et al. Significance of minimal residual disease before myeloablative allogeneic hematopoietic cell transplantation for AML in first and second complete remission. Blood. 2013;122(10):1813–1821.
10. Ivey A, et al. Assessment of minimal residual disease in standard-risk AML. N Engl J Med. 2016;374(5):422–433.
11. Taub JW, et al. Improved outcomes for myeloid leukemia of Down syndrome: a report from the Children’s Oncology Group AAML0431 trial. Blood. 2017;129(25):3304–3313.
12. Hourigan CS, Gale RP, Gormley NJ, Ossenkoppele GJ, Walter RB. Measurable residual disease testing in acute myeloid leukae-mia. Leukeleukae-mia. 2017;31(7):1482–1490.
13. Buldini B, et al. Prognostic significance of flow-cytometry evaluation of minimal residual disease in children with acute myeloid leukaemia treated according to the AIEOP-AML 2002/01 study protocol. Br J Haematol. 2017;177(1):116–126.
14. Harrison CJ, et al. Cytogenetics of childhood acute myeloid leukemia: United Kingdom Medical Research Council Treatment trials AML 10 and 12. J Clin Oncol. 2010;28(16):2674–2681.
15. Falini B, et al. Acute myeloid leukemia with mutated nucleophosmin (NPM1): is it a distinct entity? Blood. 2011;117(4):1109–1120. 16. Hollink IH, et al. Favorable prognostic impact of NPM1 gene mutations in childhood acute myeloid leukemia, with emphasis
on cytogenetically normal AML. Leukemia. 2009;23(2):262–270.
17. Lane S, et al. A > or = 1 log rise in RQ-PCR transcript levels defines molecular relapse in core binding factor acute myeloid leu-kemia and predicts subsequent morphologic relapse. Leuk Lymphoma. 2008;49(3):517–523.
18. Yin JA, O’Brien MA, Hills RK, Daly SB, Wheatley K, Burnett AK. Minimal residual disease monitoring by quantitative RT-PCR in core binding factor AML allows risk stratification and predicts relapse: results of the United Kingdom MRC AML-15 trial. Blood. 2012;120(14):2826–2835.
19. Schnittger S, et al. Minimal residual disease levels assessed by NPM1 mutation-specific RQ-PCR provide important prognostic information in AML. Blood. 2009;114(11):2220–2231.
20. Corbacioglu A, et al. Prognostic impact of minimal residual disease in CBFB-MYH11-positive acute myeloid leukemia. J Clin
Oncol. 2010;28(23):3724–3729.
21. San Miguel JF, et al. Early immunophenotypical evaluation of minimal residual disease in acute myeloid leukemia identifies different patient risk groups and may contribute to postinduction treatment stratification. Blood. 2001;98(6):1746–1751. 22. Coustan-Smith E, et al. Clinical significance of residual disease during treatment in childhood acute myeloid leukaemia. Br J
Haematol. 2003;123(2):243–252.
23. MRD-AML-BFM Study Group, et al. Residual disease monitoring in childhood acute myeloid leukemia by multiparameter flow cytometry: the MRD-AML-BFM Study Group. J Clin Oncol. 2006;24(22):3686–3692.
24. Maurillo L, et al. Toward optimization of postremission therapy for residual disease-positive patients with acute myeloid leuke-mia. J Clin Oncol. 2008;26(30):4944–4951.
25. Rubnitz JE, et al. Minimal residual disease-directed therapy for childhood acute myeloid leukaemia: results of the AML02 mul-ticentre trial. Lancet Oncol. 2010;11(6):543–552.
26. van der Velden VH, et al. Clinical significance of flowcytometric minimal residual disease detection in pediatric acute myeloid leukemia patients treated according to the DCOG ANLL97/MRC AML12 protocol. Leukemia. 2010;24(9):1599–1606. 27. Walter RB, et al. Impact of pretransplantation minimal residual disease, as detected by multiparametric flow cytometry, on
out-come of myeloablative hematopoietic cell transplantation for acute myeloid leukemia. J Clin Oncol. 2011;29(9):1190–1197. 28. Inaba H, et al. Comparative analysis of different approaches to measure treatment response in acute myeloid leukemia. J Clin
Oncol. 2012;30(29):3625–3632.
29. Loken MR, et al. Residual disease detected by multidimensional flow cytometry signifies high relapse risk in patients with de novo acute myeloid leukemia: a report from Children’s Oncology Group. Blood. 2012;120(8):1581–1588.
30. Björklund E, Gruber A, Mazur J, Mårtensson A, Hansson M, Porwit A. CD34+ cell subpopulations detected by 8-color flow cytometry in bone marrow and in peripheral blood stem cell collections: application for MRD detection in leukemia patients.
Int J Hematol. 2009;90(3):292–302.
2011;117(23):6267–6276.
32. Roug AS, et al. hMICL and CD123 in combination with a CD45/CD34/CD117 backbone - a universal marker combination for the detection of minimal residual disease in acute myeloid leukaemia. Br J Haematol. 2014;164(2):212–222.
33. Zeijlemaker W, et al. A simple one-tube assay for immunophenotypical quantification of leukemic stem cells in acute myeloid leukemia. Leukemia. 2016;30(2):439–446.
34. Inoue K, et al. Long-term follow-up of minimal residual disease in leukemia patients by monitoring WT1 (Wilms tumor gene) expression levels. Blood. 1996;88(6):2267–2278.
35. Cilloni D, et al. Real-time quantitative polymerase chain reaction detection of minimal residual disease by standardized WT1 assay to enhance risk stratification in acute myeloid leukemia: a European LeukemiaNet study. J Clin Oncol. 2009;27(31):5195–5201. 36. Coustan-Smith E, Behm FG, Hurwitz CA, Rivera GK, Campana D. N-CAM (CD56) expression by CD34+ malignant
myelo-blasts has implications for minimal residual disease detection in acute myeloid leukemia. Leukemia. 1993;7(6):853–858. 37. Campana D, Thompson JS, Amlot P, Brown S, Janossy G. The cytoplasmic expression of CD3 antigens in normal and
malig-nant cells of the T lymphoid lineage. J Immunol. 1987;138(2):648–655.
38. Terstappen LW, et al. Flow cytometric characterization of acute myeloid leukemia. Part II. Phenotypic heterogeneity at diagno-sis. Leukemia. 1992;6(1):70–80.
39. Macedo A, et al. Characterization of aberrant phenotypes in acute myeloblastic leukemia. Ann Hematol. 1995;70(4):189–194. 40. Smith FO, et al. Expression of lymphoid-associated cell surface antigens by childhood acute myeloid leukemia cells lacks
prog-nostic significance. Blood. 1992;79(9):2415–2422.
41. Terstappen LW, et al. Flow cytometric characterization of acute myeloid leukemia: IV. Comparison to the differentiation path-way of normal hematopoietic progenitor cells. Leukemia. 1992;6(10):993–1000.
42. Saito Y, et al. Identification of therapeutic targets for quiescent, chemotherapy-resistant human leukemia stem cells. Sci Transl
Med. 2010;2(17):17ra9.
43. Kikushige Y, et al. TIM-3 is a promising target to selectively kill acute myeloid leukemia stem cells. Cell Stem Cell. 2010;7(6):708–717. 44. Campana D, Coustan-Smith E, Janossy G. The immunologic detection of minimal residual disease in acute leukemia. Blood.
1990;76(1):163–171.
45. Venditti A, et al. Level of minimal residual disease after consolidation therapy predicts outcome in acute myeloid leukemia.
Blood. 2000;96(12):3948–3952.
46. Majeti R, et al. CD47 is an adverse prognostic factor and therapeutic antibody target on human acute myeloid leukemia stem cells. Cell. 2009;138(2):286–299.
47. Jin L, et al. Monoclonal antibody-mediated targeting of CD123, IL-3 receptor alpha chain, eliminates human acute myeloid leukemic stem cells. Cell Stem Cell. 2009;5(1):31–42.
48. van Rhenen A, et al. The novel AML stem cell associated antigen CLL-1 aids in discrimination between normal and leukemic stem cells. Blood. 2007;110(7):2659–2666.
49. van der Maaten L, Hinton G. Visualizing data using t-SNE. J Mach Learn Res. 2008;9:2579–2605.
50. Campana D, Coustan-Smith E. Detection of minimal residual disease in acute leukemia by flow cytometry. Cytometry. 1999;38(4):139–152.
51. Mirkowska P, et al. Leukemia surfaceome analysis reveals new disease-associated features. Blood. 2013;121(25):e149–e159. 52. Rubnitz JE, Inaba H. Childhood acute myeloid leukaemia. Br J Haematol. 2012;159(3):259–276.
53. Döhner H, et al. Diagnosis and management of AML in adults: 2017 ELN recommendations from an international expert panel. Blood. 2017;129(4):424–447.
54. Levis M. FLT3 mutations in acute myeloid leukemia: what is the best approach in 2013? Hematology Am Soc Hematol Educ
Pro-gram. 2013;2013:220–226.
55. Chung SS, et al. CD99 is a therapeutic target on disease stem cells in myeloid malignancies. Sci Transl Med. 2017;9(374):eaaj2025.
56. Mardiros A, Forman SJ, Budde LE. T cells expressing CD123 chimeric antigen receptors for treatment of acute myeloid leuke-mia. Curr Opin Hematol. 2015;22(6):484–488.
57. Kayser S, Schlenk RF, Grimwade D, Yosuico VE, Walter RB. Minimal residual disease-directed therapy in acute myeloid leuke-mia. Blood. 2015;125(15):2331–2335.
58. Stevens RF, Hann IM, Wheatley K, Gray RG. Marked improvements in outcome with chemotherapy alone in paediatric acute myeloid leukemia: results of the United Kingdom Medical Research Council’s 10th AML trial. MRC Childhood Leukaemia Working Party. Br J Haematol. 1998;101(1):130–140.
59. Ross ME, et al. Classification of pediatric acute lymphoblastic leukemia by gene expression profiling. Blood. 2003;102(8):2951–2959. 60. Roederer M, Nozzi JL, Nason MC. SPICE: exploration and analysis of post-cytometric complex multivariate datasets.