*Corresponding author:Sangeeta Pandey ISSN: 0976-3031
Research Article
IMPACT OF NUTRITION EDUCATION ON KNOWLEDGE ATTITUDE AND PRACTICE
REGARDING FOOD SAFETY AMONG THE SCHOOL CHILDREN (10-12YEARS)
Qurathulain, and *Sangeeta Pandey
Department of Nutrition and Dietetics, Mount Carmel College, Autonomous, Bengaluru, Karnataka, India
DOI: http://dx.doi.org/10.24327/ijrsr.2019.1005.3498
ARTICLE INFO ABSTRACT
Increased risk of food borne illness among school children is observed due to lack of food safety awareness that leads to diseases like diarrhoea, vomiting and upper respiratory tract infection. It is important to educate children about food safety to bring in a positive change in their attitude and practice towards food safety. The overall aim was to study the effectiveness of nutrition education program on food safety among school children. Purposive random sampling was used and students belonging to the age group of 10-12 years studying in government schools were selected (n=200). Information regarding demographic data and food safety related knowledge, attitude and practice was collected using a pre-structured questionnaire. Nutrition Education Program was imparted and knowledge, attitude and practice regarding food safety was assessed. Knowledge on food safety was assessed pre and post-intervention, the mean score of knowledge on food safety during pre-intervention was 6.14±2.20 and post-pre-intervention was 11.10±0.99. There was significant (p<0.05) improvement observed regarding knowledge on food safety post-intervention. Similarly, mean score of attitude on food safety before intervention and post intervention were 7.54±1.97 and 11.06±1.05 respectively. Significant (p<0.05) improvement was observed also in the attitude of the subjects post-intervention. Whereas mean food safety practice scores pre-intervention and post-intervention were 5.89±1.43 and 11.69 ±1.29 respectively, which showed a significant(p<0.05) improvement towards the food safety practice of the study subjects post intervention confirms the positive impact of intervention programme. It is viable and effective to improve food safety knowledge among school students through school-based nutrition education programs.
INTRODUCTION
According to Food and Agriculture Organization (FAO), food safety is defined as the degree of confidence that food will not cause sickness or harm to the consumer when it has been prepared, served and eaten according to the intended use (WHO, 2003). However, food illnesses are defined as diseases, usually either infectious or toxic in nature, caused by agents that enter the body through the ingestion of food (WHO, 2007). World Health Organization, also states that foodborne and waterborne diarrheal diseases kill an estimated 2 million people annually, mostly children and particularly in developing countries. Food safety education for children is thought to be essential for development of proper practices of food handling (Haapala and Probert, 2004; Youatt et al., 1996). Teaching food hygiene in schools could be an effective way to reach out to all the family members as students share knowledge on correct practices at home(Egan et al.,2008).
METHODOLOGY
A cross- sectional study was conducted on 200 government school children belonging to the age group of 10-12 years. A nutrition intervention program was designed and imparted to the school children. The study was conducted in three phases. In the 1st phase a pre- structured questionnaire was used to collect the data . The 2ndphase was designed to impart the food safety education to improve the subjects knowledge, attitude and practice towards food safety and the 3rd phase dealt with assessing the impact of the food safety intervention on the study subjects. The pre evaluation and the post- evaluation questionnaire incorporated information on socio economic status, nutritional status, knowledge, attitude and practice regarding food safety.Variousself-developed teaching aids were used to impart nutrition education to the children. These aids were designed to teach and interact with students, various aids like visual aids, activity logs, demonstrations, card game and self-developed module wereused to provide knowledge on food
Available Online at http://www.recentscientific.com
International Journal of
Recent Scientific
Research
International Journal of Recent Scientific Research
Vol. 10, Issue, 05(F), pp. 32563-32567, May, 2019
Copyright © Qurathulain, and Sangeeta Pandey, 2019, this is an open-access article distributed under the terms of the Creative Commons Attribution License, which permits unrestricted use, distribution and reproduction in any medium, provided the original work is properly cited.
DOI: 10.24327/IJRSR
CODEN: IJRSFP (USA)
Article History:
Received 6th February, 2019
Received in revised form 15th March, 2019
Accepted 12th April, 2019 Published online 28th May, 2019
Key Words:
safety,keeping food safe, foodborne illness,prevention of foodborne illness, hygiene and sanitation.
RESULTS AND DISCUSSION
The observation from table 1 indicates socio
of the study subjects .It shows that there were 42% of boys and 40% of girls in the age group of 9-10 years, 27% boys and 20 % girls of 10-11 years and 31% boys and 40% girls in the age group of 11- 12 years respectively.
Table 1 Age wise and gender wise distribution of the study subjects
Characteristics Category
Respondents
Boys Girls
N % N %
Age group
9- 10 years 42 42.0 40 40.0
10-11 years 27 27.0 20 20.0
11- 12 years 31 31.0 40 40.0
Total 100 100.0 100 100.0
NS : Non-significant
Fig 1 Food Habits Of Study Subjects
According to the food habits (Fig 1) of the study subjects 49% of boys and 59% of girls were non- vegetarian, where as 29% of the study subjects were vegetarian (30% were boys and were girls). Similarly 19% of the study subjects were ovo vegetarian out of which 21% were boys and 17% were girls.
From the above table 2 it was observed that 70 % of the male study subjects lived in a nuclear family 71% female subjects live in nuclear family, whereas 28% of boys and 22% of girls
vegetarian 29% Non-vegetarian 52% Ovo-vegetarian 19% food habits
Table 2 Demographic Data of Family
Characteristics Category
Respondents
Boys Girls
N % N %
Type of family
Nuclear 70 70.0 71 71.0
Joint 2 2.0 7 7.0
Extended 28 28.0 22 22.0
Family members
3--4 47 47.0 44 44.0
5--6 25 25.0 31 31.0
7+ 28 28.0 25 25.0
Religion
Hindu 54 54.0 55 55.0
Muslim 31 31.0 26 26.0
Christian 15 15.0 19 19.0
Total 100 100.0 100 100.0
safety,keeping food safe, foodborne illness,prevention of
The observation from table 1 indicates socio-economic status were 42% of boys and 10 years, 27% boys and 20 11 years and 31% boys and 40% girls in the age
Age wise and gender wise distribution of the study
Respondents
' χ2 ' Test Total
N %
40.0 82 41.0
2.23 NS
20.0 47 23.5
40.0 71 35.5
100.0 200 100.0
Food Habits Of Study Subjects
According to the food habits (Fig 1) of the study subjects 49% vegetarian, where as 29% of the study subjects were vegetarian (30% were boys and 29% were girls). Similarly 19% of the study subjects were ovo-vegetarian out of which 21% were boys and 17% were girls.
From the above table 2 it was observed that 70 % of the male study subjects lived in a nuclear family 71% female subjects live in nuclear family, whereas 28% of boys and 22% of girls
stayed in an extended family. Only 2% of boys and 7% of girls lived in joint family
Classification according to the number of family members shows that 45% of the study subjects lived in a family of 3 members out of which 47% were boys and 44% were girls, whereas 25% of boys and 31% of girls stayed in a family of 5 family members and only 28% boys and 25% girls lived in a family of more than 7 members.
Out of total 200 study subjects 54 % of them were Hindus out of which 54% were boys and 55% were girls, whereas 28% of the study subjects were Muslims out of which
and 26% were girls and 17% of the study subjects were Christians out of which 15% of them were boys and 19% of them were girls.
Fig 2 Classification of study subjects according to Body mass index (WHO 2007)
Figure 2 reveals that out of
subject were severely underweight (64% were boys and 64% were girls ) and had a BMI of less than 16.0, whereas 14 % of the study subjects were in the category of moderately underweight (15% were boys and 13% girls ) who had between 16.0-16.9. Similarly 16% of the study subjects were mild underweight (17% were boys and 15% were girls) whose BMI was between 17.0-18.4. Only 6% of the study subjects were in the normal category (4% were boys and 8% were girls ) and had BMI between 18.5-22.9.
Similar results were observed in a study conducted in Karnataka by Kamath et al
nutritional status of school children in Bellary district in the year 2015, the study was conducted on 27,544 students out of which 49% were males and 50.9% were females. The nutritional status was assessed using the body mass index, Z score and WHO multicentre growth reference chart, the data obtained was statistically analysed which indicated that 16% of the study subjects were found to be undernourished. Majority of the male study subjects(16.9%) were found to be undernourished but obesity was more prevalent in female study subjects(12.3%). According to a study conducted in 2018 ,subjects between the age group of 10
weight 32.95±6.26 and the age group between 11
mean weight of 32.73±4.78 in the children receiving Government Mid Day Meal . On the other hand subjects receiving Non Government Mid Day Meal had mean weight of
vegetarian Non- vegetarian Ovo-vegetarian 0.0 10.0 20.0 30.0 40.0 50.0 60.0 70.0 64.0 15.0 64.0 Respondent s (% )
Body Mass Index
Boys
Demographic Data of Family and Religion
Respondents
' χ2 ' Test Total
N %
141 70.5
3.51 NS
9 4.5
50 25.0
91 45.5
0.91 NS
56 28.0
53 26.5
109 54.5
0.92 NS
57 28.5
34 17.0
200 100.0
stayed in an extended family. Only 2% of boys and 7% of Classification according to the number of family members shows that 45% of the study subjects lived in a family of 3-4 members out of which 47% were boys and 44% were girls, whereas 25% of boys and 31% of girls stayed in a family of 5-6 family members and only 28% boys and 25% girls lived in a family of more than 7 members.
Out of total 200 study subjects 54 % of them were Hindus out of which 54% were boys and 55% were girls, whereas 28% of the study subjects were Muslims out of which 31% were boys and 26% were girls and 17% of the study subjects were Christians out of which 15% of them were boys and 19% of
Classification of study subjects according to Body mass index (WHO- 2007)
Figure 2 reveals that out of 200 study subjects 64% of the subject were severely underweight (64% were boys and 64% were girls ) and had a BMI of less than 16.0, whereas 14 % of the study subjects were in the category of moderately underweight (15% were boys and 13% girls ) who had BMI 16.9. Similarly 16% of the study subjects were mild underweight (17% were boys and 15% were girls) whose 18.4. Only 6% of the study subjects were in the normal category (4% were boys and 8% were girls )
22.9.
Similar results were observed in a study conducted in et al.,(2015) which assessed the nutritional status of school children in Bellary district in the year 2015, the study was conducted on 27,544 students out of hich 49% were males and 50.9% were females. The nutritional status was assessed using the body mass index, Z- score and WHO multicentre growth reference chart, the data obtained was statistically analysed which indicated that 16% of found to be undernourished. Majority of the male study subjects(16.9%) were found to be undernourished but obesity was more prevalent in female study subjects(12.3%). According to a study conducted in 2018 ,subjects between the age group of 10-11 years had mean weight 32.95±6.26 and the age group between 11-12 years had mean weight of 32.73±4.78 in the children receiving Government Mid Day Meal . On the other hand subjects receiving Non Government Mid Day Meal had mean weight of
15.0 17.0
4.0
13.0 15.0
8.0
Body Mass Index
International Journal of Recent Scientific Research Vol. 10, Issue, 05(F), pp. 32563-32567, May, 2019
37.38±6.41 and 37.62±6.90 in the age group of 10-11 and 11-12 years, respectively. (Pandey,2018).
Table 3shows the percentages of correct and incorrect responses of the study subjects pre-intervention and post- intervention regarding their knowledge on food safety. Information was collected using questionnaire cum interview method. The data stated that most of the statements have shown correct response after the post intervention.
Similarly to examine the level of food safety knowledge and practice among two secondary schools a study was conducted in Malaysia. The information was collected using a self-administered questionnaire, the data obtained was statistically analysed which stated that knowledge on food safety was good (79.1% ) for both schools and they also practiced food safety which included in good practice range. The results also indicated that a high level of food safety and practices was possessed by both groups, male and female students in quite similar value of means. There was a positive correlation observed (p<0.05) between food safety knowledge and practice (Norazmir et al., 2012).
Table 3 Knowledge of study subjects on Food safety
Statements
Response (%) Pre Test Post Test
No Yes No Yes
Know that food should be purchased from a
clean and neat place 18 82 5 95
Food should be checked thoroughly before
purchasing 37 63 4 96
Do you know that checking the expiry date of
packaged food is necessary 89 11 12 88
Segregating the vegetarian food from the non-vegetarian food before storing is
necessary
86 14 10 90
Know that
a) Cereals and pulses are stored in dry place 21 79 4 96
b) Milk and eggs are stored in the refrigerator 55 45 6 94
c) Meat and fish is stored in the freezer. 52 48 4 96
The best method for storing cooked food
Refrigerate them 45 55 4 96
Know that raw fruits and vegetables should be washed with running water and cleaned
before using
21 79 5 95
Know that food should be cooked with clean
potable water? 43 57 6 94
Know that the utensils used for cooking and
serving should be sterilised regularly 92 8 15 85
Know that it is important to keep the Food
covered all the time 27 73 6 94
Whereas table 4 showsoverall mean score of the study subjects regarding knowledge of food safety pre and post-intervention.The mean score on knowledge regarding food
safety in boys during pre-intervention was 5.94±2.38 and post-intervention 11.24±1.00,
which showed that there was a significant difference (p<0.05) observed regarding the knowledge on food safety among the male study subjects post Nutrition Education Programme (NEP). Similarly, the mean food safety knowledge score for girls during pre-intervention was 6.34±2.02 and after nutrition education was imparted the mean score was 11.14±0.99 .Significant difference(p<0.05) was observed regarding the food safety knowledge among the female subjects post NEP. The overall mean score of the study subjects regarding knowledge on food safety during pre- intervention and post-intervention was 6.14±2.20 and 11.10±0.99 respectively, there was a significant (p<0.05) improvement observed on the knowledge on food safety among the study subjects post- nutrition intervention.
A study observed the effectiveness of a school based nutrition and food safety education among primary and junior high school children was conducted in China. The nutrition education program was carried out for nine months, the study subjects were divided into two groups the intervention group and the control group. The knowledge score for the intervention group were 9.03±2.75 pre-intervention and 14.70±3.28 post-intervention, which showed a significant improvement (p<0.01). Whereas, the knowledge score of the control group were 12.35±2.86 which were comparatively lower(p<0.01) than the intervention group. The control group had no significant difference in the pre and post nutrition intervention. The study concluded stating that it is effective to improve nutrition and food safety knowledge among school children through school based nutrition and food safety education program (Zhou et al., 2014).
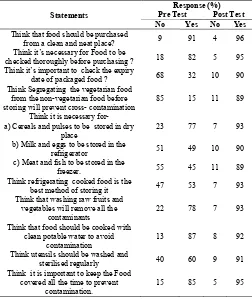
Table 5 shows the percentages of correct and incorrect responses of the study subjects pre- and post- intervention regarding their attitude towards food safety.Respose of the study subjects on the knowledge regarding the food safety shows increase in the correct responses post intervention. Whereas table 6shows that the food safety attitude score of the male subjects pre and post-intervention was 7.62±2.03 and 11.10±1.13 respectively, this indicated that there was a significant difference (p<0.05) post-intervention.
Similarly, the mean score of the female study subjects on attitude towards food safety pre-intervention and post-intervention was 7.46±1.92 and 11.02± 0.98 respectively depicting a significant difference(p<0.05) post- intervention. Table 4 Mean Knowledge scores of study subjects on Food safety
Gender Sample (n) Statements Max. Score Aspect Knowledge Scores Paired
't' Test
Mean SD Mean (%) SD(%)
Boys 50 12 12
Pre test 5.94 2.38 49.5 19.8
18.71*
Post test 11.24 1.00 93.7 8.3
Difference 5.30 2.00 44.2 16.7
Girls 50 12 12
Pre test 6.34 2.02 52.8 16.8
19.37*
Post test 11.14 0.99 92.8 8.2
Difference 4.80 1.75 40.0 14.6
Combined 100 12 12
Pre test 6.14 2.20 51.2 18.4
26.82*
Post test 11.10 0.99 93.3 8.3
Difference 5.05 1.89 42.1 15.7
The overall mean score of the study subjects before and after NEP was 7.54±1.97 and 11.06±1.05 respectively, which indicated that there was a significant improvement in attitude regarding food safety was (p<0.05) observed post-intervention. An educational program on food safety measures among primary school students was implemented and its effectiveness was evaluated. A total of 152 students studying in 6th grade were recruited, the data was collected using a questionnaire which consisted of socio-demographic characteristics, past medical history in addition to students knowledge and practice pre-intervention. The nutrition education program was imparted and it was observed that there was a highly statistical significant improvement among the students satisfactory knowledge, attitude and practice regarding safety food measures at the post-educational test when compared to the pre-intervention (p<0.001)( Nawal et al., 2018).
Table 5 Attitude of study subjects regarding Food safety
Statements
Response (%)
Pre Test Post Test
No Yes No Yes
Think that food should be purchased
from a clean and neat place? 9 91 4 96
Think it’s necessary for Food to be
checked thoroughly before purchasing ? 18 82 5 95
Think it’s important to check the expiry
date of packaged food ? 68 32 10 90
Think Segregating the vegetarian food from the non-vegetarian food before storing will prevent cross- contamination
85 15 11 89
Think it is necessary for- a) Cereals and pulses to be stored in dry
place
23 77 7 93
b) Milk and eggs to be stored in the
refrigerator 51 49 10 90
c) Meat and fish to be stored in the
freezer. 55 45 11 89
Think refrigerating cooked food is the
best method of storing it 47 53 7 93
Think that washing raw fruits and vegetables will remove all the
contaminants
22 78 7 93
Think that food should be cooked with clean potable water to avoid
contamination
13 87 8 92
Think utensils should be washed and
sterilised regularly 40 60 9 91
Think it is important to keep the Food covered all the time to prevent
contamination.
15 85 5 95
Similarly in turkey a study was conducted on food safety knowledge, attitude and food handling practices of the university students in turkey. It was found that there was
statistical significant difference between male and female participants on total food safety knowledge, attitude and practice scores. In addition, there was a statistically significant difference between the three institution as well. The study was concluded by stating that there is a need to assess the food safety knowledge, attitude and food handling practice of the target group as they are more likely to engage in risky eating behaviour as well as food handling practices which can make them more susceptible to food borne illnesses (Sanlier et al., 2010).
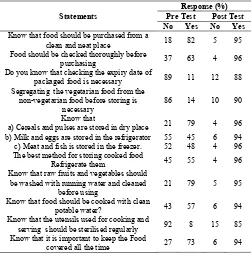
Table 7 shows the responses of the study subjects pre and post- intervention regarding their practice towards food safety.It was observed that there was not much changes in the practice regarding buying food sold covered and food left at room temperature.
Table 7 Practice of study subjects towards Food safety
Statements
Response (%) Pre Test Post Test
No Yes No Yes
Purchasing food do you check the safety logo 88 12 14 86
Wash fresh vegetables and fruits in tap water
before eating? 13 87 5 95
Eat cooked food left at room temperature for over
4 hrs without sufficient heating? 16 84 96 4
Buy food that is sold covered from the vendors 5 95 98 2
Sterilise your utensils with hot water regularly 81 19 13 87
Store vegetarian and non- vegetarian food
separately 83 17 15 85
Boil the water before drinking 83 17 16 84
Cook food with filtered water 58 42 10 90
Storing Cereals and pulses in Room temperature 14 86 4 96
Storing Fruits except banana in Cool Places 68 32 11 89
Storing Ice-cream in Freezer 25 75 9 91
Storing Canned foods in Refrigerators 91 9 18 82
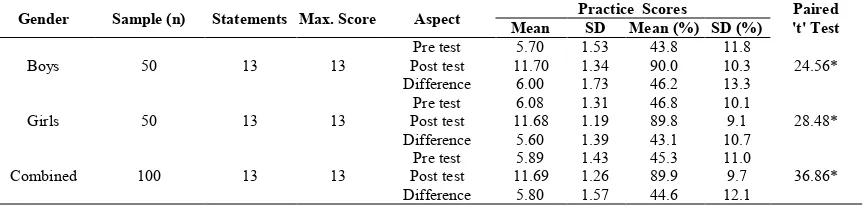
Table 8 shows the mean scores for food safety practice among the study subjects .It was observed that the mean score for practice of food safety among the male subjects pre- intervention was 5.70±1.53 and post-intervention was 11.70±1.34, There was a significant(p<0.05) improvement observed in post-intervention. Similarly the food safety practice score for the female study subjects were 6.08±1.31 and 11.68±1.19 pre-intervention and post-intervention respectively.
The overall mean score of the study subjects regarding food safety practice pre- intervention and post- intervention was 5.89±1.43 and 11.69±1.26 respectively. Hence there was a Table 6 Mean Attitude Score of study subjects on Food safety
Gender Sample (n) Statements Max.
Score Aspect
Attitude Scores Paired
't' Test
Mean SD Mean(%) SD(%)
Boys 50 12 12
Pre test 7.62 2.03 62.5 16.9
15.65*
Post test 11.10 1.13 92.5 9.4
Difference 3.48 1.57 29.0 13.1
Girls 50 12 12
Pre test 7.46 1.92 62.2 16.0
15.44*
Post test 11.02 0.98 91.8 8.2
Difference 3.56 1.63 29.7 13.6
Combined 100 12 12
Pre test 7.54 1.97 62.8 16.9
22.03*
Post test 11.06 1.05 92.2 8.8
Difference 3.52 1.59 29.3 13.3
International Journal of Recent Scientific Research Vol. 10, Issue, 05(F), pp. 32563-32567, May, 2019
significant improvement ( p<0.05) observed post-NEP. In Korea a study was conducted on 4th to 6th grade elementary school students, to determine their readiness to change their food safety behaviour and to compare their food safety knowledge and practices by the three different stages of change. The subjects were divided into three different stages of change; the percentage of change in stage 1 (precontemplation) was 10.1%, the percentage of change in stage 2 (contemplation and preparation) was 62.4%, and the percentage of change in stage 3 (action and maintenance) was 27.5%. Food safety knowledge scores in stage 3 (4.55) and stage 2 (4.50) children were significantly higher than those in stage 1 children (4.17) (P<0.05). The two food safety behaviour items “hand washing practice” and “avoidance of harmful food” were significantly different among the three groups (P<0.05). The three stages of change were significantly and positively correlated with food safety knowledge and practice. Age was also significantly and negatively correlated with the total food safety behaviour score (r=-0.142, P<0.05). The most influential factor on the stage of change was a mother’s instruction about food safety (P<0.01) (Kang et al., 2010).
To assess the food safety knowledge and practice of school students in 8 schools similar study was conducted in Abu Dhabi, United Arabs Emirates. The results indicated that only 4 out of 8 schools used appropriate cooling temperatures to store their food, six out of eight schools did not clean their refrigerator regularly. It was also observed that 37.5% of the respondents did not wash their hands after using the toilet, this behavior could expose the students to bacterial food contamination by micro-organisms like salmonella and staphylococcus, which could thereby result in foodborne illnesses. The study concluded stating that not only the students but the food handlers and the parents need to be educated about food safety and food hygiene in order to prevent foodborne illness and this could be done through effective food safety education (Abushelaibi et al., 2016).
CONCLUSION
Finding of the study concludes that there was improvement in knowledge, attitude and practice regarding food safety from the pre and post-intervention among the school children. Hence it is viable and effective to improve food safety knowledge among school students through school-based nutrition education programs which can be implemented at an early age in order to reduce and prevent the incidents of foodborne illness.
Reference
Abushelaibi, A., Jobe, B., Al Dhanhani, F., Al Mansoori, S., & Al Shamsi, F. (2016). An overview of food safety knowledge and practices in selected schools in the city of Al Ain, United Arab Emirates. African Journal of Microbiology Research, 10(15), 511-520.
Egan MB, Bielby G, Eves A, Lumbers ML, Raats MM, Adams MR. Food hygiene education in UK secondary schools: A nationwide survey of teachers’ views. Health Educ J 2008; 67:110–120.
Haapala I, Probart C. 2004. Food safety knowledge, perceptions, and behaviors among middle school students. J Nutr Educ Behav 36:71–6.
Kamath, R., Jakkula, R. P., & Kumar, S. (2015). Nutritional status assessment of school children in Bellary district, Karnataka. Journal of Dr. NTR University of Health Sciences, 4(1), 13.
Kang, N. E., Kim, J. H., Kim, Y. S., & Ha, A. W. (2010). Food safety knowledge and practice by the stages of change model in school children. Nutrition research and practice, 4(6), 535-540.
sss
Nawal, M. Soliman. “Educational Program On Safety Food Measures Among Primary School Students.” IOSR Journal of Nursing and Health Science (IOSR-JNHS), vol. 7, no.3, 2018, pp. 06-15.
Norazmir, M. N., Hasyimah, M. N., Shafurah, A. S., Sabariah, B. S., Ajau, D., & Norazlanshah, H. (2012). Knowledge and practices on food safety among secondary school students in Johor Bahru, Johor, Malaysia. Pakistan Journal of Nutrition, 11(2), 110.
Sangeeta Pandey and Rubal Gupta (2018) .Dietary adequacy and nutritional assessment of children receiving government and non- government mid-day meal . International Journal of scientific Research, 7 (12) ,14-16. Sanlier, N., & Konaklioglu, E. (2012). Food safety knowledge,
attitude and food handling practices of students. British Food Journal, 114(4), 469-480.
World Health Organization (WHO), 2003. Food Safety Issues: Gems/Food Regional Diets, 1-27.
World Health Organization (WHO), 2007. Food Safety and Foodborne Illness. Fact sheets Nº237.
Youatt J, Andrews S, Hammerschmidt, P, Sawyer C, Murphy A. RISK Raiders: A food safety hypermedia software game for students (Grades 3-5). J Nutr Educ 1996;28:181A Zhou, W. J., Xu, X. L., Li, G., Sharma, M., Qie, Y. L., & Zhao,
Y. (2016). Effectiveness of a school-based nutrition and food safety education program among primary and junior high school students in Chongqing, China. Global health promotion, 23(1), 37-49.
Table 8 Mean Practice Score Of Study Subjects On Food Safety
Gender Sample (n) Statements Max. Score Aspect Practice Scores Paired
't' Test
Mean SD Mean (%) SD (%)
Boys 50 13 13
Pre test 5.70 1.53 43.8 11.8
24.56*
Post test 11.70 1.34 90.0 10.3
Difference 6.00 1.73 46.2 13.3
Girls 50 13 13
Pre test 6.08 1.31 46.8 10.1
28.48*
Post test 11.68 1.19 89.8 9.1
Difference 5.60 1.39 43.1 10.7
Combined 100 13 13
Pre test 5.89 1.43 45.3 11.0
36.86*
Post test 11.69 1.26 89.9 9.7
Difference 5.80 1.57 44.6 12.1