Altitude measurement using laser beam reflected from
water surface
Sh. Mohammad Nejad and M. H. Haji Mirsaeidi
Abstract: In this paper altitude measurement from water surface using laser beam is presented. Research data indicate that the reflection of infrared waves from water surface is about zero and it is less than 2% for visible radiations. Phase-shift and heterodyne
technique was used for the measurement, and the laser beam (l=700nm,p=10mW) was
modulated by a sine wave having a fixed frequency. The optimum design and low-noise elements made it possible to detect a light power about 20 nW at operating frequency.
Keywords: laser altimeter, phase shift, heterodyne technique, water surface.
1 Introduction1
Altitude measurement by laser beam has a variety of applications in industry, military and navigation. The vast applications of laser altimeter are in GPS, informational and recognition satellites, altimetry for recognition and topographic planes and altimeter for cruise missiles.
There are several different methods for measuring altitudes by laser beam. A famous method called pulse, or direct time-of-flight measurement [1-2], in which the laser is derived by a narrow pulse, and the round trip time of the transmitting and receiving pulse is measured. According to the measured time, the altitude is obtained. Another method called FMCW [3], is based on frequency modulation. However, in this work, we have used the phase-shift method [4-6], the details of which will be presented hereafter.
An important parameter of measuring the altitude is the laser beam reflection from the target. The directional distribution of the radiation is also a decisive factor. The detailed explanation of these parameters and the water surface response to the laser beam will also be presented in the followings.
2 Water surface response to the laser beam
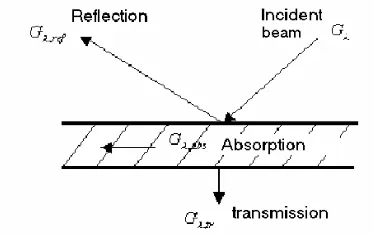
Figure 1 shows a beam, Gl, incident on an object,
which is then divided into reflection,(Gl,ref),
absorption, (Gl,abs) ,and transmission, (Gl,tr), rays.
Therefore,
tr , abs , ref
, G G
G
Gl= l + l + l (1)
If we denote ρ, α , and τ as the reflection, absorption
and transmission coefficients respectively, then for any wavelength,
1 = t + a +
rl l l (2)
According to the beam reflection phenomena, surfaces are divided into two groups, namely; diffuse and specula (fig.2). Diffuse reflection happens when intensity of the reflected radiation, regardless of the direction of the incident beam, is independent of the reflection angle. However, if the whole reflection is
directed toward q2, (which is equal to the incident
Iranian Journal of Electrical & Electronic Engineering, 2005. Paper first received 7th July 2003 and in revised from 11th October 2003.
Sh. Mohammad Nejad and M. H. Haji Mirsaeidi are with the Department of Electrical Engineering, Iran University of Science and Technology, Narmak, Tehran 16844, Iran.
angle,q1), the reflection is specula. Although, there is
no surface to be completely diffuse or specula, however, polished and liquid surfaces are considered as nearly specula, and rough surfaces are nearly diffuse. In engineering applications however, most surfaces are assumed to be diffuse.
Fig. 1 Reflection, absorption and transmission of an incident beam on an object.
The presence of other materials in water also effects its properties. This is an important subject for sweet and sea waters. The sea water has a lot of unsolved salts. Although the salts do not effect the absorption spectrum, but their scattering is 30% more than the sweet water. When these materials are acted upon by a light beam, the fields and intrinsic optical properties are altered as a function of particle distribution. For any material such as water, the relation between absorption
coefficient a(l) and the imaginary part of complex
index of refraction k(l) is,
l l p = l
a( ) 4 k( ) (3)
The variation of k(l) with l is shown in Figure (3).
The term n(l) is the real part of thecomplex
index of refraction. The main point is that the )
(
kl decreases from ultraviolet to visible region and
then sharply increases at infrared region.
The knowledge of pure and sea water properties, allows us to distinguish between shallow and deep levels. These properties also limit the discovery and measuring by visible region of the light. Distinction of shallow water is seriously limited at green and blue regions. In other words, absorption is high at the two sides of red and blue regions. Hence, it is necessary to use green and blue lights to finding the depth.
Fig. 2 Reflections, (a) diffuse, (b) specula.
Fig. 3 Real and imaginary parts of refraction index of pure water versus wavelength [6].
The ultraviolet and infrared Reflection coefficient from water is nearly zero, and for visible light is less than 2%. Therefore, at most cases one could neglect the reflection coefficient in comparison to the absorption
and transmission coefficients. Omitting r in equation
(2) results a+t=1. The transmission coefficient for
green and blue wavelengths are then maximum. Except for blue (and green) light, all other wavelengths are absorbed when passing the water depth. Since blue (and green) lights can reach to the sea bottom and reflect, one can use these wavelengths to measuring the depth. Different water categories, namely, limpid, muddy, static, wavy, deep and shallow waters have different reflection coefficients. In figure 4, full dots represent the reflection coefficients for shallow and blank ones are for deep water surfaces respectively. According to the figure, green and blue wavelengths have the highest reflections. However, in laser altimetry, green and blue wavelengths are not suitable, because in addition to the water surface reflection, they are also reflected by seabed and the resultant interference of the two reflected signals cause errors. Hence, red laser beam is the best for altimetry from water surface, and blue (or green) is suitable for water depth measurements.
Water is a specula reflector and reflects radiation at
angle 180o-a. Still water is a weak reflector and wavy
water (such as the sea water), behaves nearly as a diffuse surface and is considered as good reflector.
Experiments prove that suspended sands will increase the reflection coefficient by 10%. This property is often used in planes and satellites to distinguish suspended objects and measure the altitudes from water surface.
In figure 5, the reflectance of different objects, including water, are given as a function of the wavelengths. It is observed that water reflectance is less than the others. Objects such as dust, plants, ice, and snow have more reflectance than water.
Fig. 4 Water surface reflection coefficients. Full dots are for shallow and blank ones are for deep waters, espectively [6].
3 Theoretical Discussions
In phase-shift method, the transmitted light intensity is modulated sinusoidally, and the round-trip time is
turned into phase shift [4,5,7]. If f1 is the small signal
modulation frequency, the phase shift is presented by,
c d 2 f 2 1 d 1t = p w = f
D (4)
There are several methods of measuring the resultant phase shift [9]. In this research, because the modulation frequency is high, heterodyne technique is being
employed. If seis the transmission (emission) signal,
Fig. 5 Measured reflectance for different objects. 1) snow, 2) cloud, 3) dry vegetation, 4) soil, 5) green vegetation, 6) dry sand, 7) moist sand, 8) ice, 9) turbid coastal water, 10) ocean water [2].
r
s is the receiving signal, ands2 being the reference
(auxiliary) signal, then,
) t cos( S s ) t cos( S s ) t cos( S s 2 2 2 d 1 r r 1 e e y + w = f + w = w = Ù Ù Ù (5)
According to these equations, it is evident that the transmitting and the receiving frequencies are equal.
The termfd is the signal-phase-delay due to the round
trip. The reference signal frequency is f2 and its phase
difference with the main signal is y. Based on the
heterodyne technique, the multiplication of the transmitting and receiving signals into the auxiliary signal results, )]} ( ) cos[( )] ( t ) {cos[( S S s . s X ]} ) cos[( ] t ) {cos[( S S s . s X d 2 1 d 2 1 2 r 2 1 2 r r 2 1 2 1 2 e 2 1 2 e e y + f + w + w + y -f + w -w = = y + w + w + y -w -w = = Ù Ù Ù Ù (6)
Both signals have a differentiation and addition
frequencies. Using a low-pass filter to annihilate the addition part, ) t cos( Y y ) t cos( Y y d m r r m e e y -f + w = y -w = Ù Ù (7)
where, fd(in radian) is the phase difference between the
tow final signals. It is equal to that considered for the case of the round trip. Figure 6 shows the general block diagram of a phase-shift laser altimeter system, giving a primary insight to the important sections of the system.
4 Error consideration
The undesired environmental signals and noises are important error sources. The light intensity incident on photodiode has deteriorating effect on its AC parameters. Fig. 7 shows the photodiode equivalent circuit. A change of the diode’s incident light intensity,
will automatically change the Rph, and as a result
theRph.Cph will change. Hence, there will be a change in
the phase delay
(
j=arctan(RCw))
of the signal. This isobviously an unwanted and undesired phase shift and an important error source.
Fig. 6 The block diagram of a phase shift laser altimeter system.
Photodiode
LaserDiode Driver
Preamplifier & filter e
s
2s
AGC Phase Comparator MIX1 MIX2 rs
ry
LPF LPFFig. 7 The hotodiode equivalent circuit.
Crosstalk [8] is the most important error source which decreases the system precision and the maximum measurable distance. It is theoretically a signal that is electromagnetically induced on the receiver and produces error. To avoid this undesired effect, the electronic circuits of the system was shielded properly. The power sources was also isolated from other parts. This greatly eliminated the coupling between the transmitter and the receiver.
5 Electronic circuits
It is seen from fig.8 that, the circuit has a main oscillator which decides the laser’s driving frequency. This is the frequency being received by the receiver.
The frequency of the local oscillator (633803Hz) is
chosen close to the main oscillator’s frequency (633819Hz). The difference is about 16Hz. The two oscillator Circuits are similar. The Produced frequencies
are inputted to a divider circuit. A 1MHzbandwidth
mixer is then used to mix the signals, and finally the time difference is multiplied in 30000. By introducing several delays and measuring the respected times, the relation between the altitude (L) and the measured time differences at the mixer’s output becomes,
) 65 . 0 T 4 . 3 (
L= + (T: ms) (8)
In figure 8 the schematic representation of the Automatic gain control (AGC) circuit is shown. The signal is applied to the amplifier through the multiplier, and the amplifier’s output is converted into DC level by a rmstoDCconverter. It is then inversed by the transistor. The transistor output voltage is again applied to the other input of the mixer, which by increasing the input amplitude, the amplifier output is increased. Hence, an increase in the converter DC level, will cause a decrease in transistor’s output voltage. Multiplication of this voltage to the input signal will decreases the amplitude of the mixer output. The circuit has a perfectly fixed
output amplitude for inputs ranging 0.2V~7V.
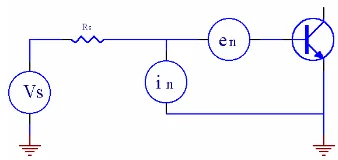
Optical receivers generally consists of two important parts, namely; the detector and the preamplifier sections. Noise elimination is one the most important task expected from a well designed preamplifier. Fig.9 presents the noise model for a transistor.
Fig. 9 Transistor noise model.
For practical sources having high output resistances,
a transistor with small in is preferred. This will
eliminate the noise voltage in the source resistance. On the other hand, if signal source has a low resistance, it’s
better to use a transistor having low en. The most
important problem in designing a preamplifier circuit is an impedance that acts as a load for the photodiode. A large load resistance causes an increase of the produced signal. However, increasing the load resistance, will increase the Johnson (or thermal) noise, which in turn will effect the signal. With respect to the detector capacitance, the use of a large load causes a decrease in the high cut-off frequency. Using a low load, will also decrease the environmental light effects.
The primarily designed preamplifier circuit is shown in figure 10. Using a tank circuit as the load for the photodiode and an inductance feedback for the Op-amp, the circuit was able to detect a light power of
about200nW. In figure 11 the modified version of the
circuit is presented. In this circuit an inductance load was used for the phototransistor and a tank circuit was placed as the low noise Op-amp’s feedback. With this configuration, the sensitivity of the system was improved to 20nW. The sensitivity of the
phototransistor used in figure 11 is about 0.5A/W. The
circuit was also tested using an APD having sensitivity
of 20A/W. In this case the detectable power was in the
Pico watt ranges. However, the repeatability of the result was questionable. The experimental results are shown in table1.
Fig. 8 Amplifier with automatic gain control circuit.
Fig. 10 Preamplifier circuit. Fig. 11 Modified preamplifier circuit with high sensitivity.
Table 1 Experimental results(t is the time difference between the transmitted and received signal and T is the time difference after mixing).
Measured Altitude (m) Real Altitude (m)
sec) m ( T sec) n ( t
1.47 1.35
0.21 9
2.09 2.1
0.41 14
3.79 4
0.88 27
6.9 7.3
1.74 49
11.9 12.7
3.13 85
16.13 16.4
4.33 110
23.6 23.9
6.44 160
6 Conclusion
In this paper design and implementation of a laser-based altimeter was presented. The laser-beam-water-surface-interaction (LBWSI) experimental results for different wavelengths are also presented and analyzed. Crosstalk and environmental light effects were examined and their effects were discussed. To reduce the environmental light effects, the use of a dynamic loop in which photodiode current is held constant is proved to be appropriate. The system was tested frequently and functioned satisfactorily.
7 References
[1] L. Ramos-Izaquierdo and J. L. Bufton, “Optical System Design of the Mars Observer Laser Altimeter,” Laboratory for Terrestrial Physics Goddard Space Flight Center Greenbelt, MD 20771.
[2] www.optech.on.ca/Aboutlaser.htm.
[3] B. Journet and G. Bazin,”A Low-Cost Laser Range Finder Based on an FMCW-Like Method,” IEEE Transaction on Instrumentation and Measurement, Vol. 49, No. 4, 2000.
[4] B. Journet, G. Bazin and F. Bras, “Conception of an Adaptive Laser Range Finder Based on Phase Shift Measurement,” Industrial Electronics, Control, and Instrumentation, Proceeding on the 1996 IEEE
IECON 22nd International Conference, 1996.
[5] H. Lamela, E. Garcia, “Experimental Evaluation of
Sensitivity Enhancement Achieved By Heterodyne Optical Detection In AMCW, Laser Rangefinders For Machine Vision Industrial Electronics
Society,” IECON ‘98. Proceeding on the 24th
Annual Conference of the IEEE, 1998.
[6] L. Douglas Stuffle, ”Bathymetry from Hyperspectral Imagry,” (thesis), December, Naval Postgraguate School Montrey, California, 1996.
[7] S. Poujouly and B. Journet, “ Laser Range Finder Based on Fully Digital Phase-Shift Measurement,” IEEE, Dominique Miller, 1999.
[8] T. Bosch and M. Lescure, “Crosstalk Analysis of 1 m to 10 m Laser Phase-Shift Range Finder,”IEEE Transaction on Instrumentation and Measurement, Vol. 46, No. 6, 1997.
[9] s. Journet, B. Placko, “Digital Laser Range Finder:
Phase-Shift Estimation by Undersampling
Technique Poujouly,” Industrial Electronics
Society, IECON ’99 Proceedings. The 25th Annual
Conference of the IEEE, 1999.
![Fig. 3 Real and imaginary parts of refraction index of pure water versus wavelength [6]](https://thumb-us.123doks.com/thumbv2/123dok_us/220902.2016604/2.595.324.514.378.583/real-imaginary-parts-refraction-index-water-versus-wavelength.webp)
![Fig. 5 Measured reflectance for different objects. 1) snow, 2) cloud, 3) dry vegetation, 4) soil, 5) green vegetation, 6) dry sand, 7) moist sand, 8) ice, 9) turbid coastal water, 10) ocean water [2]](https://thumb-us.123doks.com/thumbv2/123dok_us/220902.2016604/3.595.96.500.599.740/measured-reflectance-different-objects-vegetation-vegetation-turbid-coastal.webp)