InTrans Project Reports Institute for Transportation
5-2014
Multi-Purpose ESS/ITS Data Collection Sites
Neal R. HawkinsIowa State University, [email protected]
Christopher Albrecht
Iowa State University, [email protected]
Follow this and additional works at:http://lib.dr.iastate.edu/intrans_reports Part of theCivil Engineering Commons
This Report is brought to you for free and open access by the Institute for Transportation at Iowa State University Digital Repository. It has been accepted for inclusion in InTrans Project Reports by an authorized administrator of Iowa State University Digital Repository. For more information, please [email protected].
Recommended Citation
Multi-Purpose ESS/ITS Data Collection Sites
Abstract
This document presents the results of a state-of-practice survey of transportation agencies that are installing intelligent transportation sensors (ITS) and other devices along with their environmental sensing stations (ESS) also referred to as roadway weather information system (RWIS) assets.
Keywords
Intelligent transportation systems, Road weather information systems, Sensors, environmental sensing stations, roadway weather information
Disciplines
Civil Engineering
Multi-Purpose ESS/ITS
Data Collection Sites
http://aurora-program.org
Aurora Project 2007-05
About Aurora
Aurora is an international program of collaborative research, development and deployment in the field of road and weather information systems (RWIS), serving the interests and needs of public agencies. The Aurora vision is to deploy RWIS to integrate state-of-the-art road and weather forecasting technologies with coordinated, multi-agency weather monitoring infrastructures. It is hoped this will facilitate advanced road condition and weather monitoring and forecasting capabilities for efficient highway maintenance, and the provision of real-time information to travelers.
Disclaimer Notice
The contents of this report reflect the views of the authors, who are responsible for the facts and the accuracy of the information presented herein. The opinions, findings and conclusions expressed in this publication are those of the authors and not necessarily those of the sponsors.
The sponsors assume no liability for the contents or use of the information contained in this document. This report does not constitute a standard, specification, or regulation.
The sponsors do not endorse products or manufacturers. Trademarks or manufacturers’ names appear in this report only because they are considered essential to the objective of the document.
Non-Discrimination Statement
Iowa State University does not discriminate on the basis of race, color, age, religion, national origin, sexual orientation, gender identity, genetic information, sex, marital status, disability, or status as a U.S. veteran. Inquiries can be directed to the Director of Equal Opportunity and Compliance, 3280 Beardshear Hall, (515) 294-7612.
Iowa Department of Transportation Statements
Federal and state laws prohibit employment and/or public accommodation discrimination on the basis of age, color, creed, disability, gender identity, national origin, pregnancy, race, religion, sex, sexual orientation or veteran’s status. If you believe you have been discriminated against, please contact the Iowa Civil Rights Commission at 800-457-4416 or the Iowa Department of Transportation affirmative action officer. If you need accommodations because of a disability to access the Iowa Department of Transportation’s services, contact the agency’s affirmative action officer at 800-262-0003.
The preparation of this report was financed in part through funds provided by the Iowa Department of Transportation through its “Second Revised Agreement for the Management of Research Conducted by Iowa State University for the Iowa Department of Transportation” and its amendments.
Technical Report Documentation Page
1. Report No. 2. Government Accession No. 3. Recipient’s Catalog No.
Aurora Project 2007-05
4. Title and Subtitle 5. Report Date
Multi-Purpose ESS/ITS Data Collection Sites May 2014
6. Performing Organization Code 7. Author(s) 8. Performing Organization Report No.
Neal Hawkins and Chris Albrecht Aurora Project 2007-05
9. Performing Organization Name and Address 10. Work Unit No. (TRAIS)
Center for Weather Impacts on Mobility and Safety Institute for Transportation
Iowa State University
2711 South Loop Drive, Suite 4700 Ames, IA 50010-8664
11. Contract or Grant No.
12. Sponsoring Organization Name and Address 13. Type of Report and Period Covered
Aurora Program
Iowa Department of Transportation 800 Lincoln Way
Ames, Iowa 50010
Federal Highway Administration U.S. Department of Transportation 1200 New Jersey Avenue SE Washington, DC 20590
Final Report
14. Sponsoring Agency Code
Pooled Fund SPR 72-00-0003-042
15. Supplementary Notes
Visit www.aurora-program.org for color PDFs of this and other research reports.
16. Abstract
This document presents the results of a state-of-practice survey of transportation agencies that are installing intelligent transportation sensors (ITS) and other devices along with their environmental sensing stations (ESS) also referred to as roadway weather information system (RWIS) assets.
17. Key Words 18. Distribution Statement
environmental sensing stations—intelligent transportation sensors—roadway weather information
No restrictions.
19. Security Classification (of this report)
20. Security Classification (of this page)
21. No. of Pages 22. Price
M
ULTI
-P
URPOSE
ESS/ITS
D
ATA
C
OLLECTION
S
ITES
Final Report May 2014
Authors
Neal Hawkins and Chris Albrecht
Center for Weather Impacts on Mobility and Safety (CWIMS) Institute for Transportation (InTrans), Iowa State University
Sponsored by the Aurora Program,
the Iowa Department of Transportation, and the Federal Highway Administration (FHWA)
Pooled Fund Study SPR-3(042)
Preparation of this report was financed in part
through funds provided by the Iowa Department of Transportation through its Research Management Agreement with the
Institute for Transportation (Aurora Project 2007-05)
A report from
Aurora Program Institute for Transportation
Iowa State University
2711 South Loop Drive, Suite 4700 Ames, IA 50010-8664
TABLE OF CONTENTS
ACKNOWLEDGMENTS ... vii
BACKGROUND ...1
OBJECTIVE ...1
APPROACH ...1
SURVEY...3
SUMMARY OF SURVEY RESULTS ...4
SUMMARY OF AGENCY FINDINGS ...7
Alberta Ministry of Transportation (Alberta MOT) ...7
Alaska Department of Transportation and Public Facilities (Alaska DOT&PF) ...8
British Columbia Ministry of Transportation (BCMOT) ...8
Colorado Department of Transportation (CDOT) ...8
Delaware Department of Transportation (DelDOT) ...9
Iowa Department of Transportation (Iowa DOT) ...9
Kansas Department of Transportation (KDOT) ...9
Kentucky Transportation Cabinet (KTC) ...10
Michigan Department of Transportation (MDOT) ...10
Minnesota Department of Transportation (MnDOT) ...10
Missouri Department of Transportation (MoDOT) ...11
Montana Department of Transportation (MDT) ...11
Nebraska Department of Roads (NDOR) ...11
Nevada Department of Transportation (NDOT) ...12
New Jersey Department of Transportation (NJDOT) ...12
New York State Department of Transportation (NYSDOT) ...12
North Dakota Department of Transportation (NDDOT) ...12
Pennsylvania Department of Transportation (PennDOT)...13
Utah Department of Transportation (UDOT) ...13
Virginia Department of Transportation (VDOT) ...14
Washington State Department of Transportation (WSDOT) ...14
SUMMARY OF CASE STUDIES ...14
CASE STUDIES ...16
Case Study Group 1: Dynamic Message Signs linked to Road Weather Information Systems for Icy Conditions (Deployed in British Columbia, California, Colorado, Iowa, Michigan, and Oregon) ...16
Case Study Group 2: Dynamic Message Signs linked to Road Weather information Systems for Low Visibility Conditions (Deployed in California, Montana, and Tennessee)...20
vi
Case Study Group 5: Bridge Health Monitoring linked to Road Weather Information
Systems (Deployed in British Columbia, Delaware, and Iowa) ...26
Case Study Group 6: Commercial Vehicle Operations linked to Road Weather Information Systems (Deployed in New York State) ...29
Case Study Group 7: Avalanche Detection linked to Road Weather Information Systems (Deployed in Alaska, British Columbia, Colorado, and Utah) ...290
Case Study Group 8: Air Quality Evaluation linked to Road Weather Information Systems (Deployed in Alaska) ...29
LIST OF FIGURES Figure 1. Survey link sent to agencies ...2
Figure 2. Survey questions ...3
Figure 3. Survey responders ...4
ACKNOWLEDGMENTS
This document presents the results of a state-of-practice survey of transportation agencies that are installing intelligent transportation sensors (ITS) and other devices along with their
environmental sensing stations (ESS) also referred to as roadway weather information system (RWIS) assets.
BACKGROUND
There are a number of factors that can contribute to safe and efficient roadway operations: road surface condition, precipitation rate, wind speed, air temperature, humidity, sub-surface
temperatures, traffic volumes and operational speeds, vehicle classification and weight, etc.
State or provincial transportation agencies can use a variety of sensors to measure these
parameters, however, the careful selection of a sensor location is also critical and influences how the site data can be used for decision making, how the site fits into the agency’s traffic data plan, and the ease and safety of sensor installation, power, communications, and maintenance.
In addition, the addition of multiple intelligent transportation system (ITS) applications at established RWIS sites has the potential to maximize available funding, reduce maintenance and operational risks, and produce more robust data sets per representative highway segment
location.
OBJECTIVE
This project supports the overall objective of Aurora Project 2007-05 through documenting existing state/provincial or local agency practices where traffic data collection and other ITS-related sensors have been bundled with RWIS data collection sites. This documentation includes Aurora Program member states/provinces and other agencies with unique applications identified through surveying the AASHTO SICOP Snow-Ice List-Serve membership and other
professionals in the transportation, road weather, and ITS communities.
APPROACH
This research documented existing applications of innovative multiple data collection practices using various advanced
technologies that fall under the umbrella often referred to as ITS. These data collection practices included road surface condition, precipitation, stream flows, wind speed, air temperature, humidity, sub-surface temperatures, traffic volume and speed, vehicle
2
Task 1: The first task involved documenting known applications of multiple-use data collection practices/sites provided by Aurora member agencies; including examples previously identified in Iowa, Utah, and New York.
Task 2: Next, the research team developed and conducted a survey of representatives from state/provincial and local-level road agencies concerning sites where applications of multiple-uses data collection have been done. The survey, conducted through the popular Survey Monkey on-line application, was submitted to the SICOP Snow-Ice List-Serve membership and others in the transportation, road weather, and ITS communities in the summer of 2013. The short
introduction to the survey is shown in Figure 1.
Road Weather / Winter Maintenance Community / ITS Communities –
The Aurora Program is sponsoring a short (approximately 5 minutes) survey looking for examples of road weather information systems (RWIS) technologies being integrated with other systems such as traffic signals, traffic counting, tolling, dynamic messaging, or other relevant examples of intelligent transportation system (ITS) deployments. The survey can be found at: http://www.surveymonkey.com/s/3Y87TKZ. Please respond to this survey by no later than June 30th, 2013.
– Chris Albrecht, Aurora Program Manager
---
Aurora is a pooled fund program that brings together transportation agencies, universities, and weather services in the United States and Canada with a passion for improving road weather information systems. More information can be found at: http://www.aurora-program.org or by contacting Chris Albrecht, Aurora Program Manager, at [email protected].
Figure 1. Survey link sent to agencies
Several of the agencies that responded to the survey were identified for further interviews and documentation under Task 3.
Task 3: The third task involved interviewing and documenting information from selected agencies concerning the details of the unique multiple-use applications. Where possible, this documentation included specific processing components, sensors, and platforms.
SURVEY
A brief electronic survey was sent to several hundred state/provincial and local agency contacts in the areas of road weather information systems (RWIS), winter maintenance, ITS, and traffic operations. The vast majority were subscribers to the AASHTO SICOP Snow-Ice List-Serve, although several other sources of contact information were used as well.
The relatively short electronic survey was designed as to initially identify a few specifics of agency road weather and ITS programs. The survey consisted of 18 questions and was estimated to take approximately 5 minutes to complete. The questions are listed below in Figure 2.
1) What is your name?
2) What is your work email address?
3) What is the name of your agency or company?
4) Which of the below categories best describes your agency/company? - A public transportation industry
- A private sector road weather-related company
5) Does your agency operate and/or maintain environmental sensor system (ESS) technology? 6) How many ESS sites does your agency operate?
7) What types of ESS and other information is currently collected? 8) Has your agency incorporated any mobile data?
9) What mobile data are collected?
10) Has your agency combined any of these environmental sensing technologies with other advanced technologies deployed in the field?
11) Please provide a short description of this deployment.
12) Does your agency share power and/or communications between ESS and other devices at one site (ESS and DMS or WIM, etc.)?
13) Is your company involved in installing or maintaining road weather information systems or ESS devices?
14) Can you provide examples where ESS technologies were combined with other advanced technologies deployed in the field?
15) Please provide a description of this combined deployment.
16) Does your agency/company operate or maintain a separate intelligent transportation system (ITS) program?
17) Does your agency/company utilize, operate, or maintain any of the following? - River height levels
- Bridge scour monitors - Bridge health monitoring - Avalanche monitoring cameras
- Non-ITS applications still important for remote locations - Other
[image:15.612.68.530.234.669.2]18) Would you like a copy of the survey results sent you (via email)?
4
Although the survey was essentially a means to an end, designed to identify case studies, it did provide some valuable information about the extent and use of RWIS/ESS. A summary of some of agency-specific survey results and technology-specific case studies follow.
SUMMARY OF SURVEY RESULTS
[image:16.612.89.520.237.417.2]The survey had 47 unique responses. Of these, more than half (27) were from individuals representing US state transportation agencies. The others represented private industry (7), European and Canadian provincial agencies (4), US local government agencies (4), the Federal Highway Administration (2), academia (2), and AASHTO (1).
Figure 3. Survey responders
The public-sector transportation agencies, which indicated that they operate and/or maintain environmental sensor system (ESS) technology were as follows:
Alaska Department of Transportation and Public Facilities
Alberta Ministry of Transportation
British Columbia Ministry of Transportation
City of West Des Moines, IA
Colorado Department of Transportation
Delaware Department of Transportation
Iowa Department of Transportation
Kansas Department of Transportation
Kentucky Transportation Cabinet
McHenry County, IL
Michigan Department of Transportation
Minnesota Department of Transportation
Missouri Department of Transportation
Montana Department of Transportation
Nebraska Department of Roads
75%
15%
10%
Which of the below categories best
describes your agency/company?
Public-Sector (State or Local) Transportation Agency Private-Sector Road Weather-Related Company
Nevada Department of Transportation
New Jersey Department of Transportation
New York State Department of Transportation
North Dakota Department of Transportation
Pennsylvania Department of Transportation
South Dakota Department of Transportation
Swedish Transport Administration
Utah Department of Transportation
Virginia Department of Transportation
Washington State Department of Transportation
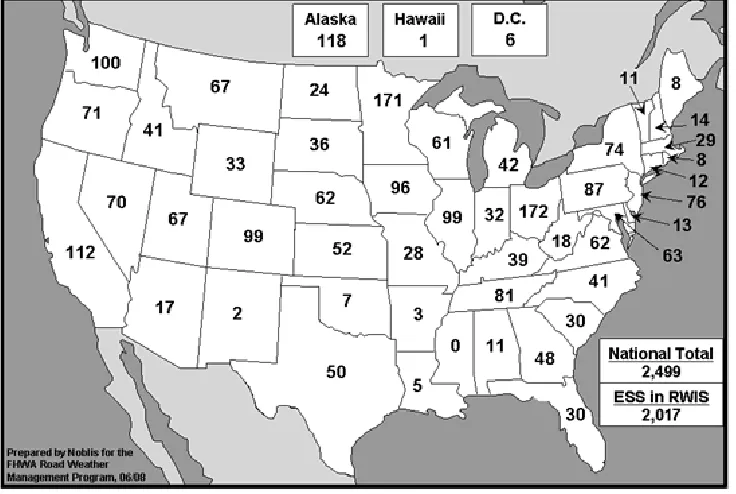
[image:17.612.124.492.285.532.2]Although not all North American states and provinces responded to the survey, the use of ESS has been shown to be extensive, as illustrated in a 2008 national survey. See Figure 4.
Figure 4. ESS deployed in the United States
When asked “How many ESS sites does your agency operate?” the agencies that responded to the survey, and were listed prior, reported together having more than 2,300 ESS sites. Note that this included a few local agencies and Sweden’s 780 sites. The survey also shows that these agencies collect a variety of data (through ESS and other sensors) used to improve traffic, road weather, and maintenance decision making. The most common ESS-derived data collected were as follows:
road surface condition
road and bridge temperature
6
wind speed and direction
air temperatures
humidity
sub-surface temperatures
Other data collected (through ESS and other instrumentation) included the following:
traffic volumes and speeds
vehicle classification and weight
air quality
visibility
solar radiation
barometric pressure
camera images
dew point
stream/water levels
The survey also asked about data collected using mobile-sources. About half (11) of the agencies that utilize ESS reported collecting some type of mobile data. The mobile data collected and identified by the responses were as follows:
road surface condition
air temperature
surface/pavement temperature
relative humidity
dew point
precipitation
camera images/video
Canbus engine data
material type (winter maintenance)
plow up/down (winter maintenance)
spreader rate (winter maintenance)
wind speed and direction
road grip/friction
visibility
traffic flow
The survey also asked for examples of agencies combining environmental sensing technologies with other advanced technologies deployed in the field, such as a precipitation sensor
Alaska Department of Transportation and Public Facilities
Alberta Ministry of Transportation
British Columbia Ministry of Transportation
Colorado Department of Transportation
Delaware Department of Transportation
Iowa Department of Transportation
Michigan Department of Transportation
Minnesota Department of Transportation
Montana Department of Transportation
Nevada Department of Transportation
New York State Department of Transportation
Pennsylvania Department of Transportation
Swedish Transport Administration
Utah Department of Transportation
In addition, a few other potential examples were later found through follow-up interviews or suggested by Aurora Program members. These included projects implemented by the California DOT, Oregon DOT, Wyoming DOT, Tennessee DOT, Florida DOT, Wisconsin DOT, and the cities of Bettendorf, Iowa and Overland Park, Kansas.
Several follow-up interviews uncovered a number of examples that were documented and later developed and integrated into the case studies. Where possible, specific details of the
deployments (processing components, sensors, platforms, etc.) were noted. These detailed agency-specific findings and case studies can be found in the following two sections.
SUMMARY OF AGENCY FINDINGS
Alberta Ministry of Transportation (Alberta MOT)
Alberta MOT maintains more than 100 ESS sites, with more than 100 complete RWIS stations.
The RWIS/ESS network collects road surface condition, road/bridge surface temperature, precipitation rate, wind speed and direction, barometric pressure, air temperature, humidity, subsurface temperatures, chemical concentration, freeze point, and road images for
verification of surface condition.
Freeze point is calculated based on the measurements from the passive surface sensors, but not measured.
Additional data collected by others within the ministry include traffic volumes, operational speeds, vehicle classification, and vehicle weight.
Alberta MOT RWIS/ESS sites do not share power with other devices or collect mobile data.
Alberta MOT has done some integration of DMS with RWIS, with one system focused on wind speed and the other on road and weather conditions (ice, frost, fog, and snowstorm).
8
Alaska Department of Transportation and Public Facilities (Alaska DOT&PF)
Alaska DOT&PF maintains approximately 54 RWIS/ESS sites. Their RWIS/ESS network is separate from the state’s ITS program.
The RWIS/ESS network collects road/bridge surface temperature, precipitation rate, wind speed, air temperature, humidity, and subsurface temperatures.
Additional data collected by others in Alaska include traffic volumes, vehicle classification, and vehicle weight. They plan to expand use of temperature data probes, deploy avalanche systems, and also collect air quality data.
Alaska DOT&PF does also collect mobile data; including air temperature, pavement temperature, and relative humidity.
Alaska DOT&PF RWIS/ESS sites do share power with ATR sites.
Contact: Jack Stickel ([email protected])
British Columbia Ministry of Transportation (BCMOT)
BCMOT maintains approximately 180 RWIS/ESS sites. Their RWIS/ESS network is separate from the ministry’s ITS program.
The ITS program involves formal traffic management and operations, traffic data plan, central TMC, DMS, highway cameras, speed detection sensors, etc.
The RWIS/ESS network collects road surface condition, road/bridge surface temperature, precipitation rate, wind speed, air temperature, humidity, and subsurface temperatures.
Additional data collected by others within BCMOT include traffic volumes, snow depth, vehicle classification, and vehicle weight.
BCMOT RWIS/ESS sites do share power with other devices.
Contact: Simon Walker ([email protected])
Colorado Department of Transportation (CDOT)
CDOT maintains approximately 150 RWIS/ESS sites statewide, which fall under the ITS program for maintenance and monitoring.
The CDOT network collects road condition, road/bridge surface temperature, precipitation rate, wind speed, air temperature, humidity, and subsurface temperatures.
Additional data collected by CDOT include traffic volumes, operational speeds, and vehicle classification, and road grip.
CDOT does coordinate/combine ESS with other traffic or ITS-related data for fog detection and use of non-invasive sensors with DMS.
CDOT also physically co-locates RWIS as a base for cameras, toll tags, speed monitoring, web page, traffic counts, etc.
CDOT is also doing research into using RWIS with traffic counters on Interstate 25
CDOT does not collect mobile data yet, but plans to in the future.
CDOT also does flood detection and uses solar power at some sites.
Delaware Department of Transportation (DelDOT)
DelDOT maintains approximately 16 ESS sites.
Their RWIS/ESS network collects road surface condition, road/bridge surface temperature, precipitation rate, wind speed, air temperature, humidity, and subsurface temperatures.
DelDOT does coordinate/combine ESS with other traffic or ITS-related data.
Additional data collected by others within DelDOT include traffic volumes, operational speeds, vehicle classification, and vehicle weight.
DelDOT also collects water level/flooding data at specific locations along coastal areas and uses portable technology, with plans to adopt a portable hydrology/gauge system for
monitoring and planning purposes.
Contacts: Silvana Croope ([email protected]) and Craig Kursinsky ([email protected])
Iowa Department of Transportation (Iowa DOT)
Iowa DOT maintains approximately 70 RWIS sites statewide in a network separate from their ITS program.
Their RWIS/ESS network collects road surface condition, road/bridge surface temperature, precipitation rate, wind speed, air temperature, humidity, and subsurface temperatures.
In addition, data collected by others within Iowa DOT include traffic volumes, vehicle classification, and operational speeds.
Iowa DOT does coordinate/combine ESS with other traffic or ITS-related data. For example, data/information from a few RWIS are being relayed to DMS at certain locations.
Iowa DOT RWIS/ESS sites share power with other devices at some sites.
Iowa DOT has been adding traffic detection and cameras at RWIS locations for several years.
Iowa has 2 mini-RWIS units that plug into/share power from other agencies (Monroe and Sabula).
Contact: Tina Greenfield ([email protected])
Kansas Department of Transportation (KDOT)
KDOT maintains approximately 43 RWIS/ESS sites in a network separate from their ITS program.
Their RWIS/ESS network collects road surface condition, road/bridge surface temperature, precipitation rate, wind speed, air temperature, humidity, and subsurface temperatures.
Additional data collected by others within KDOT include traffic volumes, vehicle
classification, and vehicle weight. This data is not coordinated/combined with RWIS/ESS data.
KDOT does not collect mobile data, and their RWIS/ESS sites do not share power or communications with other devices.
10 launched KanDrive (www.kandrive.org) in 2009.
KanDrive is a one-stop gateway for travel information in Kansas and surrounding states. Content includes weather-related driving conditions, work zones, traffic incidents, weather information, and other information through a variety of media.
Contacts: Peter Carttar ([email protected]) and Dale Kirmer ([email protected])
Kentucky Transportation Cabinet (KTC)
KTC maintains approximately 38 RWIS/ESS sites in a network that is separate from the ITS program.
Their RWIS/ESS network collects road surface condition, road/bridge surface temperature, precipitation rate, wind speed, air temperature, humidity, and subsurface temperatures. This ESS data is not coordinated/combined with other traffic or ITS-related data.
KTC RWIS/ESS sites do not share power and/or communications with other devices.
KTC does not collect mobile data.
Contact: David Cornett ([email protected])
Michigan Department of Transportation (MDOT)
MDOT maintains approximately 31 RWIS/ESS sites.
The MDOT RWIS/ESS network is separate from the department’s ITS program.
Their RWIS/ESS network collects road surface condition, Snow depth, road/bridge surface temperature, precipitation rate, wind speed, air temperature, humidity, and subsurface temperatures.
Additional data collected by MoDOT include traffic volumes, operational speeds, vehicle weight, and vehicle classification.
MDOT does not collect mobile data, but RWIS/ESS sites do share power and communications.
Contact: Dawn Gustafson ([email protected])
Minnesota Department of Transportation (MnDOT)
MnDOT maintains approximately 95 RWIS/ESS sites in a well-developed network separate from the ITS program.
Their RWIS/ESS network collects road surface condition, road/bridge surface temperature, precipitation rate, wind speed, air temperature, humidity, and subsurface temperatures.
Additional data collected include traffic volumes, operational speeds, vehicle weight, and vehicle classification.
MnDOT does collect mobile data; including road and air temperature, relative humidity, dew point, material type and amount, Canbus data, and camera images.
MnDOT does coordinate/combine ESS with other traffic or ITS-related data. For example, precipitation data was used with DMS.
MnDOT has been incorporating weather sensing technologies into traffic management operations as well. The Active Traffic Management (ATM) system was deployed between 2009 and 2012 and uses technology to enhance safety and improve the flow of traffic by providing motorists information about the conditions within their lane and alert them to conditions ahead.
MnDOT is working to develop new techniques for the advisory variable speed limit system during weather events.
Contact: Curt Pape ([email protected])
Missouri Department of Transportation (MoDOT)
MoDOT maintains approximately 20 RWIS/ESS sites.
The MoDOT RWIS/ESS network is separate from the department’s ITS program.
Their RWIS/ESS network collects road surface condition, road/bridge surface temperature, precipitation rate, wind speed, air temperature, humidity, subsurface temperatures, dew point, barometric pressure, and visibility.
Additional data collected by MoDOT include traffic volumes, operational speeds, and vehicle classification. This data is not yet coordinated/combined with RWIS/ESS data.
MoDOT does not collect mobile data.
Contact: Jon Nelson ([email protected])
Montana Department of Transportation (MDT)
MDT maintains approximately 70 RWIS/ESS sites.
The MDT RWIS/ESS network is separate from the department’s ITS program.
Their RWIS/ESS network collects road surface condition, road/bridge surface temperature, precipitation rate, wind speed, air temperature, humidity, subsurface temperatures, and visibility.
MDT does not collect mobile data.
MDT sites do not currently share power and/or communications with other devices.
Contact: Brandi Hamilton ([email protected])
Nebraska Department of Roads (NDOR)
NDOR maintains approximately 60 RWIS/ESS sites.
Their RWIS/ESS network collects road/bridge surface temperature, wind speed, air temperature, humidity, and subsurface temperatures. This ESS data is not
coordinated/combined with other traffic or ITS-related data.
NDOR collects mobile data, namely air and pavement temperature from plow trucks.
NDOR RWIS/ESS sites do share power and/or communications with other devices.
12
Nevada Department of Transportation (NDOT)
NDOT maintains approximately 70 to 75 RWIS/ESS sites.
The NDOT RWIS/ESS network is separate from the department’s ITS program.
Their network collects road condition, road/bridge surface temperature, precipitation rate, wind speed, air temperature, humidity, and subsurface temperatures.
Additional data collected by NDOT include traffic volumes, operational speeds, vehicle weight, and vehicle classification. This data is coordinated/combined with RWIS/ESS data to issue wind warnings and prohibitions automatically driving DMS, as well as to control automatic bridge deicing systems.
NDOT utilizes bridge scour monitors.
NDOT RWIS/ESS sites also share power or communications with other devices.
Contact: Denise Inda ([email protected])
New Jersey Department of Transportation (NJDOT)
NJDOT maintains approximately 39 RWIS/ESS sites.
The NJDOT RWIS/ESS network is separate from the department’s ITS program.
Their RWIS/ESS network collects road condition, road/bridge surface temperature,
precipitation rate, wind speed, air temperature, humidity, and subsurface temperatures. This data is not coordinated/combined with other traffic or ITS-related data.
NJDOT does not collect mobile data.
NJDOT RWIS/ESS sites do not share power or communications with other devices.
Contact: David Bowlby ([email protected])
New York State Department of Transportation (NYSDOT)
NYSDOT maintains approximately 45 RWIS/ESS sites statewide in a network separate from the ITS program.
The NYSDOT RWIS/ESS network collects road condition, road/bridge surface temperature, precipitation rate, wind speed, air temperature, humidity, and subsurface temperatures.
Additional data collected by NYSDOT include traffic volumes, operational speeds, and vehicle weight. This data has been coordinated/combined with RWIS/ESS data to issue.
NYSDOT does collect mobile data as well, including plow truck statistics.
The RWIS/ESS sites also share power and communications.
Contact: Joe Doherty ([email protected])
North Dakota Department of Transportation (NDDOT)
NDDOT maintains approximately 24 RWIS/ESS sites.
The NDDOT RWIS/ESS network is separate from the department’s ITS program.
coordinated/combined with other traffic or ITS-related data.
Some NDDOT RWIS/ESS network sites do share power and/or communications with other devices.
NDDOT does not collect mobile data.
Contact: Travis Lutman ([email protected])
Pennsylvania Department of Transportation (PennDOT)
PennDOT maintains approximately 97 RWIS/ESS sites statewide.
The PennDOT RWIS/ESS network is separate from the department’s ITS program.
PennDOT RWIS/ESS sites do not share power or communications with other devices.
PennDOT does not collect mobile data.
The PennDOT RWIS/ESS network collects road surface condition, road/bridge surface temperature, precipitation rate, wind speed, Air temperature, humidity, and subsurface temperatures.
Contact: Jason Norville ([email protected])
Utah Department of Transportation (UDOT)
UDOT maintains approximately 81 RWIS/ESS sites statewide, with more coming online soon.
The UDOT RWIS/ESS network is separate from the department’s ITS program.
The UDOT RWIS/ESS network collects road surface condition, road/bridge surface temperature, precipitation rate (only on portable sites), wind speed, air temperature, humidity, and subsurface temperatures, solar radiation, camera images, and visibility.
Traffic volumes are also collected by UDOT.
UDOT does collect mobile data, but mobile device technology is just beginning to be included in weather operations. UDOT has developed a "citizen reporter" program where citizens can use their mobile device to report road conditions. This program is currently in its infancy and is being tested with select personnel.
UDOT RWIS/ESS sites do share power with other ITS devices, as is the case in the Powder Mountain ski area and along Interstate 70.
UDOT does coordinate/combine ESS with other traffic or ITS-related data. For example, they will soon be deploying a RWIS station that will be used as a trigger for displaying a static message "Icy Bridges Ahead" on a small DMS. In addition, a small station is currently being linked to a DMS sign to display an icy bridge warning sign when conditions warrant.
UDOT is also testing the use of non-intrusive road condition sensors at intersections to change signal timings.
14
Virginia Department of Transportation (VDOT)
VDOT maintains approximately 55 RWIS/ESS sites.
The VDOT RWIS/ESS network is separate from the department’s ITS program.
The VDOT RWIS/ESS network collects road surface condition, road/bridge surface
temperature, precipitation rate, wind speed, humidity, and subsurface temperatures. This data is not coordinated/combined with other traffic or ITS-related data.
The VDOT RWIS/ESS network sites do not share power and/or communications with other devices.
VDOT does not collect mobile data.
Contact: Jimmy White ([email protected])
Washington State Department of Transportation (WSDOT)
WSDOT maintains approximately 120 RWIS/ESS sites statewide.
Their RWIS/ESS network collects road surface condition, road/bridge surface temperature, precipitation rate, wind speed, air temperature, humidity, and subsurface temperatures. This data is not coordinated/combined with other traffic or ITS-related data.
The WSDOT RWIS/ESS network is separate from the department’s ITS program.
WSDOT does not collect mobile data.
WSDOT does utilize bridge scour monitoring.
Contacts: Jay Wells ([email protected].gov) and Eldon Jacobson ([email protected])
SUMMARY OF CASE STUDIES
Overall, the case studies detail the current state-of-the-practice in applying innovative
combinations of traffic and atmospheric data collection technologies from around North America and Europe. These practices can be categorized into three general areas: 1) co-locating ITS components at an existing RWIS/ESS installation, 2) co-locating RWIS/ESS components at an existing ITS or other installation, and 3) sharing of power and/or communications resources.
Many of these instances, as well as some mentioned in responses from the survey, involved the practice of sharing power and communications resources. This practice, for the most part, is relatively new, but rapidly becoming more common. In addition, the use of portable and reduced-scale RWIS is a growing trend. Other general conclusions from the case studies are:
There are now several examples of ESS devices being used apart from a traditional RWIS location, such as in signal cabinets or directly on a DMS.
Many of these co-located signal-cabinet installations have been undertaken by local agencies and is a way to get an RWIS program going.
As with many of the case studies, sharing of power and communications resources is becoming quite common, even if the equipment is not directly functioning together. For example, Utah DOT not have RWIS equipment housed in signal cabinets, but has several RWIS sites near signal cabinets where there is often conduit running from the signal cabinet to the RWIS site for communications and power.
A few agencies are starting to utilize speed detection along-side weather data (such as dynamic weather-related speed management applications in Sweden) to adjust speeds. In addition, the Utah Department of Transportation has located Wavetronix units on portable RWIS units. Specifically, two trailers with both Wavetronix and RWIS equipment are being used along-side construction projects. UDOT also has one RWIS trailer with a Wavetronix unit.
Monitoring of water level/flooding data is an area of increasing focus. Systems are developing for this purpose in Delaware, Colorado, and Texas.
Finally, although only a few local agencies were ultimately surveyed and even fewer use ESS extensively, many of them have assumed an active role in monitoring stream/river levels for potential flooding problems.
The cases studies were ultimately organized into the following groups:
Case Study Group 1: Dynamic Message Signs linked to RWIS for Icy Conditions
Case Study Group 2: Dynamic Message Signs linked to RWIS for Low Visibility Conditions
Case Study Group 3: RWIS located with Traffic Signal Hardware
Case Study Group 4: Wind Warning Systems
Case Study Group 5: Bridge Health Monitoring linked to RWIS
Case Study Group 6: Commercial Vehicle Operations linked to RWIS
Case Study Group 7: Avalanche Detection linked to Road Weather Information Systems
16
CASE STUDIES
Case Study Group 1: Dynamic Message Signs linked to Road Weather Information Systems for Icy Conditions (Deployed in British Columbia, California, Colorado, Iowa, Michigan, and Oregon)
The British Columbia Ministry of Transportation currently has six (6) systems in place where dynamic message sign (DMS) displays are triggered by sensors from an RWIS site. One (1) more similar system will be deployed in the fall of 2014. These systems have been targeted toward safety concerns and located along highway segments in British Columbia that experience significantly wet/icy conditions.
The sites are located at:
Kennedy Lake – 2010
Quartz Creek – 2011
Beasley Bluffs – 2012
Hush Lake – 2013
Begbie Summit – 2013
Kalamalka – 2013
The weather stations at these locations, which are run through a data logger, use an array of precipitation sensors to determine if certain thresholds are met; including standpipe precipitation gauges, snow depth sensors, and optical precipitation occurrence
detectors. For example, a rainfall rate of 2mm per hour over a 2 hour period will trigger the display of a warning message (to slow down, etc.) concerning water pooling on the DMS. Soon after their
deployment, optical (non-invasive) pavement sensors were added to these sites.
Due to the remote locations of many of these sites, many are run on solar power and/or have been tied into street lighting or low-level power sources. Specifically, the System at Quartz Creek is 100% reliant on solar power (including the small ‘single
message’ signs). The other systems have AC power to supply the larger signs, but the weather stations themselves can be solar powered (Beasley Bluffs and Hush Lake).
Overall, the use of RWIS with DMS has been seen as a success and has attracted interest for further locations around the province prone to icing or slippery conditions. Since their
installation, there has been a noticeable reduction in crashes at these six initial locations. In fact, at Quartz Creek there have been no incidents on the bridge in the 3 winters since the system was deployed.
Feedback on these systems from the highway maintenance crews and the travelling public has been generally favorable.
The British Columbia Ministry of Transportation Traffic Safety Engineering Branch of considers these systems to offer a high return on investment – total cost to install a system from scratch (including fully instrumented Road Weather Station) is on the order of $300, 000.
Contact: Simon Walker ([email protected])
In addition, the California Department of Transportation has deployed a similar system consisting of pavement sensors used to detect icy
condition in combination with dynamic messaging. This system, intended to utilize real-time messaging to increase motorist vigilance and reduce crashes, provides warnings when icy conditions are present or eminent.
The system is located at Fredonyer Pass in the northeastern part of the state along a five-mile segment of State Highway 36. This location has a history as a high-collision location, including multiple fatalities, with the vast majority occurring when the pavement was icy. Static signage had been in place prior to this system’s installation.
The overall system, collectively known as the Fredonyer Pass Icy Curve Warning System (ICWS), is comprised of two separate warning systems. Each consists of RWIS and two
dynamic/extinguishable message signs with flashing beacons. One RWIS is located in the heart of each curve at a location determined to experience icing conditions most frequently. One EMS was placed on the approaches to each curve at a location to provide adequate braking distance for vehicles headed into an icy curve.
18
Finally, the results of an initial safety evaluation have indicated that the ICWS is having a positive impact on reducing crashes.
Contact: Steve Hancock ([email protected])
The Colorado Department of Transportation has installed a variable speed management system along State Highway 82 in Snowmass Canyon between Aspen and Glenwood Springs. This stretch of roadway is composed of an elevated southbound roadway that shades the northbound roadway during certain times of the day. This causes rapidly changing freezing conditions.
CDOT installed the system, which consists of a complete RWIS using non-intrusive pavement weather sensor technology. The pavement sensors monitor traction/friction conditions in the area that is shaded, and allow for alerts when conditions warrant. The system is capable of monitoring wet conditions, wet conditions with traction loss as freezing begins, and snow and ice conditions.
The system provides continuous monitoring of atmospheric and pavement weather conditions to determine changing driving conditions that will impact the motorist and alert CDOT
transportation managers of these changing conditions. The system wirelessly communicates to a single dynamic message sign (DMS) and a single variable speed sign (VSS) that are located nearly a mile in advance of this northbound section of highway in Snowmass Canyon. The system monitors traction level thresholds, and when slippery thresholds for wet and icy thresholds are reached, activation of different messages such as “Wet Roads Ahead” or “Icy Roads Ahead” are produced by the RWIS processor.
The system consists of the following components:
Dynamic/variable message sign
RWIS remote processing unit (RPU)
Non-intrusive surface temperature sensor
Air temperature and relative humidity sensor
Precipitation identifier and visibility sensor
Ultrasonic wind sensor
Pan-tilt-zoom color camera
Relay device control
Wireless device control
freezing rain, or snow, with the ability to display rates and accumulations. The cameras allow for live images of changing weather conditions at the site. The variable speed limit sign which was installed and operated with no issues, but was later removed.
In addition, the first winter of operation resulted in no winter weather related accidents in this section of highway in Snowmass Canyon.
Contact: Matt Rickard ([email protected])
Another example of dynamic message signs linked to RWIS is being implemented by the Iowa Department of Transportation. The Iowa DOT maintains
approximately 70 RWIS sites statewide. In the last couple of years, they have begun to co-locate a few of the newer RWIS/ESS installations with new
deployments of dynamic message signs.
To date, Iowa DOT has installed a few of these RWIS/DMS combinations in the Ames and Council Bluffs areas. The Council Bluffs location combines a “traditional” Vaisala RWIS site with a dynamic message sign. The other location, near Ames, uses a “mini” RainWise RWIS combined with DMS. Both deployments use the DMS as a structure for the
sensors and share power and communications resources.
These stations provide the same benefit as other RWIS sites for winter operations, plus provide conditions at the DMS if needed for messaging or traffic management.
20 A similar system, which incorporates an icy bridge deck detection system with advance warning signs, is being planned by the Michigan Department of Transportation. The proposed system is planned for installation in summer or fall of 2014 for winter 2014/2015 operation. The system is primarily safety-focused, making it different than a traditional RWIS/ESS site installation.
The planned deployment will use ESS to detect when icy conditions are present on bridge decks, then activate flashing beacons on static warning signs to provide a warning to motorists.
Contact: Dawn Gustafson ([email protected])
Also, the Oregon Department of Transportation has installed RWIS sensors and traffic monitoring devices along the State Route 217 Corridor. The department will be using these technologies together to activate weather-responsive variable speed limits and message signs along the highway. The system should be operational in 2014.
Case Study Group 2: Dynamic Message Signs linked to Road Weather information Systems for Low Visibility Conditions (Deployed in California, Montana, and Tennessee)
In 2009, the California Department of Transportation deployed a fog detection and warning system in its Central Valley region along a 13-mile section of State Highway 99. This area is known for thick ground fog, also known as Tule fog, that significantly reduces visibility during the rainy season from late fall through winter. In 2007, fog and low-visibility led to a massive 108-car pileup with 2 fatalities.
The system consists of visibility sensors, speed detectors, and cameras to detect congestion and visibility problems. The installation is forty percent solar powered and uses both point-to-point and point-to-multipoint wireless radios to provide network connectivity. Local field controllers allow the field equipment to work autonomously if there is a break in communications to the central system. Due to the relatively rural nature of the project area, all system communications are wireless.
With speed detectors deployed every 1/4 mile and fog sensors and deployed every 1/2 mile, the system alerts motorists automatically of dangerous weather conditions and slow speeds by using
will warn drivers of slower traffic ahead in order to prevent chain-reaction collisions.
Using the data collected from the sensors, the DMS warn drivers of the presence of fog
downstream and instruct them to slow down when they are in dense fog. When slower speeds are detected downstream, the DMS warn drivers of the slower traffic ahead.
Planned enhancements include providing the speed and visibility data from the system to the new 511 traveler information system for the southern Central Valley. The 511 system will inform travelers of problems in the project area via the telephone and the Internet before they reach it, possibly before they even leave their home or office.
Contact: Steve Hancock ([email protected])
Another example of this type of visibility application is being implemented by in Montana. Montana DOT recently began working on deploying a visibility sensor that will trigger a static warning sign with flashing lights. This system is located along Interstate 15 near the Canadian border.
At this location, there is an alkali lake adjacent to this highway segment, and during certain windy conditions alkali dust creates poor visibility conditions. An RWIS with a visibility sensor is being located here, which will trigger the flashing lights attached to a static warning sign, warning travel public of poor visibility ahead. This site utilizes solar power as well. Montana also uses RWIS to determine messages displayed on their DMS.
Contact: Brandi Hamilton ([email protected])
In addition, the Tennessee Department of Transportation implemented a low-visibility warning system along Interstate 75 near Calhoun in 1993, then upgraded the system in 2006. The original system was installed after a number of crashes due to fog-related visibility problems over a 20 year span. The most severe of these occurred in December 1990, when dense fog contributed to a series of chain-reaction collisions involving 99 vehicles, 42 injuries, and 12 fatalities.
The system includes a three-mile fog detection area spanning north and south of the Hiwassee River and an eight-mile warning zone on each approach to the fog prone area. The current system is comprised of nine (9) forward-scatter visibility sensors, fourteen microwave radar vehicle detectors, and 21 CCTV cameras. In addition to the electronic instrumentation, reflective roadside delineators are placed in the detection zone at 80- foot increments for visibility
22
Data from these devices is transmitted by buried fiber optic cable to an on-site control center, then information from the on-site control center is relayed to a central computer located in a highway patrol office in Tiftonia. In addition to the warning systems, six (6) remotely operated swing gates are located at interchange onramps to control access to the interstate in the most severe conditions.
This system processes information from the detectors and alerts operators when pre-defined visibility or traffic speed thresholds have been reached. When these conditions are met, operators trigger pre-programmed messages to be displayed on the DMS and notify the troopers in the field. Troopers are stationed in the fog zone area daily during the fog prone hours (from 5 AM to 10 AM). After receiving word from the operators, troopers move to verify the roadway
conditions by counting the number of reflective roadside delineators visible.
Since the system became operational, visibility conditions have warranted closure of the
interstate section on two occasions: once for fog, and once for the presence of toxic smoke from a chemical plant fire. Driver safety issues due to visibility problems have improved significantly since the system has been in place, with only one fog-contributed crash being recorded in 2001. There were no fatalities from this crash. The fog warning and detection system has the additional benefit of providing an effective tool for general incident management.
Contact: Brad Freeze ([email protected])
Case Study Group 3: Road Weather information Systems located with Traffic Signal Hardware (Deployed in Delaware, Iowa, Kansas, Michigan, and Utah)
The City of Bettendorf, Iowa has integrated RWIS/ESS technologies into a traffic signal cabinet at some of the city’s busiest intersections. The city’s budget for clearing snow, applying roadway salt, and hiring temporary snow clearing workers had become a significant annual expense. City officials had determined that Bettendorf could see financial benefits from installing city-owned weather stations at strategic locations.
Using RWIS to gauge weather conditions, roadway pavement temperature, and whether arterial roadways had been sufficiently cleared of snow; the city anticipated annual savings that could be achieved by applying more precise decisions (when to call snow clearing workers, how much salt to apply, when to cease snow clearing efforts) to individual snowfall events.
Specifically, two RWIS systems were installed:
Middle Road at Spruce Hills Road
53rd Street at 18th Street
In addition, the existing traffic signal conduit system provided a conduit path for roadway sensors back to the RWIS cabinet. Existing power at the traffic signal cabinet was sourced for the RWIS power source. The existing network switch at the traffic signal cabinet provided access to the city’s dedicated communication network.
Contact: Jeff McAleer ([email protected])
In Kansas, the City of Overland Park has co-located many of their RWIS in areas near existing ITS devices with power and communication. A new RWIS station site typically requires new right-of-way with a dedicated pad, tower, cabinet, fence, and utilities work; which all contribute to high priced and complex installations. Overland Park took an
innovative way of integrating RWIS-ESS, using existing ITS infrastructure to lower cost and simplify installation.
The city identified locations for the new RWIS sites at intersections that already had mountable structures and traffic cabinets with power and communications available, then the sensors were installed on the existing infrastructure to make for a quick and straight forward installation.
The City of Overland Park worked with High Sierra Electronics to produce a system that delivers the benefits of a complete RWIS that is economical and integrates easily into their existing system. The system includes the HSE 5470 RWIS Remote Processing Unit (RPU) with the HSE 5433 IceSight non-intrusive road sensor. The HSE 5470 RPU is compact and has an open architecture design that is NTCIP 1204v3 compliant.
The RPU activates isolated outputs based on user settable high and low thresholds, enabling use of locally resolved weather status information to activate preemptions within an ATC2070 traffic controller or to activate other public warning devices for improved traffic safety. The IceSight units were installed at each site to provide surface condition, surface temperature, surface grip, ambient temperature, and relative humidity.
Since the initial installation, Overland Park has added 10 stations to their network. They use the system for initiating alarms, mobilizing emergency personnel, activate weather-related closures and feed their public facing website.
24
At the state level, Delaware DOT and Michigan DOT have also deployed ESS co-located in signal cabinets. In Michigan, the systems deployed have included pavement sensors (in one location), modems, cameras, and MVDS. In Utah, although UDOT does not have RWIS equipment housed in signal cabinets, they do have several RWIS sites near signal
cabinets. Often, there is conduit running from the signal cabinet to the RWIS site for communications and power at these sites.
Case Study Group 4: Wind Warning Systems (Deployed in Alberta, Florida, Montana, Nevada, and Pennsylvania)
The Alberta Ministry of Transportation maintains an extensive and active RWIS/ESS network. In recent years, they have begun to co-locate RWIS/ESS installations with a new deployment on Highway 22 of message signs for the purpose of warning of high wind conditions. One system is being placed to monitor a wind tunnel in the southern part of the province and display wind speed in conjunction with the flashing beacons when the wind speed reaches a pre-programmed threshold value.
This system is being deployed along a short section of highway (~20 kilometers) in the Rocky Mountain foothills with frequent high wind events, and as a result, a history with wind turnovers of recreational vehicles and trucks. The system will be completed in fall of 2014. An RWIS was installed at a representative spot (and where many collisions were recorded) in this windy corridor, and signals dynamic message signs at either end when wind speeds reach a trigger condition (2 triggers - average speed and gust). The DMS displays an electronic wind speed message as part of a permanent sign.
Contact: Beata Bielkiewicz ([email protected])
The Florida Department of Transportation has deployed a high-wind alert system for road bridges. The system assists the transportation and public-safety communities by providing real-time wind speed status information during severe weather events from each monitored bridge structure. This information is used to assist transportation managers with bridge closure decisions.
inefficiently, as well as being an in-accurate way of collecting meteorological data.
The high-wind alert system reliably collects more accurate data that is automatically and
instantaneously shared with FDOT Regional Traffic Management Centers (RTMC) and to local public safety officials. The system was deployed on over twenty bridges in northeast Florida as part of a pilot project.
The system utilizes low cost wind-only detectors and solar-powered satellite transmitters that use a free telemetry service offered by the National Oceanographic and Atmospheric Administration (NOAA) called the Data Collection System (DCS). There is therefore no monthly reoccurring operational cost for the system (other than maintenance).
The installation cost to instrument a bridge is approximately $10,000 (material and labor). FDOT is currently procuring satellite communications ground station equipment to enhance the
dissemination of data to RTMCs state-wide. Each bridge is outfitted with a data collection platform (DCP) that includes an ultrasonic wind sensor installed at approximately ten feet above the bridge road deck. The wind sensor connects to a data logger that performs analytics to discern wind gusts and continuous high winds.
Multiple alarm thresholds are used to detect high wind conditions, triggering the data logger to transmit an alert message via a NOAA Geostationary Operational Environmental Satellite (GOES). The satellite transmitters are solar powered. The GOES transmits alerts to FDOT, where they can be disseminated via the FDOT statewide area network or via the Internet.
Sampling of wind conditions is designed to maintain a low-power draw and are performed during one minute sample periods spaced ten minutes apart. Wind anomalies associated with passing vehicles are filtered out, ensuring that only continuous winds and gusts are reported. If wind conditions trigger any of the multiple alarm thresholds, one or more alert messages are relayed via GOES to FDOT.
Overall, the system provides a more efficient, safe, and accurate way of collecting and
disseminating information about potentially dangerous wind conditions on bridges. One of the most significant benefits of this project is the low-cost way in which it was implemented.
Contact: Peter Vega ([email protected])
A few other states have done similar systems. In Nevada, a similar wind warning system has been implemented. The Nevada Department of Transportation utilizes ESS to issue wind warnings and prohibitions automatically driving DMS. Under this system, wind speeds trigger high profile vehicle prohibitions. In addition, NDOT has implementing reduced regulatory speed limits based on wind speeds during construction season. The Montana Department of
26
dynamic message signs. This practice is focused primarily on cross-wind warnings for commercial vehicles.
Case Study Group 5: Bridge Health Monitoring linked to Road Weather Information Systems (Deployed in British Columbia, Delaware, and Iowa)
The British Columbia Ministry of Transportation was approached in 2013 to design and install a weather and bridge structure condition monitoring system for the Port Mann Bridge on Highway 1 near Vancouver. The goal of this effort was to facilitate detection and forecasting of snow and ice accretion onto the bridge structure. The project would also aid in winter maintenance of the highway surface over the bridge.
The system uses most of the traditional RWIS instrumentation, as well as some additional instruments that are related specifically to bridge condition monitoring. Under this system, snowfall and precipitation are measured at a site off the bridge itself, along with a present weather sensor (PWS) for visibility, precipitation classification, and precipitation intensity. This site also has a set of optical pavement sensors on a hill on the east side of the bridge.
On the bridge itself there are 3 additional stations. At mid-span on the bridge deck (50 m elevation) there are optical pavement sensors, and anemometer, air temperature and humidity sensors, and an array of thermistors measuring the surface temperature of the bridge’s cable stays. The tops of the north and south pylons of the bridge each have additional instrumentation as well as a number of web cams for weather and condition monitoring. On the north pylon there is an anemometer (140 m elevation) and another array of thermistors for cable stay temperature monitoring. On the south pylon this setup is repeated, as well as having an ice detector, a
pyranometer, and a leaf wetness sensor to help differentiate between liquid and frozen moisture.
In 2014, the ministry will be adding a laser based sensor to detect the presence and thickness of any snow and ice accretion on the cable stays, and research is ongoing into the feasibility of using the existing array of accelerometers (installed for seismic monitoring) to try and detect the presence of snow and ice on the cable stays by detecting a change in the harmonic frequency of vibration of the stays.
After one winter season’s operation, this system was successful in monitoring the necessary weather and bridge condition parameters to enable decision making for bridge operations, and was also useful for verification of a specialized weather and condition forecasting service.
The Delaware Department of Transportation’s Indian River Inlet monitoring system includes seven (7) different types of sensors, with a total of 146 installed on the bridge. The different sensors are designed to measure the structural response of the bridge under various
environmental loads and live load conditions.
Strain is measured at 70 locations throughout the bridge, including in the edge girders, pylons, and deck. All of the strain measurements are made using Micron Optics os3600 strain sensors. Strain is measured in the pylons at 24 different locations. The pylon sensors are placed in groups of 4 at different elevations, measuring the vertical (Z direction) strain in each wall of the pylon.
Strain is measured in the edge girders at 44 different locations, at 11 different longitudinal positions of the bridge. The longitudinal positions correspond to approximately 1/8 points on the main span and back spans. At each position the strain is measured in both the top and bottom of both the east and west edge girders (i.e., 4 unique strain measurements at each longitudinal position).
In all cases the strain in the edge girder is measured in the longitudinal (X) direction. At any given edge girder location the strain is measured in the top of the edge girder, approximately 6 inches from the top of the girder, and in the bottom of the edge girder, approximately 4 inches from the bottom of the girder. The strains are measured at the approximate center of the cross section.
Strain is measured at 2 locations in the deck. In both cases the strain is measured in the Y direction (transverse to the travel direction). These sensors are located 6” up from the bottom face of the deck and are anchored to the side of the upper mat of rebar. Displacement at each of the two expansion joints and at the bearing on pylon 5 East are measured using a Cleveland Electric Labs model ATG‐FOLS‐7126‐20 displacement transducer. Tilt is measured in 9 locations in the edge girders and pylons.
Acceleration is measured in 21 locations in the cable stays and edge girders. Chloride
penetrations are measured 10 locations in the deck and edge girders. Wind speed is measured in 2 locations at the top of north pylon and at mid span on the east edge girder.
The heart of the fiber‐optic system is a pair of Micro Optics SM130 Interrogators. Each of the 4‐ channel interrogators can scan at a maximum rate of 1 kHz. A 16 channel multiplexer is
28
accelerometers and the few remaining strain sensors. The back end control software for the system is Micro Optic’s “Enlight” software. This is where all of the fundamental control parameters for the system are set and the sensor parameters are stored. On the front end is running Chandler Monitoring Systems, “Intellioptics” software. This is a GUI program that provides overall control and database management of the SHM system.
Contact: Craig Kursinsky ([email protected])
The Iowa DOT also does a significant amount of bridge health monitoring. One example of deploying bridge technologies alongside ESS is on the new US Highway 65 bridge over the Iowa River near downtown Iowa Falls. The bridge is a major upgrade over the 1928 concrete arch structure it replaced. The new bridge is stronger, its
foundation is more secure, and its roadway is 18 feet wider. The steel arch maintains some of the aesthetics of the old bridge.
All over the new bridge are more than 100 gauges, sensors, and other technologies installed by Iowa State University researchers that will be used for continuous, real-time monitoring of the structural health, behavior, and security of the structure. The sensors provide a tremendous amount of quantitative information about the bridge's performance and condition and can be used as a model for much larger structures.
The gauges take 100 readings a second for corrosion, strain, surface conditions, moisture within the steel arch, and structure movements over time. The bridge is also equipped to monitor the security of the structure and to record surveillance video. The system will ultimately display real-time data readings and video feeds on a website.
The Iowa Falls project is a prototype for a system that will monitor a new Interstate 74 bridge over the Mississippi River between Bettendorf and Moline, Ill., when it is eventually
constructed. The Iowa Falls project was also chance to combine various monitoring technologies researchers have developed and tested over recent years. And, it gives researchers and engineers the data they need to verify the assumptions used to design a steel arch bridge, which can be more complicated than designing a traditional bridge.