among the female adolescents in Shahroud, Iran
Mehri Delvarianzadeh1, Aisa Bahar2, Saeed Saadat3,Nahid Bolbol Haghighi4, Mahboubeh Pourheidari4
Abstract
Adolescence is one of the most critical stages of human growth. Its rate and scale is varied around the world; therefore, the consideration of young girls’ dietary intake is highly important. The aim of this study was to determine obesity, overweight, Underweight and stunting using anthropometric index among female adolescent population in Shahroud, Iran. In this cross-sectional study, 731 female students from secondary school with a range of 11-14 years old were studied using the two-phase cluster sampling method. After the initial assesmnets, their anthropometric data was calculated and compared with CDC 2000 standard
and finally, all the information was recorded in questionnaire
forms. The research data was analyzed using SPSS software. The comparison of Body Mass Index (BMI) with the standards showed that 12.9% of the girls were underweight, 12.71% were overweight and 1.7% of them were obese respectively. Besides, 8.2% were suffering from chronic malnutrition and 16.7% from mild malnutrition. The results showed that the studied female students were suffering from malnutrition and in urgent need of macronutrients and micronutrients due to a rapid growth rate.
Consequently, it is recommended to monitor them and provide
nutritional services for them, individually and collectively.
Keywords: Adolescent, Female, Obesity, Overweight, Underweight
Journal of Research & Health
Social Development & Health Promotion Research Center
Vol. 5, No.4, Jan & Feb 2016 Pages: 53-59 Original Article
1. Department of Nutrition, School of Public Health, Shahroud University of Medical Sciences, Shahroud, Iran
2. Department of Sciences, School of Medicine, Semnan University of Medical Sciences, Semnan, Iran
3. Correspondence to: Department of Epidemiology, School of Medicine, Shahroud University of Medical Sciences, Shahroud, Iran
email: saeed.saadat.sd@gmail.com 4. Department of Nursing and Midwifery, School of Paramedical Sciences, Shahroud University of Medical Sciences, Shahroud, Iran
Received: 22 Feb 2015 Accepted: 11 May 2015
How to cite this article: Delvarianzadeh M, Bahar A, Saadat S, Bolbol Haghighi N, Pourheidari M. Obesity, overweight, underweight and Stunting among the female adolescents in Shahroud,Iran . J Research & Health2016; 5(4): 53-59.
Introduction
Adolescence is a physical growth stage from childhood into adulthood which starts with physiological factors and affects all the body. This stage is considered as one of the primary and most delicate stages of human growth [1]. Considering the pace of the adolescents’ growth and hence their accelerated need to receive more energy, vitamins and minerals,
diseases they might catch in adulthood and the
subsequent death indexes [3]. The unpleasant
nutritional condition in young girls as the future mothers which will result in obesity, overweight, underweight and malnutrition due to a lack of necessary micronutreints is worrying. The prevalence of girls’ malnutrition in southern Asia has been reported [4]. Obesity and overweight has also increased in some Middle Eastern countries [5]. Different studies in various parts of Iran showed an unpleasant nutritional condition among young girls. A research in Sistan-Baluchestan, Iran, the prevalence of underweight, overweight and Obesity among the females were respectively16.2%, 8.6%, and 1.5% [6]; and also, a similar study in Yazd, Iran, reported the prevalence of above mentioned factors as 18%, 8.8%, and 4.3%, respectively [7]. Another research in Tehran showed that 54.9% of young girls were overweight and 14.3% underweight [8]. On the other hand, overweight which happens to most female adolescents affects the beginning age of their menstruation (menarche) [9]. An irregular eating pattern, skipping meals especially breakfasts, an increasing use of fatty snacks [10], the lack of iron and its resulted anemia [11] and its relation with fatness [12],
insufficient amount of calcium intake , hyper
lipid, blood pressure, a change in menarche age and obesity are among the recent problems of adolescents worldwide [13,14]. According to the results of Tehran Lipid and Glucose Study (TLGS), many nutritional predictors causing heart and vascular diseases were found among the adolescents of this city [15]. Studies have shown that the adolescents dietary intake often does not provide the recommended amounts of
their required vitamins and minerals [16]. Since
the health promotion of female adolescents as future mothers can improve the posterity’s health, adolescence would be considered as an excellent opportunity to make their nutritional condition better. Hence the analysis of the current problem in the study group before any interference with their dietary intake is pivotal. Regarding the lack of information on adolescents’ nutritional condition and their
nutrients intake in different regions of Iran, including Shahroud, conducting a research in
this field seemed necessary.
Method
This cross-sectional survey was conducted with analytical method by applying interview and anthropometric measuring on 11-14 year old adolescents (731 female students) of Shahroud schools, Iran in 2014.participants were chosen by two-phase random sampling method which
made up 85% of all female students. In the first
stage, 15 clusters (schools) were chosen out of 24 schools of Shahroud and then 49 students were selected from each school randomly.
The gathering data tools were questionnaires with demographic specifications, BMI (Body Mass Index) criterion and questions about the frequency of consumed foods within the
last 24 hours (recall) of the students’ diet. Then the researchers weighed the students (with minimal clothing and no shoes) by the accuracy of 0.1 kilograms in their schools and with the students’ consent. A portable accurate scale, which was controlled daily by a 5-kilogram weight control for balance stability, was used to weight the students. While they were standing on a smooth surface with their legs and feet together closely, their arms on their sides straightly, as well their knees, pelvis, shoulders and heads straightly in one direction, their height was measured by
placing a set-square tangent at their head with
an accuracy of 0.5 centimeters using a height
gauge. The BMI was calculated in square
meters by dividing the weight amount by height amount. Considering the BMI index for age, a
percentile equal or less than 5 was considered
as underweight, a percentile ranging from 5 to 85 as normal weight, a percentile of 85 and
95 in the risk of obesity and a percentile equal
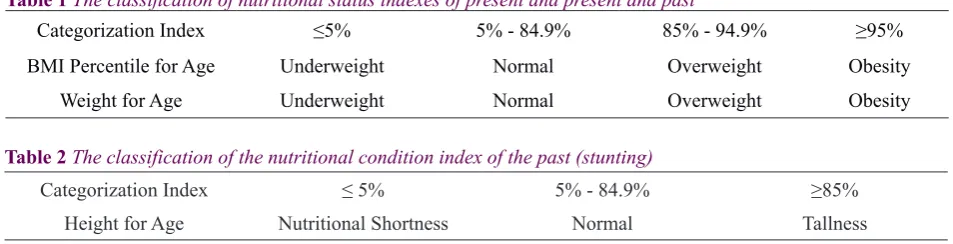
Table 1The classification of nutritional status indexes of present and present and past
Categorization Index ≤5% 5% - 84.9% 85% - 94.9% ≥95% BMI Percentile for Age Underweight Normal Overweight Obesity
Weight for Age Underweight Normal Overweight Obesity
Table 2 The classification of the nutritional condition index of the past (stunting)
Categorization Index ≤ 5% 5% - 84.9% ≥85%
Height for Age Nutritional Shortness Normal Tallness
In this study height index for age has been used as the index of nutritional condition of the past, weight index for age as the index of nutritional condition of both past and present while BMI index for age as the index of nutritional condition of the present [17]. Regarding the Table less than 5% were underweight and nutritional shortness, about 80% normal height and weight, and also about 10% were overweight but only 5% were obese and 15% tall in the study sample[18]. The data related to the energy intake and some of the nutrients were collected using the
questionnaire designed for recording the eaten foods with their frequency in the last three
non-consecutive days of the students’ life. The students were asked to record all the eaten foods, beverages and dietary supplements during
the last 24 hours[19]. Since this questionnaire was based on memory, a questionnaire with some items about the eaten food frequency questionnaire (FFQ) was used to reduce the
error rate. The recorded foods were broken into their components and calculated by using the Tables of cooked or raw ingredients in the taken amounts of energy, carbohydrates, protein and some nutrients (Vitamin B groups, Vitamin C, minerals, iron and calcium) [20].
Finally, the average of the calculated amounts was compared with DRI’s (Dietary Reference Intakes) recommended daily dietary amount. Recommended amounts of DRI’s as the
standard, classifies the nutrients intake as less than, more than and equal to 75% of the
standard. According to this criterion, if at least 20% of the studied people in a society get less than 75% of the recommended nutrients, the
nutrient is considered as a deficient one in the
dietary-sanitary supplement of that society[21].
Generally, some questions about the date of the first menstruation, family income, parents’
job, family size, and parents’ literacy were also asked. The data was analyzed using SPSS and
EPi-Info software. Qualitative data and the percentage of quantitative data were presented
as averages and standard deviations.
Chi-square and T tests were used to compare the
groups (girls on menstruation versus those not
yet) with the 0.05 level of significance.
Results
Totally 731 female students participated in this study. 32.6% of them (237 students) were in the sixth grade of elementary school and 33.7%
(247 students) were both in the first and second
No significant meaningful relation was existed between these students’ BMI, their parents’ education and jobs. But there was a significant meaningful difference between BMI average, the number of family members and the type of the school in which these students were studying in (p=0.000). The analysis of food frequency questionnaire (FFQ) revealed that the most consumed snack among the students was bread and cheese (274 students, 37.5%). Also, a significant relation was observed between breakfast eating and menstruation condition (p=0.0001). 322 (44%) out of 731 students were already on their menstruation with the average menstruation age of 12.9 and the standard deviation of 0.8 years (a range from 11 to 14 years old). There was a
significant meaningful relation between BMI
and menstruation beginning age: the girls with higher BMI had earlier menstruation. The most consumed fruit among the students was apple. 365 students (50%) and 91 students (12.4%) consumed date and raisin. 259 students (35.4%) consumed milk two or three times a week, but 94 students (12.9%) didn’t consume milk daily. 525 students (71.8%) consumed snack.
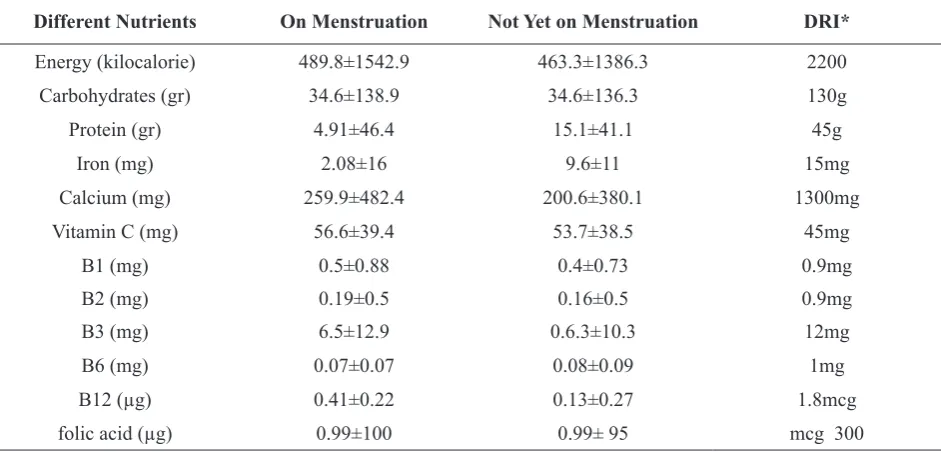
According to the definition [21], a large number
of the studied adolescents were suffering from lack of vitamins such as folic acid, B12, B2 and calcium. The average intake of some nutrients in the students whether on menstruation or not has been presented in Table 5. In regard to the energy intake, it should be said that according to
sufficient intake definition and its measurement, chronic insufficiency is highly important. If a society receives less than 80% of the required
Table 3Students’ distribution based on BMI percentile for age and weight for age in comparison with CDC2000 standard
Categorization Index Percentile Percentile Percentile Percentile
BMI Percentile for
Age Underweight94 (12.9%) 532 (72.69%)Normal 93 (12.71%)Overweight 12 (1.7%)Obese Nutrition Status Chronic Malnutrition Mild Malnutrition Normal Overweight
Weight for Age 47 (6.5%) 133 (18.2%) 542 (74.1%) 9 (1.2%)
Table 4: Status distribution of the students based on height index for age (Past Malnutrition)
Nutrition Status Malnutrition Chronic Mild Malnutrition Normal Tallness
Height for Age 60 (8.2%) 122 (16.7%) 540 (73.9%) 9 (1.2%)
energy, it suffers from a severe lack, if it gets between 81% to 90%,it suffers from a minor lack while if it gets between 90% to 100%, it has a normal status. An intake of more than 120
calories of what is needed has been defined as
over gain[21]. Therefore, both of the groups, those on menstruation or not, suffered from a severe lack of energy intake, however, their iron and protein intake was enough.
Discussion
According to the findings of the present survey,
Table 5 The comparison of macronutrients and micronutrients intake with the recommended daily intake among the young girls of Shahroud based on their menstruation
Different Nutrients On Menstruation Not Yet on Menstruation DRI*
Energy (kilocalorie) 489.8±1542.9 463.3±1386.3 2200
Carbohydrates (gr) 34.6±138.9 34.6±136.3 130g
Protein (gr) 4.91±46.4 15.1±41.1 45g
Iron (mg) 2.08±16 9.6±11 15mg
Calcium (mg) 259.9±482.4 200.6±380.1 1300mg
Vitamin C (mg) 56.6±39.4 53.7±38.5 45mg
B1 (mg) 0.5±0.88 0.4±0.73 0.9mg
B2 (mg) 0.19±0.5 0.16±0.5 0.9mg
B3 (mg) 6.5±12.9 0.6.3±10.3 12mg
B6 (mg) 0.07±0.07 0.08±0.09 1mg
B12 (µg) 0.41±0.22 0.13±0.27 1.8mcg
folic acid (µg) 0.99±100 0.99± 95 mcg 300
*Dietary Reference Intakes
girls [4]. Besides, their status is almost similar to that of Hamedan in which 13.5% of young girls were suffering from underweight [27]. Also, the present study revealed that overweight was the same as Underweight among the students, and this may be one of the most crucial problems of the study sample. Doustmohammadian and Fallah reported obesity among young girls of Semnan [26] and Damghan [25] as 10.5% and 21% . They also found their overweight as 2.7% and 3% respectively. Young girls’ obesity has been reported as 4.5% in Amini’s study [28]. Mohammadpour Ahranjani reported 23.1% of the young females as overweight [29]. Lazzeri estimated overweight among Italian adolescents as 19.6% [30] while it has been reported 18.9% in Nasreddine’s study in Syria [31]. In the present research, the students had a worse overweight status in comparison to Semnan [26] but they were better than those in private schools of Damghan [25] and generally, in comparison to other cited studies.
In the studies conducted in Chile [32], South Africa [33], India [34] and southern India, the outbreak of shortness has been reported respectively as 20%, 23.7% (25.5-51%) and 28.3% [35] . This shows a higher outbreak rate of shortness in comparison with our study population but conforms with LIY’s study
(13.8%) in China[36]. Different social and economic factors were found to be effective on nutritional status in prior studies. Leslie [37] and Schmeer [38] have expressed these effects
too. In Mines’ study, there was a significant
meaningful relation between BMI and the parents’ jobs and literacy, p<0.05. There was
a significant meaningful relation between the
number of family members and the type of school with the menarche age which conforms to Amigo’s study [39]. In the study group, the intake of energy was less than 75% of the standard causing malnutrition which is in contrast with Fallah’s study[25]. He reported that 53% of girls intake energy more than 120% of the standard. It seems that despite the lack of energy intake, the outbreak of overweight (12.9%) is related to low physical activities and more studies are needed in this regard. Also,
according to the findings of Table 5, a high
by DRI revealed that vitamin C, A, B, Folic acid, and Iron intakes were less than DRI’s recommended amounts. Another study in 2007 on Hawaiian female adolescents showed that food consummation for more than 51% of girls include beverage with high sugar. The calcium intake in the current research was less than 75% of the recommended amount. Only 35% of the students consumed milk two or three times a week, so their training in this regard seems necessary. Vue’s study on the young girls in a city of Minnesota showed a low amount of milk consumption too.
The national survey of micronutrients deficiency
status in Iran on 11 regions in 2001 revealed that
young girls suffer from Iron and Zinc deficiency [40].
The present study and other surveys revealed
that the deficiency of energy intake and
micronutrients is a substantial problem among young girls in Shahroud and some of the other cities of our country. From BMI point of view, nutritional status is highly important. Hence, to improve the students’ life style a continuous planning may be a solution to enhance the society health. This would be performed through socio-cultural impacts, providing some nutrition-based educational materials and presenting the appropriate consumption patterns and physical
activities. Consequently, detecting the problems and nutritional deficiencies of growth status
among the adolescents is highly prominent for managers to discover the solutions to the existing problems. The results of the current study can help to promote the posterity’s health status, especially young females as future mothers. Therefore, we should try hardly to raise the individuals’ nutritional knowledge in order to have a growing and healthy society in the future. As mentioned previously, monitoring people and providing them with nutritional services, individually and collectively, is highly recommended.
Acknowledgements
The authors appreciate those who assisted in conducting the study.
Contributions
Study design: M D, A B
Data collection and analysis: A B, S S, M D Manuscript preparation: S S, M D, N BH, M P
Conflict of interest
"The authors declare that they have no competing interests."
References
1- Stang SJ, Larson NC. Nutrition in adolescence: krause’s food & nutrition therapy. 13th ed, Philadelphia, PA: Saunders; 2012.
2- Lijinsky W. N-Nitroso compounds in the diet. Mutat Res-Gen Toxen1999; 443(2): 129-38.
3- Golden BE, Ralph A. Human nutrition and dietetics. 10th ed. Churchil & Livingstome; 2000.
4- Banerjee S, Chakrabarty S, Vasulu TS, et al. Growth and nutritional status of Bengali adolescent girls. Indian J Pediatr2009; 76(4): 391-9.
5- Nasreddine L, Mehio Sibai A, Mrayati M, et al. Adolescent obesity in Syria: prevalence and associated factors. Child Care Health Dev2010; 36(3): 404-13. 6- Montazerifar F, Karajibani M, Rakhshani F, et al. Prevalence of underweight, overweight and obesity among high school girls in sistan va Baluchistan. East Mediterr Health J2009; 15(5): 1293-300.
7- Golestan M, Akhavan K, Falah T, et al. Frequncy of obesity, overweight and underweight in guidance school Yazd students. Journal Shaheed Sadoughi Univercity Medical Sciencese2008; 16(2): 31-5.
8- Esfarjani F, Golestan B, Rasouli B, et al. Surveying the efficacy of education on nutritional knowledge and performance of adolescent girls. Pejouhandeh2004; 9(1): 37-40.
9- Delvarianzadeh M, Bolbolhaghighi N, Ebrahimi H. Relationship between anthropometric paramedics with Menarche age of school girls (11-14) years old in Shahroud. Knowledge & Health J2008; 3(3): 43-7. 10- Hassan AS, Al Dosari S. Breakfast habits and snacks consumed at school among qatari school children aged 9-10 years. J Nutr Food Sci2008; 38(3): 264-70. 11- Mulvihill C, Davies G, Rogers P. Dietary restraint in relation to nutrient intake, physical activity and iron status in adolescent females. J Hum Nutr Diet2002; 15(1): 19-31.
12- Eftekhari M, Mozaffari Khosravi H, Shidfar F. The relationship between BMI and iron status in iron-deficient adolescent Iranian girls. Public Health Nutr2009; 12(12): 2377-81.
13- Flegal KM. Epidemiogic aspects of overweight and obesity in United States. Physiol Behav2005; 86(5): 599-602.
of adolescent girls in Hawaii over a 2 year period. J Am Diet Assoc2007;107(6): 956-61.
15- Azizi F, Rahmani M, Madjid M, et al. Serum lipid levels in an Iranian population of children and adolescents.
IJEM 2003; 17(4): 409-16.
16- Philips S, Starkey LJ, Gary Donald K. Food habits of canadians: food source of nutrients for the adolescent sample. Can J Diet Pract Res2004; 65(2): 81-8.
17- WHO. Physical status: the use and interpretation of anthropometry. World Health Organization Geneva;1995. Available
atURL:http://www.who.int/childgrowth/publications/ physical_status/en/. 1995.
18- Kuezmarski RJ, Ogden CL. CDC growth chart. 2000; Available
atURL:http://www.cdc.gov/nchs/data/series/sr_11/ sr11_246.pdf. 2000.
19- Ghaffarpour M, Kianfar H. The manual for household measures. Tehran: Agricultural publishing; 1999.
20- Dorosti A, Tabatabayi M. Food composition Table. 2nd ed. Tehran: Golazin; 2009.
21- Qasemi H. Principle & theoretical definitions food security. Food Security Especially Letters1984 ;(2): 13-34. 22- Mirmiran P, Verdian S, Sarbazi N, et al. The prevalence of thinness, over weightness in group of adolescents in east Tehran and related in dietary intake. Tehran lipid and glucose study. Paper presented at 6th Iranian nutrition congress 2001. Ahwaz.
23- Jafari S, Keshavarz A, Dorosti A. Factors associated with the nutritional status of adolescent girls based on body mass index in Sari, Iran. J Food Technol Nutr2007; 2(2): 51-6.
24- Taheri F, Fesharaki A, Sadat JR. Study of malnutrition in 6-12 years old children in Birjand. J Birjand Univercity Medical Sciencese 2001; 8: 22-7.
25- Fallah H, Keshavarz A. A study of the height, weight, Body Mass Index (BMI) and intake of nutrients among 11- years old adolescents of nonprofit schools in damghan. J Shaheed Sadoughi Univercity Medical
Sciencese2006; 5: 20-7.
26- Doustmohamadian A, Keshavarz A, Dorosti AR, et al. Survey of the nutritional status and relationship between physical activity and nutritional attitude with indeed of BMI for age in semnan girl secondary school. Koomesh
2005; 6(3): 187-94.
27- Caif Z. Prevalence of obesity in adolescent girls in hamadan. Tehran: Paper presented at 8th Iranian nutrition congress; 2004.
28- Amini M, Abdollahi M, Hoshiar Rad A, et al. Prevalence of overweight and obesity among school children in Tehran
2005. Obes Rev2006; 7(3): 292-7.
29- Mohammadpour Ahranjani B, Rashidi A, Karandish M, et al. Prevalence of overweight and obesity in adolescent Tehran students 2000-2001: an epidemic health problem. Public Health Nutr2004; 7(5): 645-8. 30- Lazzeri, G, Rossi F, Pammolli A, et al. Underweight and overweight among children and adolescents in Tuscany (Italy): prevalence and short term trends. J Prev Med Hyg2008; 49(1): 13-21.
31- Nasreddine L, Mehio Sibai A, Mrayati M, et al. Adolescent obesity in Syria: Prevalence and associated factors. Child Care Health Dev2010; 36(3): 404-13. 32- Muzzo S, Burrows R, Cordero J, et al. Trends in nutritional status and stature among school age children in chile. J Nutr2004; 20(10): 867-72.
33- Mukuddem Petersen J, Kruger HS. Association between stunting and overweight among 10-15 years old children in north west province of south Africa: the thusa bana Study. Int J Obes2004 ; 28: 842-51.
34- Haboubi GJ, Shaikh RB. A comparison of the nutritional status of adolescents from selected schools of south India and UAE: a cross sectional study. Indian J Community2009; 34(2): 108-11.
35- Preashant K, Shaw C. Nutritional status of adolescent girls from an under slum area in south India. Indian J Peaditr2009; 76(5): 501-4.
36- Yan Ping LI, Xiao Qi HU, Xiao Guang Y. Application of the WHO growth reference (2007) to assess the nutritional status of children in China. Bio Med Environ Sci2009; 22(2): 130-5.
37- Leslie TF, Pawloski LR. Socio demographic determinants of growth among malian adolescent females. Am J hum Biol2010; 22(3): 285-90. 38- Schmeer KK. Household in come during childhood and young adult weight status: evidence from a nutrition transition setting. J Health Soc Behav2010; 5(1): 79-91. 39- Amigo H, Costa Machado T, Bustos P. Nutritional status in telarche and Menarch in indigenous and Non- indigenous chilean adolescents. Arch Latinoam Nutr2009; 59(3): 260-5.