Multiparametric profiling of non–small-cell lung
cancers reveals distinct immunophenotypes
Patrick H. Lizotte, … , Mark A. Bittinger, Kwok-Kin Wong
JCI Insight.
2016;
1(14)
:e89014.
https://doi.org/10.1172/jci.insight.89014
.
BACKGROUND.
Immune checkpoint blockade improves survival in a subset of patients
with non–small-cell lung cancer (NSCLC), but robust biomarkers that predict response to
PD-1 pathway inhibitors are lacking. Furthermore, our understanding of the diversity of the
NSCLC tumor immune microenvironment remains limited.
METHODS.
We performed comprehensive flow cytometric immunoprofiling on both tumor
and immune cells from 51 NSCLCs and integrated this analysis with clinical and
histopathologic characteristics, next-generation sequencing, mRNA expression, and PD-L1
immunohistochemistry (IHC).
RESULTS.
Cytometric profiling identified an immunologically “hot” cluster with abundant
CD8
+T cells expressing high levels of PD-1 and TIM-3 and an immunologically “cold”
cluster with lower relative abundance of CD8
+T cells and expression of inhibitory markers.
The “hot” cluster was highly enriched for expression of genes associated with T cell
trafficking and cytotoxic function and high PD-L1 expression by IHC. There was no
correlation between immunophenotype and KRAS or EGFR mutation, or patient smoking
history, but we did observe an enrichment of squamous subtype and tumors with higher
mutation burden in the “hot” cluster. Additionally, approximately 20% of cases had high B
cell infiltrates with a subset producing IL-10.
CONCLUSIONS.
Our results support […]
Clinical Medicine
Immunology
Find the latest version:
Authorship note: P.H. Lizotte and E.V. Ivanova contributed equally to this work.
Conflict of interest: The authors have declared that no conflict of interest exists.
Submitted: June 8, 2016
Accepted: August 4, 2016
Published: September 8, 2016
Reference information:
JCI Insight. 2016;1(14):e89014. doi:10.1172/jci.insight.89014.
Multiparametric profiling of
non–small-cell lung cancers reveals
distinct immunophenotypes
Patrick H. Lizotte,1,2 Elena V. Ivanova,1,2 Mark M. Awad,2,3,4 Robert E. Jones,1,2 Lauren Keogh,1,2
Hongye Liu,1,2 Ruben Dries,2,3,5 Christina Almonte,2 Grit S. Herter-Sprie,2 Abigail Santos,2,3
Nora B. Feeney,1,2 Cloud P. Paweletz,1,2 Meghana M. Kulkarni,1,2 Adam J. Bass,2,4 Anil K. Rustgi,6
Guo-Cheng Yuan,5,7 Donald W. Kufe,2,4 Pasi A. Jänne,1,2,3,4 Peter S. Hammerman,2,3,4
Lynette M. Sholl,4,8 F. Stephen Hodi,2,4 William G. Richards,4,9,10 Raphael Bueno,4,9,10
Jessie M. English,1,2 Mark A. Bittinger,1,2 and Kwok-Kin Wong1,2,3,4
1Belfer Center for Applied Cancer Science, Boston, Massachusetts, USA. 2Department of Medical Oncology and
3Lowe Center for Thoracic Oncology, Dana-Farber Cancer Institute, Boston, Massachusetts, USA. 4Harvard Medical School,
Boston, Massachusetts, USA. 5Department of Biostatistics and Computational Biology, Dana-Farber Cancer Institute,
Boston, Massachusetts, USA. 6Division of Gastroenterology, Departments of Medicine and Genetics,
Abramson Cancer Center, Perelman School of Medicine, University of Pennsylvania, Philadelphia, Pennsylvania, USA.
7Harvard Chan School of Public Health, Boston, Massachusetts, USA. 8Department of Pathology, 9Division of Thoracic
Surgery, and 10International Mesothelioma Program of the Lung Center Surgery, Brigham and Women’s Hospital,
Boston, Massachusetts, USA.
BACKGROUND. Immune checkpoint blockade improves survival in a subset of patients with non–small-cell lung cancer (NSCLC), but robust biomarkers that predict response to PD-1 pathway inhibitors are lacking. Furthermore, our understanding of the diversity of the NSCLC tumor immune microenvironment remains limited.
METHODS. We performed comprehensive flow cytometric immunoprofiling on both tumor and immune cells from 51 NSCLCs and integrated this analysis with clinical and histopathologic characteristics, next-generation sequencing, mRNA expression, and PD-L1 immunohistochemistry (IHC).
RESULTS. Cytometric profiling identified an immunologically “hot” cluster with abundant CD8+ T
cells expressing high levels of PD-1 and TIM-3 and an immunologically “cold” cluster with lower relative abundance of CD8+ T cells and expression of inhibitory markers. The “hot” cluster was
highly enriched for expression of genes associated with T cell trafficking and cytotoxic function and high PD-L1 expression by IHC. There was no correlation between immunophenotype and KRAS or EGFR mutation, or patient smoking history, but we did observe an enrichment of squamous subtype and tumors with higher mutation burden in the “hot” cluster. Additionally, approximately 20% of cases had high B cell infiltrates with a subset producing IL-10.
CONCLUSIONS. Our results support the use of immune-based metrics to study response and resistance to immunotherapy in lung cancer.
C L I N I C A L M E D I C I N E
Introduction
The development of therapies that block inhibitory receptors expressed by T lymphocytes has revolu-tionized cancer treatment. The Food and Drug Administration approved the use of the PD-1 inhibitor nivolumab for treatment of advanced squamous non–small-cell lung cancer (NSCLC) in March of 2015 (1, 2); this approval was later extended to nonsquamous NSCLC in October of that same year, the same month that the PD-1 inhibitor pembrolizumab was granted accelerated approval for treatment of advanced NSCLC expressing the PD-1 ligand PD-L1 (3). Approval of both agents for NSCLC constituted a water-shed moment for immunotherapy and also for the treatment of lung cancer, which is the second most com-mon cancer type and the leading cause of cancer death in the United States (4). There are currently over 100 ongoing clinical trials involving PD-1/PD-L1 pathway blockade in NSCLC.
While clinical responses to immunomodulatory agents have been impressive, the field has been striving to better understand response and resistance to improve patient selection and to aid in the design of rational combination therapy approaches. Objective response rates to nivolumab treatment of 33% (2), 15% (5), and 20% (6) have been reported for squamous NSCLC; and rates of 12% (2), 17% (7), and 19% (1) for have been reported for nonsquamous NSCLC. Comparable response rates of 19.4% (3) and 23% (8) have been report-ed for the PD-1 inhibitor pembrolizumab and the PD-L1 inhibitor atezolizumab, respectively, for either histological subtype. Higher objective response rates have been observed in NSCLC patients with PD-L1+
tumors, as assessed by immunohistochemistry (IHC) (3, 8), and, in particular, responses were highest in patients with PD-L1+ immune cells (8). However, PD-L1 IHC has limitations as a diagnostic; the response
rates are generally higher in PD-L1+ tumors but approach a maximum of 39% (9) or 45% (3) in tumors
with >50% PD-L1 positivity and some PD-L1– tumors also respond to therapy. The methods to assay and
interpret PD-L1 IHC are both diverse and subjective and require further validation, as early results from the BluePrint PD-L1 Assay Harmonization Study have shown (10).
The immune microenvironment is complex, dynamic, and spatially heterogeneous. There are numerous immunosuppressive mechanisms in addition to the PD-1/PD-L1 axis, which may explain why an immuno-logical metric such as PD-L1 IHC positivity is predictive of response to anti–PD-1 therapy in less than half of patients. T cells are capable of expressing multiple inhibitory receptors concurrently, and this compensatory upregulation may account for resistance to PD-1 blockade. For instance, it has recently been demonstrated that the alternative immune checkpoint TIM-3 is upregulated by T cells engaged by anti–PD-1, and this may explain adaptive resistance to anti–PD-1 therapy (11). Response to checkpoint blockade is also likely affected by cytotoxic T lymphocyte–extrinsic (CTL-extrinsic) factors as well, such as the presence of myeloid-derived suppressor cells (MDSCs) and FOXP3+ Tregs, the latter of which have been documented in NSCLC (12). The
presence of MDSCs and Tregs in NSCLC is positively correlated with an abundance of IL-10–producing B regulatory cells (Bregs); all three are associated with NSCLC progression (13).
Response to anti–PD-1 therapy in NSCLC may also be affected by traditional stratifying criteria, such as histological subtype, specific oncogenic driver mutations, and smoking history. For instance, low PD-1 expression in the tumor is correlated with KRAS mutation and low PD-L1 expression is correlated with the presence of EGFR mutations (14). Activating EGFR mutations and adenocarcinomas are more commonly found in never-to-light smokers as compared with smokers, whereas there is a stronger association between smoking and the squamous subtype (15). Smoking is known to increase the prevalence of somatic mutations. Higher mutation rates have been shown to increase the probability that tumors display neoantigens that can trigger T cell–mediated tumor cell lysis and, by extension, enhance response to checkpoint blockade (16).
Results
Characteristics of the NSCLC data set. We compiled a data set with clinical
annotation (Table 1) of 51 freshly resected NSCLC samples, including immunohistochemical determination of PD-L1 status, next-generation sequencing (21, 22), digital droplet PCR for oncogenic driver mutations, mRNA expression analysis by Nanostring, and comprehensive immu-noprofiling of dissociated bulk resected tumors by multiparametric flow cytometry. As part of our effort to comprehensively characterize the tumor immune microenvironment of NSCLC, we utilized multiple antibody pan-els (Supplemental Figure 1; supplemental material available online with this article; doi:10.1172/jci.insight.89014DS1) to determine the abundance of major immune cell lineages. We focused on the characterization of CD4+
and CD8+ T cells, including their differentiation status (FOXP3, CCR7,
CD45RA, CD45RO), expression of activation markers (CD69, CD11a, CD38) and inhibitory receptors (PD-1, TIM-3, LAG-3, CTLA-4), and their proliferation (Ki-67). We also used flow cytometry to measure PD-L1 and PD-L2 expression on monocytes, granulocytes, and tumor cells (defined as CD45–EpCAM+). Clinical, pathologic, and genomic data are shown for each
sample, along with proportions of T cells, B cells, granulocytes, monocytes, NK cells, and NT T cells (Figure 1). There was considerable variability in the proportion of immune cells that were CD8+ T cells, from 1.4% to 44.6%
(mean 11.50% ± 1.476%, SEM, Figure 1). Tumors also exhibited marked-ly heterogeneity in total leukocyte infiltrate, with CD45+ cells comprising
percentages as low as 16% or as high as 97.3% of live cells (mean 69.95% ± 3.074%, SEM). Similarly, we observed a high degree of heterogeneity in the immune infiltrate across this set of tumors.
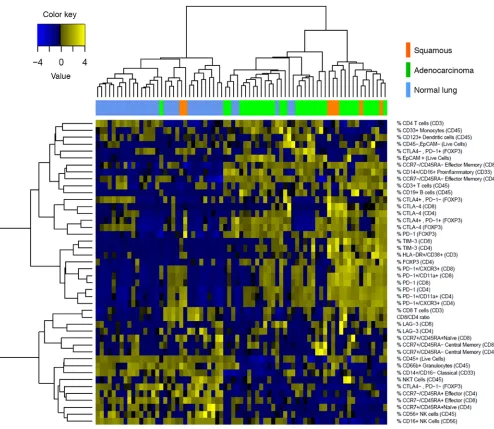
We performed unsupervised hierarchical clustering on tumor and matched normal lung samples using comprehensive immunophenotypic data (Figure 2). As expected, normal lung tissue samples clustered together and tumor samples clustered together. We observed a relative absence in expression of inhibitory receptors by CD4+ and CD8+ T cells in normal lung
as compared with tumors. It is notable that tumors clustering with normal lung displayed high granulocytic infiltrate, which is what we consistently observe in normal lung (Figure 2).
We first analyzed major leukocyte lineages based on clinical, genomic, and histopathologic criteria. We observed no significant difference in the immune cell subsets in tumors from patients who had never smoked as com-pared with patients with a history of tobacco use (Figure 3A). There was also no significant difference when immune infiltrates were compared by tumor histology, although squamous tumors displayed a slight enrichment (P < 0.05) in granulocytes as compared with adenocarcinoma (Figure 3B). Furthermore, there were no significant immune cell differenc-es in KRAS mutant tumors or EGFR mutant tumors or tumors that did not harbor mutations in either of these genes (Figure 3C). Compared with normal lung, tumors consistently showed a significantly increased abundance of CD19+ B cells, FOXP3+ Tregs, CD8+ T cells, and particularly CD45RO+ memory CD8+ T
cells and a significant relative lack of NK cells and NK T cells (Figure 3B). We observed increased CD8+
T cells and memory CD8+ T cells in PD-L1+ tumors as compared with PD-L1– tumors (Figure 3D). There
was no statistically significant difference in immune cell populations among samples that were PD-L1+ in
tumor cells (TC+IC+ and TC+IC–) compared with those that were PD-L1+ only in immune cells (TC–IC+)
(Figure 3D).
Due to the use of PD-1 inhibitors for the treatment of NSCLC and the known upregulation of addi-tional checkpoint receptors that may be associated with resistance to PD-1 therapy (11), we analyzed the expression of PD-1, TIM-3, CTLA-4, and LAG-3 on CD4+ and CD8+ T cells. Smoking status did not
significantly correlate with inhibitory receptor expression (Figure 4A and Supplemental Figure 2). There was significantly increased expression of inhibitory receptors by CD4+ T cells in squamous tumors
rel-Table 1. NSCLC sample characteristics
Sample characteristic No. (%)
Total NSCLC cases 51 (100%) Sex
Male 21 (41%) Female 29 (57%) Race
European descent 43 (84%) Asian 2 (4%) African-American 3 (6%) Unknown 3 (6%) Histology
Adenocarcinoma 42 (82%) Squamous 7 (14%) Adenosquamous 1 (2%) PD-L1 immunohistochemistry completed 43 (84%)
Tumor cell+/immune cell+ 7 (14%)
Tumor cell+/immune cell– 2 (4%)
Tumor cell–/immune cell+ 5 (10%)
Tumor cell–/immune cell– 29 (57%)
Next-generation sequencing or ddPCR
completed 50 (98%) KRAS mutation 18 (35%) EGFR mutation 7 (14%) Nanostring expression analysis completed 29 (57%) Neoadjuvant chemotherapy
Treated with neoadjuvant chemotherapy 7 (14%) Did not receive neoadjuvant chemotherapy 42 (82%) Stage (A and B)
I 23 (45%) II 10 (20%) III 9 (18%) IV 7 (14%) Smoking status
>30 pack years 19 (37%) ≤30 pack years 20 (39%) Current smoker 6 (12%) Former smoker 33 (65%)
C L I N I C A L M E D I C I N E
ative to adenocarcinoma. For CD8+ T cells, we observed no significant difference in levels of PD-1 and
TIM-3 in squamous tumors compared with adenocarcinoma, but we did observe significantly elevated CTLA-4 in squamous tumors. Squamous tumors also displayed significantly increased coexpression of TIM-3 and PD-1 in both CD8+ and CD4+ T cells (Supplemental Figure 2). Inhibitory receptor expression
was uniformly higher in tumor samples when compared with normal lung (Figure 4B). In adenocarci-nomas, KRAS-driven tumors exhibited significantly increased expression of PD-1 on both CD4+ and
CD8+ T cells relative to EGFR-driven and KRAS/EGFR– tumors (Figure 4C). Both CD4+ and CD8+
T cells from PD-L1+ tumors displayed significant upregulation of individual inhibitory receptors and,
similar to what we observed with our analysis by leukocyte lineage (Figure 3D), there were no significant differences in PD-1, TIM-3, and CTLA-4 expression between PD-L1 TC+ and TC–IC+ tumors (Figure
4D). TC+ and TC–IC+ tumors also had increased coexpression of TIM-3 and PD-1 on CD4+ and CD8+ T
cells relative to PD-L1– tumors (Supplemental Figure 2). LAG-3 was uniformly not expressed by T cells
across our NSCLC cohort.
NSCLCs cluster into distinct immunophenotypes. With the expanding clinical application of
immunomod-ulatory agents such as PD-1 blockade for treatment of NSCLC, knowledge of the immunophenotype of the tumor with a high degree of granularity may enable the development of robust biomarkers for patient selection. We employed the t-distributed stochastic neighbor embedding (t-SNE) multidimensional reduction algorithm (19, 23) to analyze our multiparametric immunophenotypic data in an unbiased manner. Close proximity individual NSCLC cases indicate immunophenotypic similarity. Tumor samples separated into two main groups, which we denoted as immunologically “hot” cluster 1 and immunologically “cold” cluster 2, and a third small group defined by high granulocytic infiltrate (gran+) that we grouped within the “hot” cluster based on proximity and shared T cell phenotypic markers (Figure 5). The immunologically “hot” cluster was differentiated by the presence of inflammatory markers, including an abundance of CD8+ T cells
and high expression of inhibitory receptors — particularly PD-1 and TIM-3 — on those CD8+ T cells (Figure
5, A–C). This cluster was further differentiated by infiltration of FOXP3+ Tregs and by expression of PD-L1
on tumor cells and immune cells (Figure 5, D–F). Tumor cell PD-L1 positivity by IHC is directly correlated with PD-L1 expression on EpCAM+ tumors cells, as detected by flow cytometry (Supplemental Figure 3).
We also observed intracluster heterogeneity, with notable examples indicated by arrows and reference case numbers (Figure 5, A–C, E, and F). For example, case 78 displayed high CD8+ T cell infiltrate with
high coexpression of PD-1 and TIM-3, compared with case 25, which had high CD8+ T cell infiltrate with
no expression of PD-1 or TIM-3. Case 23 had high PD-1 expression by CD8+ T cells and high PD-L1
Figure 1. Clinical characteristics of NSCLC data set. Major immune cell lineages profiled from 51 NSCLC patients are depicted as the percentage of live cells and
staining on tumor cells but no TIM-3 on CD8+ T cells. We observed a highly significant positive correlation
between PD-1 and TIM-3 expression by both CD8+ and CD4+ T cells (Supplemental Figure 4). There were
no cases in which CD8+ T cells expressed TIM-3 and not PD-1, but in approximately 20% of cases CD8+
T cells expressed PD-1 and not TIM-3. It is our hope that multicolor flow cytometry will be employed in future prospective studies of patients receiving immunotherapy and that the high level of immunopheno-typic granularity generated by this methodology may help explain heterogeneity in response to anti–PD-1 therapy in NSCLCs and/or tumors with high degrees of lymphocytic infiltrates.
Adenocarcinomas were equally distributed between “hot” and “cold” clusters, whereas squamous tumors were enriched in the “hot” cluster (Figure 5G). Mutant KRAS and EGFR were not associated with immunophenotype, even though all 8 EGFR-mutated tumors were PD-L1– by IHC (Figure 5H). Heavy
smokers (>30 pack years) appeared concentrated in the “hot” cluster relative to smokers (<30 pack years) and never smokers, but this was not statistically significant. We also analyzed smoking status based on pack years and found a trending correlation (P = 0.11) between immunophenotype and smoking status, with higher pack year smokers concentrated in the “hot” cluster (Figure 5I).
Forty-two of fifty-one of our cases were profiled by next-generation sequencing (21, 22). A
forthcom-Figure 2. Clustering of NSCLC data set. Unbiased hierarchical clustering of 51 NSCLC samples and, where available, matched normal lung (top row).
C L I N I C A L M E D I C I N E
ing publication shows that somatic mutational burden quantified from whole-exome sequencing and muta-tion burden extrapolated from this platform are well correlated (24). We, therefore, used the total number of mutations from our OncoPanel results as a proxy and found that mutational burden was significantly higher in tumors in the “hot” cluster (Figure 5J). Mutational burden also correlated with smoking status, as expected (Supplemental Figure 5).
Immunologically “hot” NSCLC tumors display unique phenotype. The unbiased t-SNE clustering was based
Figure 3. Immune cell lineages by clinical features. Percentages of total CD45+ cells based on smoking history (A), histological subtype (B), oncogene
status (C), and PD-L1 immunohistochemical scoring (D) of tumor cells (TC+) and immune cells (IC+) of major immune cell lineages that vary significantly
between tumors are presented. Data for bar graphs were calculated using unpaired Student’s t test. *P < 0.05; **P < 0.01; ***P < 0.001. Mean with SD. Two-way ANOVA: smoker vs. never smoker, P = 0.4207; adenocarcinoma vs. squamous, P = 0.0362; adenocarcinoma vs. normal lung, P = 0.6034; squa-mous vs. normal lung, P = 0.0332; EGFR vs. KRAS, P = 0.1901; KRAS vs. neither, P = 0.9915; EGFR vs. neither, P = 0.2636; TC+ vs. IC+, P = 0.9990; TC+ vs.
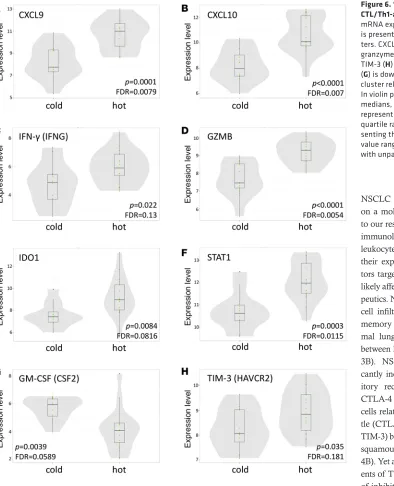
on flow cytometric profiling, and, in order to augment our classification of immunologically “hot” and “cold” tumors, we performed a focused transcriptomic analysis using the Nanostring Human PanCan-cer Immune Profiling Panel (18). Our “hot” cluster showed significant enrichment in CXCL9, CXCL10, IDO1, granzyme B, IFN-γ, and STAT1, which aligns with the “IFN-γ signature” reported elsewhere (25,
Figure 4. T cell expression of inhibitory receptors by clinical features. Percentage of expression of inhibitory receptors PD-1, TIM-3, and CTLA -4 by CD4+
T cells (left) and CD8+ T cells (right) based on smoking history (A), histological subtype (B), oncogene status (C), and PD-L1 immunohistochemical scoring
(D) of tumor cells (TC+) and immune cells (IC+). Data for bar graphs were calculated using unpaired Student’s t test with. *P < 0.05; **P < 0.01; ***P <
0.001. Mean with SD. Two-way ANOVA CD4+ T cells: smoker vs. never smoker, P = 0.2314; adenocarcinoma vs. squamous, P < 0.0001; adenocarcinoma vs.
normal lung, P < 0.0001; squamous vs. normal lung, P < 0.0001; EGFR vs. KRAS, P = 0.2450; KRAS vs. neither, P = 0.1272; EGFR vs. neither, P = 0.0619; TC+
vs. IC+, P = 0.1038; TC+ vs. negative, P < 0.001; IC+ vs. negative, P = 0.3626. Two-way ANOVA CD8+ T cells: smoker vs. never smoker, P = 0.0433;
26) and validates our flow clustering methodology (Figure 6). This signature has previously been shown to enrich for tumors responsive to pembrolizumab anti–PD-1 therapy (25). A fully annotated list of signifi-cantly upregulated and downregulated genes is available in Supplemental Figure 6.
Given the high concordance among flow cytometry–based t-SNE clustering, PD-L1 IHC, histological classification, smoking history, mutational load, and RNA expression analysis, we sought to find the small-est combination of immune parameters that recapitulated the features of our larger data set as a means to simplify biomarker development. The percentage of CD8+ T cells positive for TIM-3 expression (P =
7.39E-08), the percentage of CD8+ T cells positive for PD-1 expression (P = 2.17E-06), and the abundance
of CD8+ T cells (P = 1.06E-04) were among the markers most significantly different between “hot” and
“cold” clusters. We then recalculated the t-SNE plots based on only those 3 markers and found near-perfect recapitulation of the “hot” and “cold” clusters, with only one case moving from “cold” to “hot”; that one case displayed the highest percentage of PD-1 and TIM-3 expression by CD8+ T cells within the
higher-pa-rameter “cold” cluster (Figure 7A). We conclude that as few as 3 immune pahigher-pa-rameters, specifically TIM-3 and PD-1 expression on CD8+ T cells and presence of CD8+ T cells, can be utilized as a proxy to
differen-tiate immunologically “hot” versus “cold” NSCLCs. Furthermore, we propose a model that includes these criteria as a possible metric to assess favorability to immunotherapy (Figure 7B).
NSCLCs are enriched for CD19+ B cells compared with normal lung tissue. We noted high B cell infiltrate
in a subset of tumors, which ranged from 0%–29.7% of total live cells (mean 6.159% ± 1.006%, SEM) (Figure 1). We further analyzed tumor-associated B cells by IHC and flow cytometry. The presence of B cell–rich tertiary lymphoid structures (TLSs) adjacent to tumor margins is a good prognostic factor in many cancers, including NSCLC (27). We found abundant TLSs in the tumor sections we surveyed and that the TLS score correlated well with total CD19+ B cell count measured by flow cytometry
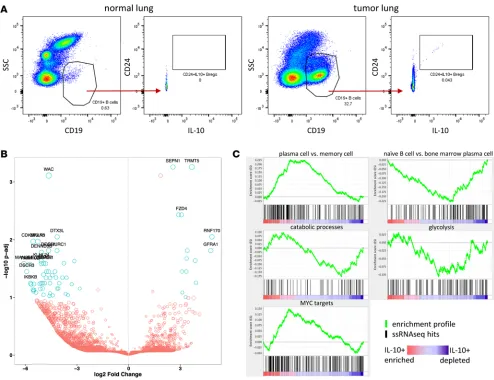
(Sup-plemental Figure 7, A–D). We did not, however, see a significant difference in TLSs between “hot” and “cold” clusters (Supplemental Figure 7E). As part of our flow cytometry B cell profiling, we observed a small, but reproducible population of CD24hiIL-10+ Bregs (28) in tumor but not normal lung tissue
(Fig-ure 8A). IL-10 is the only definitive marker for Bregs, but it is difficult to meas(Fig-ure by flow cytometry due to its low intracellular accumulation. To identify additional phenotypic markers for flow cytometry that could be more sensitive than IL-10 and used as a surrogate for this population, we sorted B cells from a NSCLC tumor with high B cell infiltrate and also B cells from matched normal lung and generated RNA sequencing (RNAseq) data with single-cell resolution (29, 30). In total, 130 cells (47 from normal lung, 83 from tumor) passed our quality control filters. Of these 130 cells, we discovered a total of 9 IL-10–expressing B cells, all of which were sorted from the tumor and were not present in normal lung tissue. The top 20 most significantly downregulated and upregulated genes are highlighted by P value as a function of expression (Figure 8B). We did not uncover any novel candidate surface markers that could be used for future phenotypic identification of these IL-10–producing B cells, nor did we observe an enrichment for canonical Breg surface markers CD24, CD27, or CD38. We did, however, perform gene-set enrichment analysis (GSEA) using a rank list of all genes that were significantly downregulated or upregulated between IL-10–producing and IL-10– B cells and, by this methodology, observed that these
IL-10–producing B cells displayed a transcriptional profile resembling a plasma cell gene signature and not a naive or memory B cell signature (Figure 8C). IL-10–producing B cells also displayed an activated MYC signature. We observed a similar ratio of Igκ/Igλ between normal lung B cells and tumor B cells and between IL-10+ B cells and IL-10– B cells, suggesting the absence of clonality in any of these subsets
(Supplemental Figure 8). This single-cell transcriptomic analysis of B cells provides initial insight into the biology of NSCLC-associated IL-10–producing B cells.
Discussion
Figure 5. NSCLCs align into immunologically “hot” and “cold” clusters. The t-distributed stochastic neighbor embedding (t-SNE) algorithm assigned
NSCLC cases into 2 clusters (dotted ovals). t-SNE plots are identical by NSCLC case coordinate (i.e., each dot is a case and is in the same place in all 10 plots). Percentage of CD8+ T cells of CD3+ lymphocytes (A), percentage of PD-1 expression on CD8+ T cells (B), percentage of TIM-3 expression on CD8+ T cells (C), and
percentage of FOXP3+ Tregs of CD4+ T cells (D), with gradient color coding of blue (low) to red (high). Percentage of PD-L1 expression on tumor cells by IHC (E),
C L I N I C A L M E D I C I N E
NSCLC is a heterogeneous disease on a molecular level, and, according to our results, it is also heterogeneous immunologically. The presence of leukocytes, specifically T cells, and their expression of inhibitory recep-tors targeted by checkpoint blockade likely affects the success of such thera-peutics. NSCLCs have higher CD8+ T
cell infiltrate, particularly CD45RO+
memory CD8+ T cells, relative to
nor-mal lung tissue, with no difference between histological subtypes (Figure 3B). NSCLCs also display signifi-cantly increased expression of inhib-itory receptors PD-1, TIM-3, and CTLA-4 in both CD4+ and CD8+ T
cells relative to normal lung, with lit-tle (CTLA-4) or no difference (PD-1, TIM-3) between adenocarcinoma and squamous for CD8+ T cells (Figure
4B). Yet across tumors there are gradi-ents of T cell infiltrate and expression of inhibitory receptors.
In addition to analysis of indi-vidual immunological characteristics on the basis of clinical features, we also analyzed our flow cyto-metric immunophenotypic data collectively using an unbiased clustering algorithm. The multidimen-sional reduction methodology t-SNE revealed distinct “hot” versus “cold” clusters (Figure 5). The “hot” cluster was distinguished by the squamous subtype and high CD8+ T cell infiltrate, with high
coexpression of PD-1 and TIM-3 (Supplemental Figure 2). Tumors in this cluster also displayed high PD-L1 on tumor cells and immune cells by both flow cytometry and PD-L1 IHC, which were highly correlated (Figure 5, E and F, and Supplemental Figure 3). It is interesting that cases with high gran-ulocytic infiltrate and, by extension, lower CD8+ T cells counts, formed a subgroup within the “hot”
cluster, raising the possibility of granulocyte-associated T cell suppression as a mechanism of immune evasion in this subset. Our data suggest that the total number of CD8+ T cells within the tumor is not
sufficiently predictive of the immunophenotype and that it is important to also know if the T cells express PD-1, TIM-3, both, or other immune checkpoints. CD8+ T cells from granulocyte-high tumors
displayed high PD-1 and TIM-3 expression (Figure 5, B and C), indicating a suppressed antitumor immune response (Figure 7B).
Figure 6. “Hot” cluster is enriched for
CTL/Th1-associated genes. Normalized
In order to corroborate our flow-based clustering and IHC data, we also performed mRNA expression analysis on 29 of our 51 samples. Tumors in the “hot” cluster were enriched for T cell chemoattractants CXCL9 and CXCL10 and CTL/Th1-associated genes IFN-γ and granzyme B (Figure 6). Based on our immunophenotypic data, the immunologically “hot” subset of NSCLC is characterized by inflammatory CD8+ T cell infiltrate, PD-L1 IHC positivity, and PD-1 and TIM-3 positivity on CD8+ T cells and
cor-related with increased tobacco use, high mutation burden, and squamous histology but not with KRAS or EGFR mutation status (Figure 5 and Figure 6). This collective data supports the concept that there is an ongoing antitumor immune response in the “hot” subset of NSCLC that is suppressed.
While a critical accumulation of tumor-infiltrating leukocytes is likely required for targeted immuno-therapies to be successful, simple quantification of leukocyte populations does not capture immune cell phenotypic variation, such as expression of inhibitory receptors and their ligands within the tumor micro-environment. Many immunotherapy biomarker studies perform PD-L1 IHC scoring for tumor cells only and do not include PD-L1 scoring for immune cells. Our data show that TC–IC+ and TC+ have similar
leukocyte infiltrates (Figure 3D) and similar expression of PD-1 and other immune checkpoints (Figure 4D). Therefore, patients who score as PD-L1– by many IHC tests may be, immunologically speaking,
indis-tinguishable from PD-L1+ patients. Relying solely on tumor cell PD-L1 IHC scoring to predict sensitivity
to PD-1/PD-L1 blockade, therefore, excludes some patients who may respond to anti–PD-1 therapy. It is these patients with tumor cell and/or immune cell PD-L1+ tumors that populate our “hot” cluster and
have the highest levels of CD8+ T cells with expression of PD-1 and TIM-3 (Figure 5). Therefore,
inclu-sion of immune cell PD-L1 scoring into PD-L1 IHC diagnostics may enable that test to more accurately
Figure 7. Limited CD8+ T cell markers predict NSCLC immunophenotypes. (A) NSCLC cases were reanalyzed using t-distributed stochastic neighbor
embedding (t-SNE) algorithm based on only 3 parameters: percentage of CD8+ T cells of CD3+ lymphocytes, percentage of TIM-3 expression on CD8+ T cells,
and percentage of PD-1 expression on CD8+ T cells. The structure of “hot” and “cold” clusters matched what was observed for multiparameter clustering.
C L I N I C A L M E D I C I N E
recapitulate the immunophenotypic features indicative of our “hot” cluster (Figure 5). If the critical factor underlying the response to checkpoint blockade is presence of leukocytes, however, then hybrid IHC/flow cytometry–based readouts may improve upon PD-L1 IHC as an immune biomarker. Only prospective studies with immunoprofiling before and after treatment can answer these questions as to what degree leu-kocyte abundance and phenotype can predict response to anti–PD-1/PD-L1 therapy.
In our study smoking status and mutational genotyping do not predict immunological features of NSCLC. There are varying reports of associations between mutant EGFR and KRAS and PD-L1 expres-sion, indicating that genomic data may predict response to single-agent anti–PD-1 (31, 32). However, we did not observe a correlation between KRAS mutation and immunophenotype or PD-L1 IHC. EGFR tumors were all negative for PD-L1 expression on tumor cells but did not cluster preferentially as immu-nologically “hot” or “cold” (Figure 5H). Lack of PD-L1 expression by mutant EGFR lung tumors may explain their recently reported low response rates to PD-1 pathway blockade (33). Our data demonstrate that mutation status is not illustrative of immunophenotype and corroborate previous studies in which nei-ther EGFR or KRAS mutations predicted successful response to anti–PD-1 nei-therapy (34, 35).
Current and former smokers have higher PD-L1 expression compared with never smokers, and this is thought to explain the higher objective response rate of smokers to anti–PD-L1 therapy (31). Based on previous studies, we expected additional immunological markers to correlate with smoking status. The lack of correlation we found between smoking status and PD-L1 IHC may be due to low sample number
Figure 8. B cell abundance and phenotype in NSCLC. (A) Flow cytometry profiling of NSCLCs revealed a small but reproducible population of IL-10+ B
cells in tumor tissue but not normal lung. (B and C) CD19+ B cells were sorted from tumor and normal lung and analyzed by single-cell RNA sequencing.
(9 TC+PD-L1+), but leukocyte abundance and phenotype also did not differ between smokers and never
smokers (Figure 3A and Figure 4A). We then broke down smoking status by the more quantitative metric of pack years and found that smoking status weakly correlates with immunophenotype (Figure 5I). It is well established that smokers have higher response rates to anti–PD-1/PD-L1 therapy. The recent study by Rizvi et al. confirmed that mutation burden as well as presence of mutations in DNA repair genes were cor-related with anti–PD-1 response (36). One limitation of our study is that we did not perform whole-exome sequencing on our cohort to assess a molecular smoking signature that has been shown to correlate with immunotherapy efficiency better than self-reported smoking status. However, the number of mutations identified using our smaller focused sequencing panel correlated with our immunophenotypic clusters, sug-gesting the possible use of simple flow-profiling platforms as part of patient stratification for the treatment. B cells may be protumorigenic or antitumorigenic or even phenotypically heterogeneous within and across tumors (37). In light of the ongoing phase Ib/II clinical trial (NCT02403271) using combination PD-L1 inhibitor (durvalumab) and BTK inhibitor (ibrutinib) for treatment of NSCLC, and the ambiguity as to the role of B cells in NSCLC, we thought a deeper analysis of tumor-associated B cells was warranted. B cells as components of TLSs are good prognostic factors in cancer (27), whereas IL-10–producing Bregs are regarded as negative (28). We found TLSs in 20 of 22 NSCLCs assayed, but there was no association between “hot” or “cold clusters (Supplemental Figure 7E). We consistently identified a small proportion of IL-10–producing B cells in our NSCLC samples that were absent in normal lung tissue (Figure 8A). Bregs are identified by expression of the surface markers CD19+CD24hiCD38hiCD5+CD1dhi, CD24hiCD27+,
and recently Bregs isolated from hepatocellular carcinoma have been shown to be PD-1hiCD5hiCD24–/+
C-D27hi/+CD38dim (28, 38). We sorted B cells from one tumor and performed RNAseq on single cells. We used
the expression of IL-10 as our marker for Bregs, as it is the only consistently expressed gene shared across Breg nomenclatures. IL-10–producing B cells comprised 11% of tumor-sorted B cells (9 of 83) and were absent from normal lung-sorted B cells (0 of 47). Interestingly, IL-10–producing B cells were not enriched in canonical Breg surface antigens CD24, CD27, or CD38, which may highlight the limitation of profiling of Bregs by flow cytometry and explain the reported diversity of phenotypic markers. This exploratory data set provides a proof of principle for the single-cell expression profiling of tumor-infiltrating B cells and a glimpse at their transcriptional profile. Unlike FOXP3+ Tregs, it has been reported that Bregs do
not irreversibly lineage commit at an early developmental point but can adopt a regulatory phenotype at various stages along the B cell developmental continuum (28). The IL-10–producing B cells we analyzed by single-cell RNAseq resemble a plasma cell phenotype, with hallmarks of MYC activation and oxidative metabolism (Figure 8, B and C). More analysis is needed to fully deconstruct Breg transcriptional profiles.
It is likely that the presence of leukocytes in the tumor at time of immunotherapy and the expression of inhibitory receptors by tumor-resident T cells — immunologically “hot” versus “cold” — are the critical factors predicting response to anti–PD-1/PD-L1 therapeutics (8). Traditional stratifying clinical criteria, such as oncogenic driver, do not predict immunophenotype and, therefore, may not inform the use of checkpoint blockade. NSCLCs clearly fall into immunologically “hot” or “cold” clusters, and only inte-gration of flow-based, immunohistochemical, and transcriptomic immunophenotyping can differentiate between the two. It is tantalizing to hypothesize that as few as 3 markers (Figure 7) can recapitulate more comprehensive immunophenotyping to determine whether a NSCLC is “hot” or “cold” and, hence, more amenable to immunomodulatory therapy. This study defines the broad spectrum of immunophenotypes that constitute NSCLC and sets the stage for future prospective studies to identify immune cell–based bio-marker signatures predictive of response and resistance to immunotherapies.
Methods
Tumor preparation, flow cytometry, and antibodies. Fresh tissue was minced in a 10-cm dish then resuspended
C L I N I C A L M E D I C I N E
mg of original sample weight. Surface marker and intracellular staining were performed according to the manufacturer’s protocols (eBioscience). FcR was blocked prior to surface antibody staining using Human FcR Blocking Reagent (Miltenyi). Cells were fixed in 1% PBS +2% FBS and washed prior to analysis on a BD FACSCanto II HTS cell analyzer or BD LSRFortessa with FACSDiva software (BD Biosciences). Data were analyzed using FlowJo software version 10.0.8. Cell viability was determined by negative live/ dead staining. Antibodies were specific for the following human markers: CD3 (HIT3a; UCHT1), CD8 (RPA-T8), CD14 (M5E2; MphiP9), CD24 (ML5), CD45 (HI30), CD56 (B159), CCR7 (150503), EpCAM (EBA-1), HLA-DR (G46-6), PD-1 (EH12.1), and IgG1 isotype control (MOPC-21) from BD Bioscienc-es; CD3 (UCHT1), CD4 (RPA-T4), CD14 (M5E2), CD15 (W6D3), CD16 (3G8), CD19 (HIB19), CD20 (2H7), CD21 (Bu32), CD25 (BC96), CD27 (M-T271), CD33 (WM53), CD38 (HIT2), CD40L (26–33), CD45 (HI30), CD45RA (HI100), CD45RO (UCHL1), CD56 (HCD56; 5.1H11), CD66b (G10F5), CD69 (FN50), CD83 (HB15e), CD123 (6H6), CD160 (BY55), CD163 (GHI/61), CTLA-4 (L3D10), CXCR5 (J252D4), EpCAM (9C4), HMGB1 (3E8), IgM (MHM-88), Ki-67 (Ki-67), PD-1 (EH12.2H7), PD-L1 (29E.2A3), PD-L2 (24F.10C12), TIM-3 (F38-2E2), NKG2D (1D11), NKp46 (9E2), IgG2a isotype con-trol (MOPC-173), IgG2b isotype concon-trol (MPC-11), and IgG1 isotype concon-trol (MOPC-21) from BioLeg-end; Pan-cytokeritin (C11) and PD-L1 (E1L3N) from Cell Signaling Technologies; CD45 (2D1), FOXP3 (236A/E7), and IL-10 (236A/E7) from Affymetrix/eBioscience; and LAG3 (polyclonal) and isotype con-trol (polyclonal) from R&D Systems.
Collection of surgical samples. NSCLC tumors, matched normal lung, and, where available, peripheral
blood, were obtained from 51 patients. Tumor samples were collected into sterile medium (DMEM +FBS) and stored on ice before dissociation, which was begun 30–45 minutes after resection. The histological subtype of tumors was confirmed by a board-certified pathologist with expertise in thoracic malignancies (LMS). Patients from all disease stages were selected in an unbiased manner over a 2-year period. The pro-spective nature of this study assumed heterogeneity in immune profiles.
Tumor genotyping via digital droplet PCR. Cryosections from tumor tissue samples underwent DNA
-VIC-TTGGAGCTGGT-GGCGTA-MGB-NFQ-3′, 5′-FAM-TTGGAGCTGATGGCGTA-MGB-NFQ-3′. For KRAS G12V assay, primer sequences were as follows: forward, 5′-GCCTGCTGAAAATGACTGAATATAAACT-3′, reverse, 5′-GCTGTATCGTCAAGGCACTCTT-3′; probe sequences were as follows: 5′ -VIC-TTGGAGCTGGT-GGCGTA-MGB-NFQ-3′, 5′-FAM-TTGGAGCTGTTGGCGTA-MGB-NFQ-3′. For KRAS G12S assay, primer sequences were as follows: forward, 5′-GCCTGCTGAAAATGACTGAATATAAACT-3′, reverse, 5′-GCTGTATCGTCAAGGCACTCTT-3′; probe sequences were as follows: 5′-VIC- TTGGAGCTGGT-GGCGTA-MGB-NFQ-3′, 5′-FAM-TAGTTGGAGCTAGTGGCGTA-MGB-NFQ-3′. Analysis of the ddPCR data was performed with QuantaSoft analysis software (Bio-Rad) that accompanied the droplet reader. Positive and negative clusters were set using the FAM and VIC thresholds based on the amplitude of positive controls that were ran concomitantly with each assay.
mRNA analysis. Total RNA was extracted using the Qiagen RNeasy kit or Arcturus PicoPure RNA
Iso-lation Kit. RNA quality and concentration was assessed using an Agilent Bioanalyzer 2100. For each sam-ple, mRNA transcript abundance for 770 genes of interest was quantified using the Nanostring nCounter Human PanCancer Immune Profiling Panel according to the manufacturer’s protocol from 100 ng of total RNA and analyzed using nSolver 2 software and the HumanPanCancerImmunology_1.0.36 analysis mod-ule. Differential expression of genes in response to “hot” versus “cold” sample breakdown was performed in the Advanced Analysis module of nSolver. For each gene, a single linear regression was fit using all selected covariates to predict expression. Output is shown with nonadjusted P value as well as Benjami-ni-Hochberg FDR. Univariate box/violin plots were generated via Gene Descriptive Analyses module. Nanostring array data have been deposited in the NCBI GEO public data repository (reference series acces-sion GSE84799).
IHC. Four-micron-thick sections of formalin-fixed, paraffin-embedded tissue were baked at 37°C
over-night, deparaffinized, and rehydrated. Peroxidase activity was blocked with 1.5% hydrogen peroxide in methanol for 10 minutes. Antigen retrieval was performed in a Decloaking Chamber NxGen pressure cook-er (Biocare Medical) at 120°C in Dako Target Retrieval Solution (Dako). For PD-L1/Pu.1 double staining, sections were first incubated with anti-PU.1 (BD Bioscience) at 1:100 for 40 minutes at room temperature. Anti-mouse Dako EnVision+ System-HRP (DAB) was used for the detection. Following the wash, sections were incubated with anti–PD-L1 (CST) at 1:200 for 40 minutes at room temperature. PowerVision Poly-AP Anti-Rabbit IgG (Leica)with Permanent Red was used for the detection. For B cell–specific activator pro-tein (BSAP or PAX5)/CD3 double IHC staining, sections were first incubated with anti-PAX5 (Abcam) at 1:30 for 40 minutes at room temperature. Dako EnVision+ anti-Rabbit (DAB) was used for the detection. Sequentially sections were incubated with anti-CD3 (Dako) at 1:300 for 40 minutes at room temperature. Leica’s PowerVision Poly-AP Anti-Rabbit IgG with Permanent Red was used for the detection. All sections were counterstained with Mayer’s Hematoxylin.
PD-L1 expression in tumor cells was considered positive if ≥1% of tumor cells had membranous stain-ing of any intensity. Pu.1 is a transcription factor of B lymphocytes and cell myeloid lineages, among which it is overexpressed in monocytes, histiocytes, and dendritic cells. Pu.1 expression is restricted to the nucleus and was examined simultaneously to better assess PD-L1 staining in immune cells. Alveolar macrophages have been shown to express multiple markers nonspecifically and were excluded from analysis.
BSAP is a transcription factor expressed in the nuclei of pro, pre, and mature B cells. B cell quantifica-tion was performed using the Positive Pixel Count v9 algorithm by Aperio (Leica). Intensity of weak pixels (Iwp[High] parameter) was changed from 220 to 180 to adjust to hematoxylin staining on nuclei as a proxy for total cell count. DAB staining for BSAP was counted as the number of strong positive pixels. Permanent red staining for CD3 was detected as positive pixels; however, some areas of darker hematoxylin as well as nonspecific staining in alveolar macrophages were also detected as positive pixels, preventing correct quan-tification of CD3 staining. The BSAP score was generated by dividing the number of strong positive pixels by the area score (number of negative + positive + strong positive pixels multiplied by 10e8).
eval-C L I N I eval-C A L M E D I eval-C I N E
uated and scored blinded to clinical data.
Single-cell RNAseq. Live CD45+CD19+ cells were sorted directly into 2 μl of Qiagen TCL buffer in
Eppendorf TWIN.TEC skirted 96-well plates. The SmartSeq2 libraries were prepared according to the SmartSeq2 protocol (29, 41) with some modifications (42). Briefly, total RNA was purified using RNA-SPRI beads. Poly(A)+ mRNA was converted to cDNA, which was then amplified. cDNA was subjected to transposon-based fragmentation that used dual indexing to barcode each fragment of each converted transcript with a combination of barcodes specific to each sample. In the case of single-cell sequencing, each cell was given its own combination of barcodes. Barcoded cDNA fragments were then pooled prior to sequencing. Paired-end (PE) sequencing was carried out twice with 25-bp reads, with an additional 8 cycles for each index. The Smart-Seq2 data was processed at the Broad Technology Labs according to established computational pipeline. Data were separated by barcode and aligned using Tophat version 2.0.10 (43) with default settings. PE 25-bp reads were mapped to the UCSC human genome (hg19) by Bowtie2/Tophat (44) using the Broad pipeline. Only cells that had a minimum of 100,000 PE reads, with at least 20% aligning to the genome, were retained for further analysis. FeatureCounts (45) was used to count features based on the Gencode v19 (http://www.gencodegenes.org/) transcriptome annotation. Features that were not detected in more than 10 cells were removed. High-quality single cells were further selected based on feature complexity, read distribution, and number of genes detected. In total 47 normal and 83 tumor cells were retained in this process. DESeq2 (46) was used to detect differentially expressed genes between groups based on raw counts. Counts were normalized according to their library size and displayed as log2 (normal-ized counts + 1). IL-10 high and low clusters were classified based on Kmeans clustering on log2 (normal-ized counts) excluding cells with no detectable IL-10 expression. To identify positive or negative enriched biological or molecular signatures between the IL-10 high and low population we applied the GSEA tool (47) on the DESeq2-generated list of differentially expressed genes. This list was preranked based on the multiplication value of log2 fold change and –log10(adjusted P value). To estimate clonality of B cell Ig-pro-ducing cells, we summed all reads of genes that are located in κ and λ loci, respectively, as well as all reads of IGK and IGL genes annotated by Gencode v19, and calculated the κ/λ ratio (Igκ/IGgλ). Cells with a ratio between 1:3 and 3:1 were considered to express both loci. Cells with ratios >3:1 or <1:3 were defined
κ- or λ-producing cells, respectively. Single-cell RNAseq NGS data have been deposited in the NCBI GEO public data repository (reference series accession GSE84799).
Statistics. The unsupervised nonlinear dimension reduction method t-SNE (19, 20) was applied to
inves-tigate in reduced dimension space how 51 tumors are located in relation to each other based on multipara-metric flow cytometry data. t-SNE denotes a tree-based algorithm, which minimizes the divergence of neighborhood closeness moving from high dimensions to low dimensions. For the embedding, 15 param-eters were used, which are listed in Supplemental Figure 9. P values of less than 0.05 were considered significant. Unpaired, 2-tailed Student’s t test was used to assess significance.More in-depth descriptions are given in individual figure legends.
Study approval. The present studies were reviewed and approved by the Dana-Farber/Harvard Cancer
Center (DF/HCC) institutional review board (Boston, Massachusetts, USA) under protocol 98-063 and all were performed in accordance with relevant guidelines and regulations. Written informed consent was obtained from all subjects prior to participation in this study. Informed consent by patients to DF/HCC protocol 02-180 enabled collection of clinical and demographic data, genomic characterization by Onco-Panel, and analysis of tissue by IHC.
Author contributions
PHL and EVI wrote the manuscript. PHL, EVI, MMA, REJ, LK, CA, NBF, and MMK generated data. HL and RD provided advanced statistical analysis. MMA and AS provided NGS OncoPanel data. WGR and RB acquired patient samples. PHL, EVI, MMA, GSHS, CPP, AKR, GCY, DWK, PAJ, PSH, FSH, JME, MAB, AJB, and KKW designed the experiments. LMS analyzed histology.
Acknowledgments
Grimmett from the Molecular Biology Core Facility Genomics group for Nanostring analysis. We thank Mei Zhang from the Pathology Department at Brigham and Women’s Hospital for immunohistochemical staining. This work was supported by The Robert A. and Renée E. Belfer Family Foundation, the Expect Miracles Foundation, the Starr Cancer Consortium, Stand Up To Cancer - American Cancer Society Lung Cancer Dream Team Translational Research Grant (Grant Number: SU2C-AACR-DT17-15), the Conquer Cancer Foundation, the International Association for the Study of Lung Cancer, the National Cancer Insti-tute (R01 CA205150), and the Damon Runyon Cancer Research Foundation.
Address correspondence to: Kwok-Kin Wong, Dana-Farber Cancer Institute, 450 Brookline Avenue, Boston, Massachusetts 02215, USA. Phone: 617.632.6084; E-mail: kwok-kin_wong@dfci.harvard.edu.
1. Borghaei H, et al. Nivolumab versus docetaxel in advanced nonsquamous non-small-cell lung cancer. N Engl J Med. 2015;373(17):1627–1639.
2. Topalian SL, et al. Safety, activity, and immune correlates of anti-PD-1 antibody in cancer. N Engl J Med. 2012;366(26):2443–2454. 3. Garon EB, et al. Pembrolizumab for the treatment of non-small-cell lung cancer. N Engl J Med. 2015;372(21):2018–2028. 4. EER Stat Fact Sheets: Lung and Bronchus Cancer. National Cancer Institute. http://seer.cancer.gov/statfacts/html/lungb.html.
Accessed August 30, 2016.
5. Rizvi NA, et al. Activity and safety of nivolumab, an anti-PD-1 immune checkpoint inhibitor, for patients with advanced, refrac-tory squamous non-small-cell lung cancer (CheckMate 063): a phase 2, single-arm trial. Lancet Oncol. 2015;16(3):257–265. 6. Brahmer J, et al. Nivolumab versus docetaxel in advanced squamous-cell non-small-cell lung cancer. N Engl J Med.
2015;373(2):123–135.
7. Gettinger SN, et al. Overall Survival and Long-Term Safety of Nivolumab (Anti-Programmed Death 1 Antibody, BMS-936558, ONO-4538) in Patients With Previously Treated Advanced Non-Small-Cell Lung Cancer. J Clin Oncol. 2015;33(18):2004–2012. 8. Herbst RS, et al. Predictive correlates of response to the anti-PD-L1 antibody MPDL3280A in cancer patients. Nature.
2014;515(7528):563–567.
9. Taube JM, et al. Association of PD-1, PD-1 ligands, and other features of the tumor immune microenvironment with response to anti-PD-1 therapy. Clin Cancer Res. 2014;20(19):5064–5074.
10. Yu H, Boyle TA, Zhou C, Rimm DL, Hirsch FR. PD-L1 Expression in Lung Cancer. J Thorac Oncol. 2016;11(7):964–975. 11. Koyama S, et al. Adaptive resistance to therapeutic PD-1 blockade is associated with upregulation of alternative immune
check-points. Nat Commun. 2016;7:10501.
12. Black CC, Turk MJ, Dragnev K, Rigas JR. Adenocarcinoma contains more immune tolerance regulatory t-cell lymphocytes (versus squamous carcinoma) in non-small-cell lung cancer. Lung. 2013;191(3):265–270.
13. Liu J, et al. Aberrant frequency of IL-10-producing B cells and its association with Treg and MDSC cells in non small cell lung carcinoma patients. Hum Immunol. 2016;77(1):84–89.
14. Ji M, et al. PD-1/PD-L1 expression in non-small-cell lung cancer and its correlation with EGFR/KRAS mutations. Cancer Biol Ther. 2016;17(4):407–413.
15. Dela Cruz CS, Tanoue LT, Matthay RA. Lung cancer: epidemiology, etiology, and prevention. Clin Chest Med. 2011;32(4):605–644. 16. McGranahan N, et al. Clonal neoantigens elicit T cell immunoreactivity and sensitivity to immune checkpoint blockade. Science.
2016;351(6280):1463–1469.
17. Galon J, Angell HK, Bedognetti D, Marincola FM. The continuum of cancer immunosurveillance: prognostic, predictive, and mechanistic signatures. Immunity. 2013;39(1):11–26.
18. Cesano A. nCounter(®) PanCancer Immune Profiling Panel (NanoString Technologies, Inc., Seattle, WA). J Immunother Cancer. 2015;3:42.
19. Murtagh F. Multidimensional Clustering Algorithms. Fionn Murtagh. http://www.multiresolutions.com/strule/old-articles/ MultidimensionalClusteringAlgorithms_FMurtagh.pdf. Accessed: August 9, 2016.
20. Murtagh F, Legendre P. Ward’s hierarchical agglomerative clustering method: which algorithms implement Ward’s criterion? J Classif. 2014;31(3):274–295.
21. Cryan JB, et al. Clinical multiplexed exome sequencing distinguishes adult oligodendroglial neoplasms from astrocytic and mixed lineage gliomas. Oncotarget. 2014;5(18):8083–8092.
22. Wagle N, et al. High-throughput detection of actionable genomic alterations in clinical tumor samples by targeted, massively parallel sequencing. Cancer Discov. 2012;2(1):82–93.
23. Van Der Maaten L. Accelerating t-SNE Using Tree-based Algorithms. J Mach Learn Res. 2014;15(1):3221–3245.
24. Frampton GM, et al. Assessment of tumor mutation burden from >60,000 clinical cancer patients using comprehensive genom-ic profiling. ASCO University. http://meetinglibrary.asco.org/content/167202-176. Accessed August 9, 2016.
25. Sinkus AG, Kuliev AM. [Chromosomal damage in a series of cell generations following application of rubomycin C to cultured human cells]. Biull Eksp Biol Med. 1972;73(11):112–114.
26. Ananiev T, Vasilev Z, Nalbaiski B. [Congenital abnormalities of the uterus]. Akush Ginekol (Sofiia). 1974;13(2):136–143. 27. Germain C, Gnjatic S, Dieu-Nosjean MC. Tertiary lymphoid structure-associated B cells are key players in anti-tumor
immuni-ty. Front Immunol. 2015;6:67.
28. Balkwill F, Montfort A, Capasso M. B regulatory cells in cancer. Trends Immunol. 2013;34(4):169–173.
29. Picelli S, Faridani OR, Björklund AK, Winberg G, Sagasser S, Sandberg R. Full-length RNA-seq from single cells using Smart-seq2. Nat Protoc. 2014;9(1):171–181.
C L I N I C A L M E D I C I N E
31. Calles A, et al. Expression of PD-1 and its ligands, PD-L1 and PD-L2, in smokers and never smokers with KRAS-mutant lung cancer. J Thorac Oncol. 2015;10(12):1726–1735.
32. Lastwika KJ, et al. Control of PD-L1 expression by oncogenic activation of the AKT-mTOR pathway in non-small cell lung cancer. Cancer Res. 2016;76(2):227–238.
33. Gainor JF et al. EGFR mutations and alk rearrangements are associated with low response rates to PD-1 pathway blockade in non-small cell lung cancer (NSCLC): A Retrospective Analysis [published online ahead of print May 25, 2016]. Clin Cancer Res. doi:10.1158/1078-0432.CCR-15-3101.
34. Creelan BC. Update on immune checkpoint inhibitors in lung cancer. Cancer Control. 2014;21(1):80–89.
35. Garon EB et al. Abstract A20: MK-3475 monotherapy for previously treated non-small cell lung cancer (NSCLC): Preliminary safety and clinical activity. Clin Cancer Res. 2014;20(2 Supplement):A20–A20.
36. Rizvi NA, et al. Cancer immunology. Mutational landscape determines sensitivity to PD-1 blockade in non-small cell lung can-cer. Science. 2015;348(6230):124–128.
37. Fremd C, Schuetz F, Sohn C, Beckhove P, Domschke C. B cell-regulated immune responses in tumor models and cancer patients. Oncoimmunology. 2013;2(7):e25443.
38. Xiao X, et al. PD-1hi identifies a novel regulatory B-cell population in human hepatoma that promotes disease progression. Cancer Discov. 2016;6(5):546–559.
39. Oxnard GR, et al. Noninvasive detection of response and resistance in EGFR-mutant lung cancer using quantitative next-gener-ation genotyping of cell-free plasma DNA. Clin Cancer Res. 2014;20(6):1698–1705.
40. Goc J, Fridman WH, Sautès-Fridman C, Dieu-Nosjean MC. Characteristics of tertiary lymphoid structures in primary cancers. Oncoimmunology. 2013;2(12):e26836.
41. Picelli S, Björklund ÅK, Faridani OR, Sagasser S, Winberg G, Sandberg R. Smart-seq2 for sensitive full-length transcriptome profiling in single cells. Nat Methods. 2013;10(11):1096–1098.
42. Trombetta JJ, Gennert D, Lu D, Satija R, Shalek AK, Regev A. Preparation of single-cell RNA-Seq libraries for next generation sequencing. Curr Protoc Mol Biol. 2014;107:4.22.1–4.2217.
43. Kim D, Pertea G, Trapnell C, Pimentel H, Kelley R, Salzberg SL. TopHat2: accurate alignment of transcriptomes in the pres-ence of insertions, deletions and gene fusions. Genome Biol. 2013;14(4):R36.
44. Trapnell C, Pachter L, Salzberg SL. TopHat: discovering splice junctions with RNA-Seq. Bioinformatics. 2009;25(9):1105–1111. 45. Liao Y, Smyth GK, Shi W. featureCounts: an efficient general purpose program for assigning sequence reads to genomic
fea-tures. Bioinformatics. 2014;30(7):923–930.
46. Love MI, Huber W, Anders S. Moderated estimation of fold change and dispersion for RNA-seq data with DESeq2. Genome Biol. 2014;15(12):550.